Implications
Death of calves around parturition, particularly from first calving heifers, is something many dairy farmers would like to reduce as much as possible. Despite the low heritability, the probability that calves survive the perinatal period can be increased by usage of sires with favourable genetic merit. This study shows that the effect of sire selection is substantially larger for herds with low livability, that is, those farms that can benefit most from improvements. There may be other management options to reduce perinatal death, but such changes may require continuous efforts of the farmer and may be linked to their attitude towards animals (Kielland et al., Reference Kielland, Skjerve, Østerås and Zanella2010). Therefore, sire selection for livability is probably the most practical method to reduce perinatal death, particularly on farms with relatively high calf losses.
Introduction
Stillbirth of calves is of economic importance for dairy farmers, affects animal welfare (Mellor and Stafford, Reference Mellor and Stafford2004) and is linked with possible societal concerns regarding dairy farming (Mee et al., Reference Mee, Berry and Cromie2008). In general, stillbirth rates are considerably higher for calves of heifers than for calves of older cows (Harbers et al., Reference Harbers, Segeren and de Jong2000; Steinbock et al., Reference Steinbock, Näsholm, Berglund, Johansson and Philipsson2003; Eriksson et al., Reference Eriksson, Näsholm, Johansson and Philipsson2004). Relatively high stillbirth rates have been reported for calves of Holstein heifers in the Netherlands and several other countries (Harbers et al., Reference Harbers, Segeren and de Jong2000; Meyer et al., Reference Meyer, Berger and Koehler2000; Steinbock et al., Reference Steinbock, Näsholm, Berglund, Johansson and Philipsson2003; Hansen et al., Reference Hansen, Lund, Pedersen and Christensen2004) compared with Norwegian red heifers (Heringstad et al., Reference Heringstad, Chang, Svendsen and Gianola2007), American Jersey and Brown Swiss (Yao et al., Reference Yao, Weigel and Cole2014) and several Holstein crosses (Heins et al., Reference Heins, Hansen and Seykora2006). According to Mee (Reference Mee2013), continuing high and sometimes even increasing stillbirth rates have resulted in a kind of normalisation and farm blindness to the issue. Important factors regarding stillbirth are calving difficulties and prolonged deliveries (Meyer et al., Reference Meyer, Berger and Koehler2000; Murray and Leslie, Reference Murray and Leslie2013), as well as body shape of the calves (Barrier et al., Reference Barrier, Mason, Dwyer, Haskell and Macrae2013). For calving difficulties and stillbirth cause and effect are interrelated, but a substantial part of the stillbirths does not coincide with calving difficulties (Meijering, Reference Meijering1984; Mee et al., Reference Mee, Berry and Cromie2008).
Livability (the opposite of stillbirth) has direct and maternal genetic components and studies estimating heritabilities for first and later parities reported highest values for first parity (Harbers et al., Reference Harbers, Segeren and de Jong2000; Meyer et al., Reference Meyer, Berger, Thompson and Sattler2001; Steinbock et al., Reference Steinbock, Näsholm, Berglund, Johansson and Philipsson2003; van Pelt and de Jong, Reference van Pelt and de Jong2011). Reported direct heritabilities range from 0.011 to 0.038 for heifers and from 0.003 to 0.014 for cows. Reported maternal heritabilities range from 0.010 to 0.085 for heifers and from 0.001 to 0.007 for cows. Meyer et al. (Reference Meyer, Berger, Thompson and Sattler2001) reported that herd-year variances for perinatal survival were about twice as large as genetic variances for heifers. This suggests that other factors, for example, management, have considerable influence on perinatal survival. Management can affect perinatal mortality in multiple ways, for example, through monitoring around parturition (Gundelach et al., Reference Gundelach, Essmeyer, Teltscher and Hoedemaker2009), timing of interventions (Murray and Leslie, Reference Murray and Leslie2013) and social isolation of the cow (Dufty, Reference Dufty1981). Consequently, when estimating genetic parameters and risk factors for stillbirth, herd effects should be taken into account (Emanuelson et al., Reference Emanuelson, Oltenacu and Gröhn1993). Generally, genetic evaluation models correct for herd effects by incorporating them as fixed or random effects. This approach assumes the same genetic parameters for all herds. However, these could depend on herd environment level, and differences observed in stillbirth rates between calves of different bulls may be reduced or increased in specific environments. Moreover, breeding values of bulls may rerank across environments. In other words, it can be hypothesised that genotype by environment interaction exists for stillbirth across herds with different levels of stillbirth. Therefore, selection performed in one environment may yield different responses in other environments. Several studies have indicated the existence of such a phenomenon for health and fertility traits (Pryce et al., Reference Pryce, Nielsen, Veerkamp and Simm1999; Kearney et al., Reference Kearney, Schutz and Boettcher2004; Windig et al., Reference Windig, Calus and Veerkamp2005). To quantify genotype by environment effects often a multi-trait model is employed, whereby a single trait is treated as several traits, one trait for each environmental level defined (Falconer, Reference Falconer1952). Genetic correlations across environments can be estimated, and correlations below 1 indicate that genotype by environment interaction exists. Frequently, herd environment categories are defined by the average level of the trait analysed, so that genetic variation can be quantified in poor, average and superior environments (Calus et al., Reference Calus, Windig and Veerkamp2005). For livability, genotype by environment interaction has not been quantified. The objective of this study was to investigate the possible existence of genotype by environment interaction for livability of first calving heifers.
Material and methods
Data and trait definition
Our primary source of data was the national cattle identification database, in which all Dutch cattle are individually recorded from 1993 onwards. Within 3 days after birth all living calves should be ear tagged with a unique lifetime number and recorded in the database. When a birth is recorded, the farmer also identifies the cow that calved (this animal should be recorded as present on the farm at the time of calving). However, animals that are stillborn or die before they are ear tagged do not get a lifetime number and will not be recorded in the cattle identification database. Their cadavers, however, are collected by the destructor, and when reporting cadavers without ear tags farmers have to identify the mother of the calf, so these calving events are also recorded. We considered a calving to have resulted in a non-livable calf (score 0) if the dam had a calving date but no calf was recorded, and a livable calf (score 1) otherwise. This implies that our definition of livability excludes calves that were born alive but died within 24 to 72 h after birth, in line with recommendations of Philipsson et al. (Reference Philipsson, Foulley, Lederer, Liboriussen and Osinga1979) for the definition of stillbirth, although they arbitrarily mentioned a period of 24 h after birth.
The Dutch cattle improvement organisation CRV records calving events, pedigree information and insemination dates for milk recording herds and provided the data for this study. Data for calving’s between 1 January 1993 and 27 October 2012 were merged with birth records from the cattle identification database. The dataset with records for each calving contained herd identification, cow id, calf id (with fake id-numbers for stillborn calves), calving date, parity of the cow, livability (binary: calf registered or not) and last insemination date. The following records were deleted: twin calves, calves conceived via embryo transfer, calves from cows that were not kept for milk production, and calves born after a gestation length <260 or >300 days. Gestation length was classified as (% of records between brackets): 1=260 to 265 (0.6), 2=266 to 270 (2.1), 3=271 to 275 (11.9), 4=276 to 280 (33.8), 5=281 to 285 (34.5), 6=286 to 290 (13.4), 7=291 to 295 (2.8) and 8=296 to 300 days (0.8). For first calving, the age at calving had to be between 640 and 1075 days, and was classified as (% of records between brackets): class 1=<670 (0.5), 2=670 to 699 (3.8), 3=700 to 729 (16.4), 4=730 to 759 (25.7), 5=760 to 789 (19.2), 6=790 to 819 (12.5), 7=820 to 849 (7.9), 8=850 to 879 (5.0) and 9=>879 days (9.0). Moreover, sire and maternal grandsire of the calf had to be known. In total, 18 628 642 records were available, of which 5 086 092 were from first calving’s from 32 532 different herds. Pedigree information for all cows and calves was available, the full pedigree file contained 23 500 673 records. Because non-livability is predominantly a problem at first calving (in our dataset the percentages were 13.0% v. 4.9% for later parities) and stillbirth is genetically a different trait for heifers and cows (Philipsson et al., Reference Philipsson, Foulley, Lederer, Liboriussen and Osinga1979), only records for first calving were used in this study.
Definition of herd environment levels
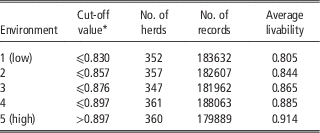
Herd environment levels were based on percentages of heifer calvings resulting in calves alive after birth. For each herd, the number of heifer calving’s per year was counted, and only records of heifer calving’s (916 153) from herds with a minimum of 10 heifer calving’s in each year from 1993 to 2012 (1777 herds) were selected for analysis. Herd estimates for heifer calf livability fractions were calculated with a simple linear model with year as fixed effect and herd and interaction of herd and year as random effects. Substantial differences were observed between herds over the 20-year period, with herd estimates ranging from 0.742 to 0.954. Short-term deviations from the overall trends were observed for individual herds, as indicated by a statistically significant interaction of herd and year. After ranking the herd estimates from low to high, five herd environment levels were defined such that the numbers of records for the different classes were similar (see Table 1). Livability in each herd environment level was defined as a different trait. Before further analysis, phenotypic trends from 1993 to 2012 were estimated for each of the five defined herd levels with a linear model accounting for mean, year, herd level and the interaction of year and herd level as fixed effects. For the genotype by environment interaction analyses, records from sires with less than five offspring (either as sire or maternal grandsire) were removed from the dataset. After this edit, 902 662 records remained from calves of 11 219 different sires with 14 030 different maternal grandsires. In total, 15 027 sires with direct or maternal records were included. The pedigree file of those sires and maternal grandsires contained records of 77 556 different animals.
Description of herd environments for heifer calf livability

* Based on herd estimates from linear model.
Model
Bivariate sire-maternal grandsire linear models were used for the estimation of genetic parameters. Particularly, when estimating genotype by environment interaction, it is important to have observations in multiple environments for the genotypes considered. This justifies the use of sire maternal grandsire models (with bulls as genotype) for our study instead of animal models that are used for routine genetic evaluations for livability in several countries (van Pelt and de Jong, Reference van Pelt and de Jong2011). Moreover, variance components for livability in many cases are estimated using sire-maternal grandsire models (Hansen et al., Reference Hansen, Lund, Pedersen and Christensen2004; Cole et al., Reference Cole, Wiggans, VanRaden and Miller2007; Heringstad et al., Reference Heringstad, Chang, Svendsen and Gianola2007).
One single multitrait analysis including all five traits, that is, livability in each of the five defined herd levels, was not feasible due to computational limitations. We therefore applied the following bivariate model to all pairwise combinations of the five herd levels:
 $${\bf Y} = \mu {\plus}{\bf Xb} {\plus}{\bf Z}_{\rm s} {\bf u_{\rm s}} {\plus} {\bf Z_{{\rm mgs}} {\bf u_{{\rm mgs}} {\plus}{\bf e}$$
where Y is a vector with phenotypes, Xb represents fixed effects including herd (1 to 1777), interaction of year (1 to 20) and month (1 to 12), age at calving (1 to 9), gestation length (1 to 8) and covariates for heterosis and recombination of both cow and calf. Coefficients for heterosis and recombination were calculated according to Van der Werf and De Boer (Reference Van der Werf and De Boer1989). Heterosis of heifers gradually declined from 40% in 1992 to 7% to 8% from 2005 onwards, heterosis of the calves declined from 28% in 1992 to 5% to 8% from 2005 onwards. Although sex of the calf and the ease of calving are known factors related to stillbirth, we could not take these factors into account because no information was available regarding these variables for stillborn calves. Although it has been noted that fitting herd as random effects may be beneficial when herds contain small effective numbers of daughters (van Bebber et al., Reference van Bebber, Reinsch, Junge and Kalm1997), herd was fitted as fixed effect because it has been noted that fitting them as random can lead to severely overestimated genotype by environment interaction (Calus et al., Reference Calus, Bijma and Veerkamp2004). Finally, sire (u s) and maternal grandsire (u mgs) were included as random effects, where sire represented the direct effect and maternal grandsire represented the indirect effects, and e is a vector of random residuals. Calculations were performed with ASReml (Gilmour et al., Reference Gilmour, Gogel, Cullis and Thompson2009).
The above model was implemented as a linear instead of a threshold model, because of computational limitations. To enable comparison of our results to those of other studies using a threshold model, the transformed heritabilities on the underlying scale (
 $h_{{{\rm transf\_us}}}^{2} $
) were computed from the heritability (h
2) estimates computed for each herd level using the model described above as
 $$h_{{{\rm transf\_us}}}^{2} ={{h^{2} p(1{\minus}p)} \over {z^{2} }}$$
where p is average incidence of livability at the herd level and z is the ordinate of the standard normal density function corresponding to p (Dempster and Lerner, Reference Dempster and Lerner1950).
Estimated variance components
From the models described above, several variance components were estimated. Direct heritabilities were computed for each environment as
 $$\hat{h}_{{{\rm direct}}}^{2} ={{\hat{\sigma }_{{{\rm direct}}}^{2} } \over {\hat{\sigma }_{e}^{2} {\plus}\hat{\sigma }_{{{\rm sire}}}^{2} {\plus}\hat{\sigma }_{{{\rm mgs}}}^{2} }}$$
where
 $\hat{\sigma }_{{{\rm direct}}}^{2} $
is the direct genetic variance computed as
 $$\hat{\sigma }_{{{\rm direct}}}^{2} =4\hat{\sigma }_{{{\rm sire}}}^{2} ,\,\hat{\sigma }_{{{\rm sire}}}^{2} $$
is the estimated sire variance,
 $\hat{\sigma }_{e}^{2} $
is the estimated residual variance and
 $\hat{\sigma }_{{{\rm mgs}}}^{2} $
is the estimated sire-maternal grandsire variance that accounts for maternal effects. Indirect or maternal heritabilities were computed for each environment as
 $$\hat{h}_{{{\rm maternal}}}^{2} ={{\hat{\sigma }_{{{\rm maternal}}}^{2} } \over {\hat{\sigma }_{e}^{2} {\plus}\hat{\sigma }_{{{\rm sire}}}^{2} {\plus}\hat{\sigma }_{{{\rm mgs}}}^{2} }}$$
where
 $\hat{\sigma }_{{{\rm maternal}}}^{2} $
is computed as
 $\hat{\sigma }_{{{\rm maternal}}}^{2} =\hat{\sigma }_{{{\rm sire}}}^{2} {\plus}4\hat{\sigma }_{{{\rm sire,mgs}}} {\plus}4\hat{\sigma }_{{{\rm mgs}}}^{2} $
(Wiggans et al., Reference Wiggans, Misztal and Van Tassell2003),
 $\hat{\sigma }_{{{\rm sire,mgs}}} $
is the estimated covariance between sire and maternal effects. A derivation of this formula is provided in the Appendix of Eaglen et al. (Reference Eaglen, Coffey, Woolliams and Wall2013). When computing the maternal heritability, we ignored the term
 $\hat{\sigma }_{{{\rm sire,mgs}}} $
to compute the phenotypic variances, following (Wiggans et al., Reference Wiggans, Misztal and Van Tassell2003), who argued this is justified because mating of sires to their daughters is rare. Another reason for a non-zero
 $\hat{\sigma }_{{{\rm sire,mgs}}} $
could be widespread application of compensatory mating, but this is also unlikely to be the case for a trait like livability. Genetic correlations between environments for direct effects were calculated as
 $$\hat{r}_{{g_{{{\rm direct}}} }} ={{\hat{\sigma }_{{{\rm sire}_{1} ,{\rm sire}_{2} }} } \over {\sqrt {\hat{\sigma }_{{_{{{\rm sire}_{1} }} }}^{2} \hat{\sigma }_{{_{{{\rm sire}_{{\rm 2}} }} }}^{2} } }}$$
where
 $$\hat{\sigma }_{{{\rm sire}_{1} ,{\rm sire}_{2} }} $$
is the estimated sire covariance between environments 1 and 2, and
 $$\hat{\sigma }_{{_{{{\rm sire}_{1} }} }}^{2} $$
is the estimated sire variance for environment 1. Genetic correlations between environments for indirect or maternal effects were calculated as
 $$\hat{r}_{{g_{{{\rm maternal}}} }} ={{\hat{\sigma }_{{{\rm mgs}_{1} ,{\rm mgs}_{2} }} } \over {\sqrt {\hat{\sigma }_{{_{{{\rm mgs}_{1} }} }}^{2} \hat{\sigma }_{{_{{{\rm mgs}2}} }}^{2} } }}$$
where
 $\hat{\sigma }_{{{\rm mgs}_{1} ,{\rm mgs}_{2} }} $
is the estimated maternal grandsire covariance between environments 1 and 2, and
 $\hat{\sigma }_{{_{{{\rm mgs}_{1} }} }}^{2} $
is the estimated maternal grandsire variance for environment 1. Approximate standard errors of all reported variance components were computed using ASReml.
Results
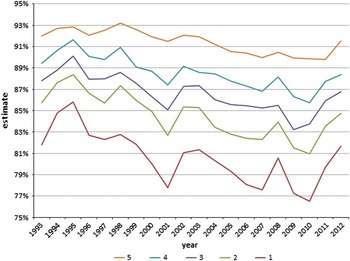
The overall average livability of the calves in the selected dataset was 86.2%, and ranged from 71.2% to 97.7% in individual herds. Yearly averages declined between 1995 and 2010 from 89.8% to 83.3%. The analysis of trends over time (1993 to 2012) for the five herd environment levels revealed a highly significant (P<0.001) interaction term for year and herd environment level on top of significant year and herd environment level effects (both P<0.001) for livability. This indicates that the changes over the years 1993 to 2012 were not the same for the five herd environment levels, although negative phenotypic trends were estimated in all environments (Figure 1). The main difference between the trends is that the decline was stronger and fluctuations between years were larger in environments with lower average livability.
Year-estimates of livability for herd environments 1 (low) to 5 (high).

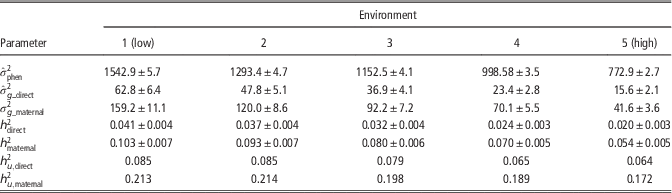
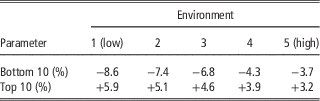
Estimated genetic and phenotypic variances substantially decreased from environment 1 to 5 (Table 2). Direct and maternal heritabilities decreased with increasing herd environment level, respectively, from 4.1%, and 10.3% in the lowest environment to 2.0% and 5.4% in the highest environment (Table 2). Heritablities on the underlying scale showed similar trends, but with smaller differences between environments. Relative decreases of heritabilities were smaller than those of genetic variances, because residual variances decreased to a lesser extent than the genetic variances (Table 2). Maternal heritability was consistently two to three times higher compared with direct heritability. Differences between sires in their genetic contributions to the viability of calves from heifers were enlarged in herd environments that have high perinatal mortality, as shown by the higher estimated genetic variance in those environments. This is illustrated by the estimates for direct sire effects of the best and worst sires in the different environments (Table 3). The difference between the top and bottom 10 sires was 14.5% in the environment with lowest average livability and only 6.9% in the highest environment.
Estimated phenotypic and direct and maternal genetic variances (*10 000) and heritabilities and standard errors for livability in herd environments 1 (low) to 5 (high), as well as the heritabilities transformed to the underlying scale (h 2 u*)

Average model estimates for sire effects on livability of top 10 and bottom 10 sires in each environment (based on 285 sires with at least 50 calvings in each environment)

Estimates for the genetic correlations between different herd environments ranged from 0.904 to 0.998 for direct livability and from 0.961 to 0.991 for maternal livability (Table 4). Thus, both sets of correlations had values that were close to one, indicating that ranking of the sires was similar in the different environments. For example, among the 285 sires with at least 50 calvings in each environment the same two sires ranked highest in all environments while seven sires always ranked in the bottom 10 group regardless of the environment. Furthermore, there was no clear trend of decreasing correlations for more different herd environments.
Estimated genetic correlations (±s.e.) for direct (above diagonal) and maternal (below diagonal) livability between herd environments 1 (low) to 5 (high)

Discussion
Herd environment trends and variability of herd level
The estimates for the five herd environments (Figure 1) show that similar trends occurred in each class of herd environments. Herds that performed best apparently are less sensitive to factors that impair livability of calves from heifers. Consequently, differences between the highest and lowest herd environments enlarged between 1993 and 2010. The data used for this study cover a period of 20 years. An important question is whether temporary fluctuations may have affected allocation of the herds to the five groups. Year to year fluctuations of livability within herds were considerable, probably mainly caused by a sampling effect of the small number of heifer calvings per herd per year (average 25.8, s.d. 13.2). This phenomenon probably also contributed to the relatively large herd-year variances for perinatal survival estimated by Meyer et al. (Reference Meyer, Berger, Thompson and Sattler2001). Simulations of herd year averages for livability by random sampling from a binomial distribution with likelihoods of livability equal to realised average herd liveabilities showed year to year variations within herds similar to those in our dataset (results not shown). Because we used a 20-year period for the assignment of herds to livability categories the sampling effect was largely eliminated. Only herds where the management changed considerably over those years may for some years be assigned to the wrong environment. However, herds that showed fluctuations larger than expected by random sampling were rare. Therefore, we conclude that herd classification was sufficiently reliable, but the differences between environments are probably somewhat underestimated as a result of averaging over 20 years.
Heritability estimates and genetic correlations
The objective of this study was motivated by the question whether differences in herd environments should lead to differences in the breeding strategy to improve livability of first calving heifers. This objective was partly achieved by estimating heritabilities for herd environments with different levels of average livability. Our heritability estimates for herd environment 3, which is considered to be the average herd environment, were in line with those used for the Dutch breeding value estimation (van Pelt and de Jong, Reference van Pelt and de Jong2011). These values are high when compared with heritabilities estimated for other dairy populations (Philipsson et al., Reference Philipsson, Foulley, Lederer, Liboriussen and Osinga1979; Meyer et al., Reference Meyer, Berger, Thompson and Sattler2001; Steinbock et al., Reference Steinbock, Näsholm, Berglund, Johansson and Philipsson2003) and estimates for beef breeds (Eriksson et al., Reference Eriksson, Näsholm, Johansson and Philipsson2004). In our study, the estimates for maternal heritabilities were higher than the estimates for direct heritabilities. This is in line with the results of Meyer et al. (Reference Meyer, Berger, Thompson and Sattler2001) and Hansen et al. (Reference Hansen, Lund, Pedersen and Christensen2004), although Steinbock et al. (Reference Steinbock, Näsholm, Berglund, Johansson and Philipsson2003) found higher heritability for the direct effect. Transformation to the underlying scale resulted in considerably higher values, this is in line with results of (Eriksson et al., Reference Eriksson, Näsholm, Johansson and Philipsson2004) and (Steinbock et al., Reference Steinbock, Näsholm, Berglund, Johansson and Philipsson2003). An upward bias of the transformed values can be expected (Hansen et al., Reference Hansen, Lund, Pedersen and Christensen2004), but the trend of increasing heritability in poorer environments is again found and the estimates on the observed scale underestimate the genetic influence on livability.
Our main interest was the comparison of heritabilities across herd environments and genetic correlations between these environments. We found a consistent trend of increasing heritability with decreasing herd levels of livability, both for direct and maternal heritability. The difference between the low and high environments was substantial, indicating that effects of genetic merit are enlarged in poorer environments. The genetic correlations were very close to unity for both direct and maternal effects. This implies that the ranking of bulls is largely independent of herd environment, and that a separate breeding programmes for different herd environments is not needed (Mulder and Bijma, Reference Mulder and Bijma2006).
Definition of stillbirth and livability
The definitions of stillbirth and livability are important when comparing results from different studies that analysed similar traits. Usually calves that die just before, during, or within 24 or 48 h after parturition are considered stillborn (Philipsson et al., Reference Philipsson, Foulley, Lederer, Liboriussen and Osinga1979), so the figures include some postnatal mortalities. In the study of Gundelach et al. (Reference Gundelach, Essmeyer, Teltscher and Hoedemaker2009), the majority of mortalities were true stillbirths or occurred within 1 h after calving. Prolonging the period after parturition that calves should survive to be classified as alive to 48 h (as in our study) therefore probably only marginally increased overall stillbirth rates. To distinguish stillborn calves from aborted calves and abnormal deliveries it is recommended to exclude calving records with deviant gestation lengths and more than one calf in evaluations (Philipsson et al., Reference Philipsson, Foulley, Lederer, Liboriussen and Osinga1979). This selection was also applied in our study. The data used in our study did not contain information to derive to what extent the trends in Figure 1 are caused by an increase in true stillbirth or an increase in early postnatal mortality, but according to a study of Santman et al. (Reference Santman, Van Wuijckhuise, Muskens, Smolenaars and Van Schaik2013) mainly postnatal mortality has increased in the Netherlands.
Management effects
This study focussed on perinatal mortality for first calvings, because the majority of non-viable calves are from heifers. In our dataset, a live calf was registered for 87.0% of first parity calvings and for 95.1% of higher parity calvings. The latter figure shows that perinatal mortalities are also considerable for higher parities. The figures for our data are similar to values reported by Meyer et al. (Reference Meyer, Berger, Thompson and Sattler2001) for the United States. Perinatal mortality for heifers and cows are regarded as different but correlated traits (Philipsson et al., Reference Philipsson, Foulley, Lederer, Liboriussen and Osinga1979), which probably at least partly but not exclusively explains our observation that herds with low livability of calves from heifers also had relatively low livability of calves from cows (results not shown). This suggests that some management factors affect livability of calves from both heifers and cows.
Our data showed substantial differences between herds in perinatal mortality of calves from heifers over a 20-year period. Several studies have investigated factors that can explain herd differences. Gundelach et al. (Reference Gundelach, Essmeyer, Teltscher and Hoedemaker2009) argued that insufficient monitoring and intervention around parturition increases risk of stillbirth, because of a need to limit the duration of the birth process, particularly of the second stage of labour. Inappropriate timing of interventions can eventually cause stillbirth (Murray and Leslie, Reference Murray and Leslie2013), but timed intervention is only possible when the animals are observed intensively. Adequate care for the newborn calves, particularly those that need extra care, for example, feeding colostrum, may improve their survival (Murray and Leslie, Reference Murray and Leslie2013). For 90% of the cases of perinatal mortality in the study of Mee (Reference Mee2004), the calf was alive at the start of calving, therefore it is stated that the majority of these mortalities could have been prevented.
Presumably, for herds with relatively poor livability improvements could be achieved by, for example, improved supervision of the animals around parturition (Mee et al., Reference Mee, Sánchez-Miguel and Doherty2014). However, such adaptations may be difficult to realise in practise.
Consequences for bull selection
Although heritability for livability is low, there is considerable genetic variation between sires in the incidence of perinatal mortality of their calves and the calves of their daughters. The results of this study showed that the impact of sire selection is highest for herds with highest incidence of perinatal mortalities. Both the genetic standard deviations of direct and maternal effects were two times larger in the poorest compared with the best environments. This implies that the expected response to selection is two times larger in the poorest compared with the best environment. Breeding values for livability are available in the Netherlands and have low genetic correlations with other relevant traits (personal communication M. van Pelt). This probably makes bull selection the easiest applicable tool to reduce the incidence of perinatal mortality.
Concluding remarks
Negative trends in average heifer calf livability across years were found for all five herd environments, while the trend was steeper for herd environments with lower average livability. Heritability and genetic variation of first parity calf livability were substantially larger in environments where the likelihood to survive the perinatal period was low compared with environments where it was high. The genetic correlations between environments were all above 0.90, indicating that ranking of sires was very similar for all environments. Selecting sires to improve livability is expected to be twice as effective for herds with relatively low livability as for herds with relatively high livability.
Acknowledgements
The authors acknowledge financial support from the Dutch Dairy Board, and acknowledge CRV BV (Arnhem, The Netherlands) for providing the data. Members of the project team ‘Levensvatbare Kalveren’ (Sophie van der Ploeg and Jan Klaver (PVV), Jan Muskens (GD), René van der Linde (CRV), and Rita Hoving (Wageningen UR Livestock Research)) are gratefully acknowledged for their contributions to the discussions involved in this research.