NOMENCLATURE
 $\phi_o$
latitude for the origin airport
- $\lambda_o$
longitude for the origin airport
- $\phi_d$
latitude for the destination airport
- $\lambda_d $
longitude for the destination airport
- R
radius of the Eart
- d
distance between the origin and destination airports
- $T_{out}$
taxi-out time
- $E_7$
rate of fuel burn during taxi-out, or taxi-in
- $N_e$
number of engines of the particular aircraft
- $T_{off}$
take-off time
- $E_{100}$
rate of fuel burn during take-off
- $M_{al}$
mass of fuel burnt during the approach and landing phase
- $T_{al}$
approach and landing time
- $E_{30}$
rate of fuel burn during approach and landing
- $M_{in}$
mass of fuel burnt during the taxi-in
- $T_{in}$
taxi-in time
- $r_0$
initial position
- r
final position
- $v_0$
initial velocity
- v
final velocity
- a
acceleration
- t
time interval
- $a_{cv}$
vertical component of the aircraft’s acceleration
- $FL_c$
current light level
- $FL_n$
flight level
- $TAS_c$
current value for true air speed
- $TAS_n$
next value for true air speed
- $f_{cc}$
current value for fuel flow for climb
- $f_{cn}$
next value for fuel flow for climb
- $R_c$
current value for the rate of climb and descent
- $R_n$
next value for the rate of climb and descent
- $t_c$
time the aircraft took to travel from
$FL_c$ to $FL_n$- $a_{cl}$
longitudinal component of the aircraft’s acceleration
- $d_{cl}$
longitudinal distance
- $\gamma_c$
aircraft’s trajectory angle
- $d_{cg}$
ground distance
- $F_{cf}$
fuel flow variation for climb
- $f_{cn}$
next value for fuel flow during climb
- $f_{cc}$
current value for fuel flow during climb
- $C_c$
total amount of fuel consumed during the time interval
$t_c$- $a_{dv}$
vertical acceleration for descent
- $t_d$
time of descent
- $a_{dl}$
longitudinal acceleration for descent
- $d_{dl}$
longitudinal distance for descent
- $\gamma_d$
aircraft’s trajectory angle for descent
- $d_{dg}$
ground distance for descent
- $F_{df}$
fuel flow variation for descent
- $C_d$
total amount of consumed fuel for descent
- $d_{g}$
ground distance for cruise
- $t_{cr}$
time interval to fly the ground distance
- $\Phi$
fuel flow for cruise
- F
consumed fuel for the cruise phase
- $rmse_{if}$
root mean square error


Subscripts
- n
Flightaware block time iterator
- i
sample type
- f
flight
1.0 INTRODUCTION
Block time consists of the flight duration of the aircraft from the departure gate to the arrival gate. The main goal for this paper is to define, formulate and solve a simplified flight plan to calculate Block Time and Fuel (BTF) consumed for a flight, starting at departure gate and ending at the arrival gate. We formally discuss the various phases of the integrated flight plan, the method by which we are calculating the values for altitude, time, ground distance and consumed fuel, and finally, using real airline data, we validate our method by providing statistical results. To the best of our knowledge, we are the first to provide such computational results from departure to arrival gates for an extensive list of flights.
The remainder of the paper is organised as follows. In Section 2 we will review the most important concepts regarding the flight phases. Section 3 provides a review of relevant work done to model flight trajectory and flight modelling using institutional data. in Section 4, we will integrate the European Monitoring and Evaluation Programme / European Environment Agency (EMEP/EEA) emissions data set with Base of Aircraft Data (BADA) aircraft performance data tables to derive the BTF model and deliver reliable block time, and consumed fuel. In Section 5 we will describe minutely the findings, their implications and the relationship to previous values, namely to the ROADEF 2009 Challenge and real flight values. Finally, in Section 6, we make an appraisal of the results, derive conclusions and predict future work.
2.0 FLIGHT PHASES
In this section we define the flight phases, which are the periods a flight is divided into. These periods are important as we examine the different rate of fuel consumed during each phase. We consider that the flight begins at the time the aircraft is ready to move with the purpose of flight and continues until such time it comes to rest at the end of the flight and the primary propulsion system is shut down.
Each aircraft has a flight plan consisting of a document that can include, among others, information regarding the aircraft such as Fuel On Board (FOB) and Take-Off Weight (TOW), and also regarding the flight such as origin and destination airports, flight type, expected departure and arrival time, cruising speed, maximum expected altitude, chosen route and an alternate route, and the weather forecast during the flight. All this information will help the cockpit crew to pilot the aircraft safely during the flight phases. Block time encompasses all the phases of the flight, and typically, a flight has the following phases:
• Taxi-out is the controlled movement of an aircraft on the ground, under its own power, between its parking area and the point of the runway from which its taking-off operations will occur.
-
• Take-off is the phase of flight in which an aircraft moves from the runway to flying in the air.
-
• Climb is the phase of flight during which the aircraft ascends to a predetermined cruising altitude after take-off. Although a single climb phase is typical, multiple-step climb phases may also occur.
-
• Cruise occurs between the climb and descent phases and is usually the longest part of a journey. It ends as the aircraft approaches its destination and the descent phase of the flight commences in preparation for landing. During the cruise phase, because of operational or Air Traffic Control (ATC) reasons, an aircraft may climb or descend from one flight level to a higher or lower flight level. During very long flights, aircraft are able to fly higher as the weight of the fuel aboard decreases. Usually, pilots ask ATC to allow them to fly at the optimum flight level for the aircraft they are operating. This optimum flight level is dependent on, for example, the type of aircraft, its operating weight and the length of the flight. ATC generally accepts this request if it does not jeopardise safety. For most commercial passenger aircraft, the cruise phase of a flight consumes the majority of the fuel.
-
• Descent is the phase of flight during which the aircraft decreases its altitude in preparation for landing and is the opposite of the climb phase. As for the climb, descent can be continuous or stepped as a result of operational or ATC reasons; continuous descent is the most fuel-efficient option.
-
• Final approach is the last leg of an aircraft’s approach to landing, when the aircraft is in line with the runway and descending for landing.
-
• Landing is the part of a flight when an aircraft returns to the ground up to the point at which taxi-in starts.
-
• Taxi-in is the movement of an aircraft on the ground, under its own power, that occurs from the point that the aircraft turns off the landing runway (after returning to normal taxi speed) to the point at which it parks on the ground and shuts down its engines.
The vertical profile of the flight, also known as the aircraft altitude profile, consists of three main phases: Climb, Cruise and Descent (CCD). Commercial aircraft, regardless of the route they are taking, usually cruise at an altitude between 30,000ft and 41,000ft above sea level. There are several reasons for choosing altitudes in this range, such as better fuel economy and passenger comfort. Within this altitude range, the aircraft encounters less resistance to travel, which makes the engine’s thrust lower with increasing altitude, hence saving even more fuel. It would be logical to imagine that, if aircraft were to fly even higher, the economy of consumption would be greater. The problem is that, from a certain altitude, which varies with each aircraft model, they reach the so-called operating ceiling (around 41,000ft of altitude).
3.0 LITERATURE REVIEW
In this section, we outline the steps of flight trajectory modelling and the use of BADA.
3.1 Flight trajectory modelling
One of the initial studies that modelled the trajectory for fuel consumption optimisation(Reference Neuman and Kreindler1) created an algorithm capable of calculating the minimum fuel consumption during the climb phase from 2,000ft to 10,000ft for long-haul flights (6–12h of flight). The authors derived a system of dynamic equations considering small angles of attack and trajectory, coordinated turns and absence of atmospheric winds, and also assumed that the weight of the aircraft remained constant. Approach altitude is considered above 2,000ft, and climb, approach and landing speeds are set for a commercial jet airliner. The authors concluded that the trajectories combined with latero-directional and longitudinal flight were optimal in terms of fuel consumption when there was little variation in altitude. Finally, the authors concluded that the amount of fuel that can be optimised during the climb and descent phase in the terminal area of the flight is small compared with the fuel spent during the cruise phase. Nevertheless, it is important to account for these costs in flight planning.
Moreover, Ref. (Reference Grimm, Well and Oberle2) sought to quantify the importance of the change in the aircraft weight of the aircraft due to fuel consumption by developing a model that took into account two different approaches: the first assuming the aircraft has constant weight, and the second considering weight decrease as fuel consumed. The authors used the Direct Multiple Shooting Method (DMSM). This method, which is used for optimising boundary constraints only in the state domain, consists basically of dividing the range at which solutions are searched into several smaller ranges. Because it is quite iterative, DMSM becomes heavy for processing systems such as four-dimensional (4D) path optimisation problems.
To design an optimal trajectory for a commercial aircraft, taking into account realistic constraints along the trajectory, Ref. (Reference Betts and Cramer3) applied the direct transcription method. The goal was to achieve results that met civil aviation safety standards. Aircraft aerodynamics and propulsion data were processed using a cubic spline product tensor, which was investigated for two different approaches through data interpolation and least squares taking into account the turning restrictions. This method may be fast because of the approach by cubic splines, but this is only an approximation. For a more accurate approach, the need for continuous derivation can complicate the results.
Also, in the context of of 4D trajectories optimisation, Ref. (Reference Hagelauer and Mora-Camino4) conducted a study in which they presented a method based on Dynamic Programming (DP), in the presence of various time constraints. A discrete formulation of the problem was proposed, and the optimisation problem was solved using a progressive DP framework. Processing time was decreased using neural networks to calculate the costs associated with each decision step in the search process. This method was called soft DP (SDP). Comparing this method with the one described in the previous paragraph, the authors concluded that the use of neural networks to calculate fuel consumption in each decision step reduced by 88.2% the time spent processing.
More recent work, Ref. (Reference Franco, Rivas and Valenzuela5), based on Ref. (Reference Neuman and Kreindler1), consisted of analysing the cruise fuel minimisation problem for a fixed altitude and arrival time as a simple optimisation problem. The objective of this work was to verify the influence of cruising altitude in the calculation of optimal trajectories, calculating the minimum fuel required. Results were presented for a Boeing 767-300ER. The authors concluded that, for higher altitude cruise levels, there is little influence on the Mach number variation with the aircraft weight. In fact, the highest fuel consumption optimisation rates are obtained at higher altitudes.
The flight phases in which an aircraft consumes more fuel are undoubtedly the climb and cruise. Reference (Reference Turgut and Rosen6) studied the relationship between fuel consumption and altitude variation during the descent phase for a commercial transport aircraft. To find approximate solutions, the authors used a Genetic Algorithm (GA) composed of five modules. In the first module, the features of the program are determined. The features relating to the GA program include population, iteration, crossover and mutation ratios and accuracy degree. Other features such as flight ID, range of observation data and minimum and maximum limits for variables are related to flight parameters. The new accuracy degree, according to the variable limits, is also determined in this module. In the second module, the genomes are ranked to the values of the actual count of each genome. At the end of this task, the genomes that have a zero value of actual counts are replaced by genomes which have a maximum actual count. Modules three and four involve codes that perform the tasks of crossover and mutation. In the fifth module, the outputs of the first iteration are recorded in a data set. The output having the best solution in terms of objective function is also recorded on another data set with the values for variables along with the results from the iterations. Within the modules, auxiliary tasks are also conducted, such as routines for checking the proper performance of crossover and mutation and to prevent the loss of the best output from the population after the tasks of crossover and mutation. After analysing the results, the authors concluded that the optimum fuel consumption values occur when, during descent, the aircraft is kept as long as possible at higher altitudes.
The work of Ref. (Reference Murrieta-Mendoza, Ruiz and Botez7) optimises the fuel burn of the vertical profile of a commercial aircraft. The airspace was modelled under the form of a unidirectional graph. The selection of waypoints where to execute the changes in altitudes that provided the most economical flight cost in terms of fuel burn was determined using the Particle Swarm Optimisation (PSO) algorithm.
To compute the flight cost, the flight trajectory is divided into equidistant segments of 20 nautical miles. The authors claim that, by doing so, it is possible to achieve a good compromise between accuracy and computation time. At the beginning of each segment, the model subtracts from the aircraft’s gross weight the fuel burned required to travel the previous segment; the ground speed is computed considering the wind speed, wind direction and temperature; linear interpolations are executed to compute the fuel flow or the fuel burn and the horizontal travelled distance.
Fuel burn was computed in two different ways, depending on the cruise regime: steady altitude or change of altitude. The total fuel burn is calculated by aggregating all the segments, taking into account, if necessary, the change of altitude cost.
The weather forecast was obtained from the model delivered by Environment Canada. The trajectories provided by the algorithm developed in this paper were compared against simple geodesic trajectories to validate their optimisation potential, and against flown trajectories.The authors claim that the results show that up to 6.5% of fuel burn can be saved comparing against simple trajectories, and up to 3.1% was optimised comparing against flown trajectories.
In the work of Ref. (Reference Hartjes, van Hellenberg Hubar and Visser8), a tool is developed that optimises the trajectories of multiple airliners that seek to join in formation to minimise overall fuel consumption or direct operating cost. When in formation, a discount factor is applied to simulate reduction in the induced drag of the trailing aircraft. Using the developed tool, a case study has been conducted pertaining to the assembly of two-aircraft formation flights across the North Atlantic.
The authors mention that the results of the various numerical experiments show that formation flight can lead to significant reductions in fuel consumption compared with flying solo, even when the original trip times are maintained, and that the performance and the characteristics of the flight formation mission – notably the location of rendezvous and splitting points – are affected when one aircraft seeking to join the formation suffers a departure delay.
A fuel flow rate model was developed in Ref. (Reference Oruc and Baklacioglu9) using flight altitude, True Air Speed (TAS) and fuel flow rate values obtained from B737-800 type passenger aircraft Flight Data Records (FDRs). In the model, fuel flow rate is achieved as a function of altitude and TAS. The fuel flow rate model uses a Cuckoo Search Algorithm (CSA) for the climbing phase of the flight. The CSA used in this study uses a combination of local and global search. The authors claim that this approach increases search richness and versatility, while using Lévy flights makes the search area more efficient.
3.2 Flight modelling using BADA
Several other studies have evaluated the benefits of continuous or optimised profile descents and climbs. In general terms, these works are based on flight paths obtained from airspace control agencies. These flight paths and other flight information are then used in conjunction with an aircraft performance model, such as Eurocontrol’s BADA(10) to estimate fuel consumption and the flight altitude profile. BADA is an aircraft performance model which is based on the total energy model of the aircraft and can be considered as a reduced point-mass model.
In the work of Ref. (Reference Melby and Mayer11), the authors analysed trajectory data at 34 US airports in one day, focusing on the continuity of vertical flight profiles at air terminals and the benefits that could be achieved by implementing vertical orientation Performance-Based Navigation (PBN) procedures. For this, they applied a metric that considers the time in level flight during the descent or ascent to the trajectories. The time in level flight metric evaluated the time selected departure operations required to climb through 100ft of altitude. Similarly, the metric evaluated the average time selected arrival operations required to descend through 100ft of altitude. Fuel consumption estimates were made with a BADA-based model. The results show that operators could save $380 million annually and associated reductions in carbon dioxide emission gases of 850,000 metric tons with more efficient descent and climb profiles.
To estimate the benefits of continuous descents in congested airspace, Ref. (Reference Robinson12) developed a model that built trajectories from flight plans at eight air terminals in the United States over a period of 30 to 60 days (depending on the airport). The descent phase flight segments were identified, and two types of continuous descent trajectories were modelled. In the first, level flight segments were moved to higher altitudes and a distance-only constraint was applied to simulate non-congested airspace. In the second, the level flight segments were also moved to higher altitudes, but now with a time constraint, to simulate congested airspace. BADA was used in this work as well, and the results show that potential savings are sensitive to the size and diversity of traffic analysed (e.g. number of days, flights, aircraft mix, etc.).
In Ref. (Reference Knorr, Chen, Rose, Gulding, Enaud and Hegendoerfer13), in addition to continuous descents, cruising speed reductions are exploited to absorb delays. This is encouraged by the fact that much of the extra fuel consumed is related to aircraft sequencing problems at the terminal. The authors methodology was based on four principles: the first consisting of supporting the analysis of a large number of flights, without detailed wind or aircraft weight data; the second consisting of the use of surveillance data for position information; the third consisting of the use of BADA table for aircraft performance information; and the fourth consisting of the potential benefit expressed in terms of time and fuel. The results show that the potential for improvement at the terminals averages 3min per flight or 100kg of fuel. Reductions in cruising speed can save up to 30% of total extra fuel, compared with optimal trajectory.
Using similar techniques, Ref. (Reference Howell and Dean14) assesses the impact of the Federal Aviation Administration (FAA) initiatives on the US flight efficiency during the descent phase. For this purpose, flight path data were collected between the years 2010 and 2015. Potential fuel savings were calculated for each flight, identifying flight level segments in the descent phase, and comparing the total fuel burned on each flight level segment with the total fuel that would have been burned if all these flight level segments were moved to the cruise phase. The calculation for potential time savings followed the same method. BADA was used for aircraft fuel consumption estimates. The results show that there has been a significant improvement in fuel efficiency, especially in places where optimised profile descents have been adopted.
Though previous studies focus on the CCD phases, aircraft surface movements in airports have also been the focus of research. Reference (Reference Khadilkar and Balakrishnan15) built a model that, given the taxi trajectory (for example, from a surface surveillance system), can estimate the resultant fuel burn from observations of the aircraft’s position, velocity and acceleration during taxi. The authors used the Flight Data Recorder (FDR) measurements of key aircraft parameters. FDR archives belonging to an international airline, from over 2,300 flights in the year 2004, were used in this study and introduced into two linear models for estimation of the taxi-out fuel burn. The first model is based on an initial hypothesis consisting of number of stops and number of turns made by the aircraft, with total fuel burn on the ground considered a function of the taxi time. The second incorporates lessons learned from the first model, namely, that other factors might be more important determinants of fuel burn. The authors removed the number of stops and the number of turns from the regression, and instead added the number of acceleration events as an independent variable. The logic behind this decision was that fuel flow rates were seen to increase for aggressive starts from standstill, as opposed to gradual ones. The parameters of both models were calculated using least-squares regression. According to the authors, taxi time is the main driver of fuel consumption, in particular, presented with an accurate estimate of the fuel burn indexFootnote 1, a good estimate of the fuel consumption of a surface trajectory can be obtained using just the taxi time.
In Ref. (Reference Ravizza, Atkin, Maathuis and Burke16), the authors have developed a prediction model that combines both airport layout and historic taxi time information within a multiple linear regression analysis, identifying the most relevant factors affecting the variability of taxi times for both arrivals and departures. The two main applications of this research are for total taxi time prediction and for use in a ground movement decision support system. The authors use multiple linear regression to find a function which could more accurately predict the taxi times than existing methods and concluded that the average speed between the gate and runway (and between the runway and gate) was found to be highly correlated with the taxi distance, with higher speeds being expected for longer distances. Arrivals had higher taxi speeds than departures, because of departure queues at the runway, and the quantity of traffic at the airport was also found to have a significant impact upon the average taxi speed, as identified by several variables in the resulting model. During taxi, the authors also concluded, the turning angle and the operating mode (which runways were in use) were also highly correlated with the average taxi speed. Reference (Reference Ravizza, Chen, Atkin, Stewart and Burke17) uses the same explanatory variables and shows an extensive analysis of different regression approaches for predicting taxi times at airports to demonstrate the performance of each. Six different approaches were analysed in detail: multiple linear regression, least median squares linear regression, support vector regression, M5 model trees, Mamdani fuzzy rule-based systems and Takagi–Sugeno–Kang (TSK) fuzzy rule-based systems.
In Ref. (Reference Chen, Weiszer, Locatelli, Ravizza, Atkin, Stewart and Burke18), the authors present a new Active Routing (AR) framework to model fuel consumption, with the aim of providing a more realistic, cost-effective, and environmentally friendly surface movement. The paper focuses on optimal speed profile generation using a physics-based aircraft movement model. The two modelling approaches were based in BADA and in the International Civil Aviation Organization (ICAO) engine emissions database, respectively. The authors tested the model for Manchester International Airport and concluded that the results reveal an apparent trade-off between fuel burn and taxi times irrespective of fuel consumption modelling approaches.
The aim of Ref. (Reference Gardi, Sabatini and Ramasamy19) is to review the current scientific knowledge regarding the optimisation of transport aircraft flight trajectories with respect to multiple and typically conflicting objectives arising from the inclusion of multiple environmental and operational criteria, and to deduce or infer all the useful notions for the development of algorithms that are specifically conceived for the implementation in novel Communication Navigation and Surveillance/Air Traffic Management (CNS/ATM) and Avionics (CNS+A) systems. The Multi-Objective Trajectory (MOTO) model proposed in this work consists of an optimisation process split between control inputs and state variables. From these two, the authors establish a network of relations between the aircraft’s engine thrust, fuel consumption, dynamics models and the atmosphere. These relations return the inputs for the emissions, noise and contrail models, which will return the values for the output and state variables. The authors conclude that MOTO algorithms have a clear potential to enable real-time planning and re-planning of more environmentally efficient and economically viable flight routes by simultaneously addressing the dynamic nature of both weather and air traffic conditions.
There are several approaches regarding fuel burn estimations. To compare them, the work of Ref. (Reference Enea, Fricke, Paglione and Bronsvoort20) summarises the collaboration between researchers from several globally recognised institutions to address the question of fidelity of fuel estimation. Interviews were conducted initially to categorise common elements that typical Air Traffic Management (ATM) studies share. An international team of fuel modellers was assembled to run their models on a common set of inputs. The outputs generated by these models were categorised using metrics on empirical trajectories and other operational data, including predicted fuel burn. The set of flights analysed for this study was recorded in June 2015 from various airports in the United States. The sample included flights with variable length, different origin–destination pairs, various aircraft types and for different days of the month of June 2015. Flights from 19 different days, 65 origin–destination pairs and 16 different aircraft types were selected. To present a meaningful cross-comparison of the fuel burn models evaluated, only the subset of common flights was used for this analysis. This subset represented the maximum number of flights with valid fuel and TOW predictions from all the models. There was wide variability in the observed fuel burn error across all models. The smallest median error was obtained with the DaliFootnote 2 BADA 3 run with  $-3.9$%, while the largest median error was observed for the Aircraft Fuel Evaluation Simulation Tool (AFEST)Footnote 3 run without known TOW, with
 $-13.1$%, the latter representing a deterioration from the AFEST run with known TOW that presented a median error of
 $-9.5$%, hence showing the impact of the initial TOW error. The authors concluded that even the highest fidelity model will significantly underperform if low-quality input data is provided. Thus, one of the results of this work is that fuel burn estimation models with different levels of complexity perform with different levels of accuracy.
To model the descent and approach to the destination airport, Ref. (Reference Glaser-Opitz, Labun, Budajová and Glaser-Opitz21) propose a landing system where this phase can be done more efficiently and safely using performance data based on terrain reference navigation from their own created terrain elevation database, based on radar altimeter measurements compared with the overflown terrain. The simulations were performed for a flight arriving at Kosice (KSC) airport, a Boeing 737-800 aircraft, and the descent trajectory was modelled with a BADA performance model as a continuous descent approach from a proposed merging point to the KSC runway. The descent procedure for this airport was designed in cooperation with professional pilots, and all simulations were created for KSC as a continuous descent approach; procedures, based on real world airline data in compliance with initial 4D (i4D) trajectory and proposed merging point. Based on mentioned models and simulations, the landing system prototype was developed, with BADA model-based trajectory prediction capability. The authors developed a client–server interface for testing and further research activities, which enabled the landing system prototype to communicate with the flight simulator and datalink communication simulator. Although the authors described the methods used to derive the landing system thoroughly, they did not make any explicit conclusions regarding its efficiency or safety.
In summary, the previous paragraphs describe several models that aim to model specific phases of a flight, such as ground movements or CCD phases. The methods range from solving differential equations to linear regression, but none of them conduct a complete analysis for a flight, from the departure to arriving gate.
4.0 THE BLOCK TIME FUEL MODEL
In this section, we will demonstrate how to model the BTF consumed, using Newtonian mechanics and the public available data sets EMEP/EEA and BADA. We formally define the problem to comprise the following three problems:
• In Section 4.1, we will demonstrate how to calculate the physical distance and bearing between an origin and destination. With these two results, we can define the cruising altitude.
-
• Given the aircraft model, in Section 4.2 we will demonstrate how to use the EMEP/EEA data set to determine the duration, fuel flow and fuel consumed for taxi-out, take-off, approach, landing and taxi-in phases.
-
• Finally, in Section 4.3 we will describe how to use BADA’s aircraft performance data table to determine for each time instant of a flight the fuel flow and fuel consumed for CCD phases.
4.1 Calculating ground distance and defining cruise altitude
Given the:
- $\phi_o$ latitude for the origin airport
- $\lambda_o$ longitude for the origin airport
- $\phi_d$ latitude for the destination airport
- $\lambda_d $ longitude for the destination airport
(1)
\begin{equation} \Delta\phi = \phi_d - \phi_o\end{equation}
(2)
\begin{equation} \Delta\lambda = \lambda_d - \lambda_o\end{equation}
(3)and assuming that Earth is perfect sphere with a radius R of 6,378.137km, we can determine the physical distance d between the origin and destination airports using the haversine formula in Equation (4):
\begin{equation} a = \sin^2 \left(\frac{\Delta\phi}{2}\right) + \cos(\phi_o)\times \cos(\phi_d) \times \sin^2\left(\frac{\Delta \lambda}{2}\right)\end{equation}
(4)
\begin{equation} d = 2 \times R \times a\tan \left( \frac{\sqrt{a}}{\sqrt{1 - a}} \right)\end{equation}


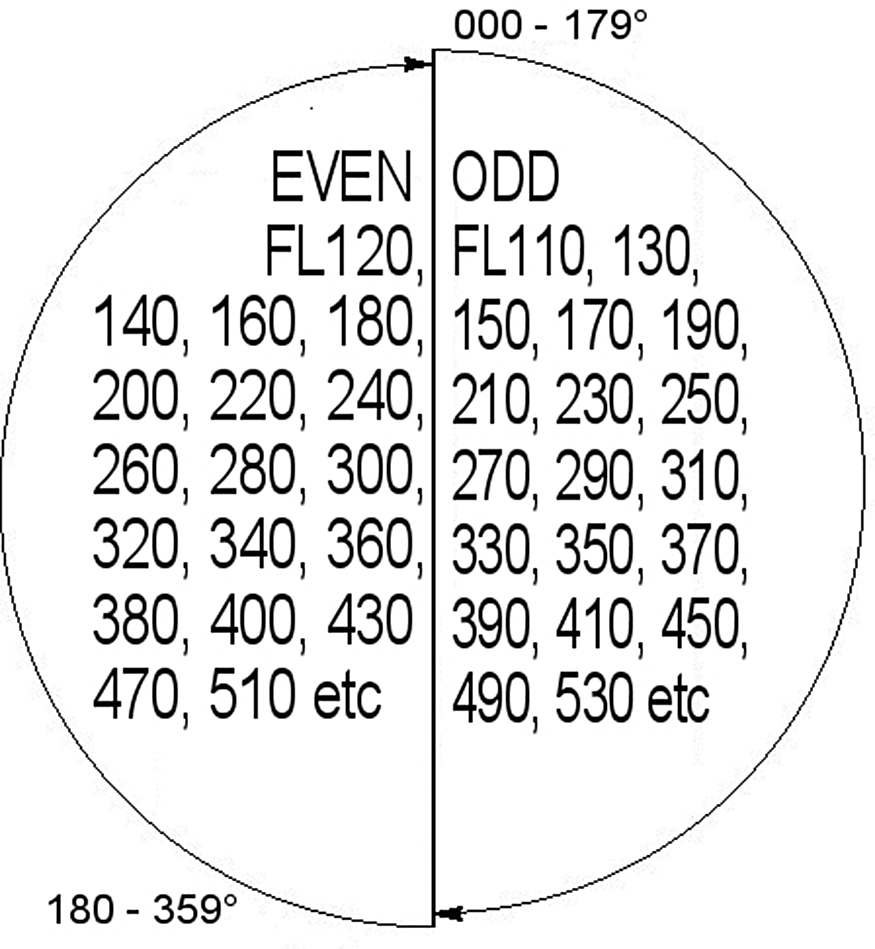
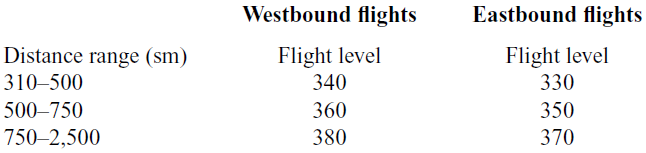
To avoid collisions between aircraft travelling in opposite directions, it is necessary to impose a vertical separation. The ICAOFootnote 4 semi-circular rule defines the available flight levels in the conventional airspace and also in the Reduced Vertical Separation Minima (RVSM) airspace when applicable between FL290 and FL410. The default worldwide semi-circular rule can be observed in Fig. 1 and is applied according the aircraft’s magnetic bearing: if this value is between  $0^{\circ}$ and
 $179^{\circ}$ (eastbound flights), the flight level or altitude must be odd, i.e. FL310, FL330, FL350, etc., whereas if the aircraft has a magnetic bearing between
 $180^{\circ}$ and
 $359^{\circ}$ (westbound flights), the flight level must be even, i.e. FL320, FL340, FL360, etc.
ICAO cruising levels (RVSM). Source: ICAO.

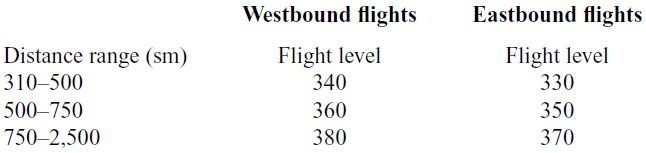
Based on the work of Ref. (Reference Pagoni and Psaraki-Kalouptsidi22), we define for our model in Table 1 the flight levels as a function of the distance intervals. Reference(Reference Pagoni and Psaraki-Kalouptsidi22) noticed that short-haul flights present significant deviations in cruise altitude even for shorter distances and in their study adopt a distance increment of 250 statute milesFootnote 5 (sm) to present the data. On the other hand, longer flights tend to have a more homogeneous flight performance, and the distance increment is increased to 500sm. We will use an extended flight distance profile, although the one used by the authors, from 500sm to 2,500sm, was used to cover a wide spectrum of US domestic flight distances. Indeed, those flights comprise 87.4% of total passenger miles in 2012.
Flight level for westbound and eastbound flights during cruise phase
4.2 Modelling taxi-out, take-off, approach, landing and taxi-in phases
For taxi-out, take-off, approach, landing and taxi-in phases, this paper uses the data set provided by the EMEPFootnote 6/EEAFootnote 7 air pollutant emission inventory guidebook 2016 1.A.3.a Aviation – Annex 5 – LTO emissions calculator 2016. The fuel burnt and emission data provided in this set are for supporting the European Union (EU) and the member states of the EEA in the maintenance and provision of European and national emission inventories. Fuel burn and emission data in this spreadsheet are modelled estimates and not absolute values. Where only one type of engine is associated with a particular aircraft type, it is the most common type of engine (as seen in Europe), or the best equivalent type of engine, for that aircraft type. Where several types of engine are associated with a particular aircraft type, the most common type of engine is highlighted.
The first part of our modelling will use the EMEP/EEA data set and consists of determining the duration and fuel flow for the taxi-out and take-off phases, on the basis of the type of the aircraft, origin airport and year. Since the ROADEF 2009 does not provide any information regarding the aircraft engine, we chose to use the most common aircraft engine. The mass of fuel burnt  $M_{out}$ during the taxi-out phase is calculated using Equation (5):
 \begin{equation} M_{out} = T_{out} \times E_7 \times N_e\end{equation}
where  $T_{out}$ is the taxi-out time (s),
 $E_7$ is the rate of fuel burn (kg/s/engine) during taxi-out and
 $N_e$ is the number of engines of the particular aircraft performing the flight. EMEP/EEA assumes that during the taxi-out phase the engine thrust is set to 7% following the ICAO convention. Similarly, the mass of fuel burnt
 $M_{off}$ during take-off is calculated using Equation (6):
 \begin{equation} M_{off} = T_{off} \times E_{100} \times N_e\end{equation}
where  $T_{off}$ is the take-off time (s) and
 $E_{100}$ is the rate of fuel burn (kg/s/engine) during take-off. In this phase, EMEP/EEA assumes that during the take-off phase the engine thrust is set to 100% following the ICAO convention.
The mass of fuel burnt  $M_{al}$ during the approach and landing phase is calculated using Equation (7):
 \begin{equation} M_{al} = T_{al} \times E_{30} \times N_e\end{equation}
where  $T_{al}$ is the approach and landing time (s), and
 $E_{30}$ is the rate of fuel burn (kg/s/engine) during approach and landing. In this phase, EMEP/EEA assumes that during the take-off phase the engine thrust is set to 30% following the ICAO convention.
The mass of fuel burnt  $M_{in}$ during the taxi-in phase is calculated using Equation (8):
 \begin{equation} M_{in} = T_{in} \times E_7 \times N_e\end{equation}
where  $T_{in}$ is the taxi-in time (s),
 $E_7$ is the rate of fuel burn (kg/s/engine) during taxi-in and
 $N_e$ is the number of engines of the particular aircraft performing the flight. EMEP/EEA assumes that during the taxi-in phase the engine thrust is set to 7% following the ICAO convention.
4.3 Modelling climb descent and cruise phases
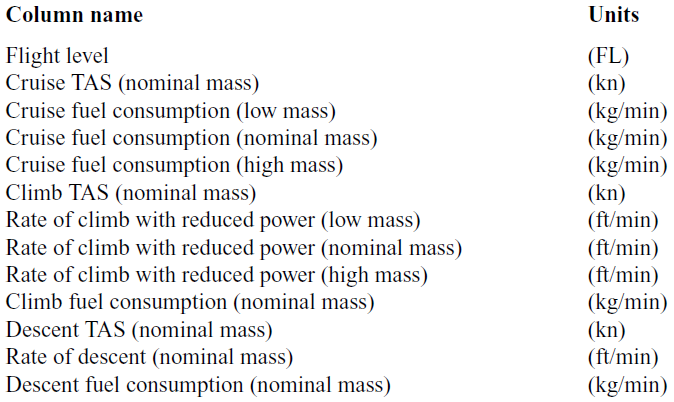
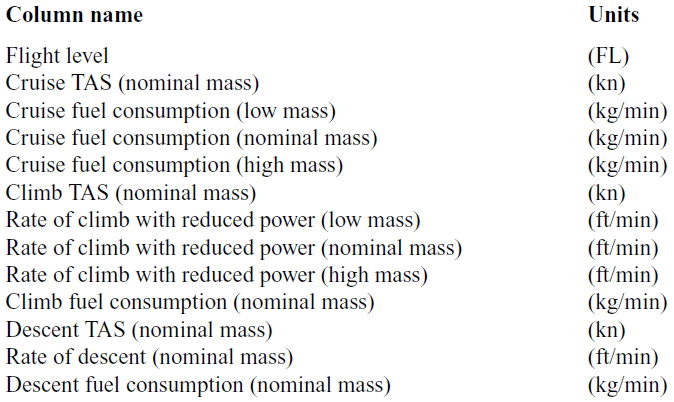
To model the CCD phases, we will use BADA Performance Table Files (PTF) for each specific aircraft. In Table 2, we present the performance data structure within the file.
BADA performance data structure
To model the the CCD phases, we will use Newton’s equations of motion:
 \begin{equation} v = a \times t + v_0\end{equation}
 \begin{equation} r = r_0 + v_0 \times t + \frac{1}{2} \times a \times t^2\end{equation}
 \begin{equation} r = r_0 + \frac{1}{2} \times (v + v_0) \times t\end{equation}
 \begin{equation} v^2 = v_0^2 + 2 \times a \times (r - r_0)\end{equation}
 \begin{equation} r = r_0 + v \times t - \frac{1}{2}\times a \times t ^2\end{equation}
where  $r_0$ is the initial position, r the final position,
 $v_0$ the initial velocity, v is the final velocity, a the acceleration and t is the time interval.
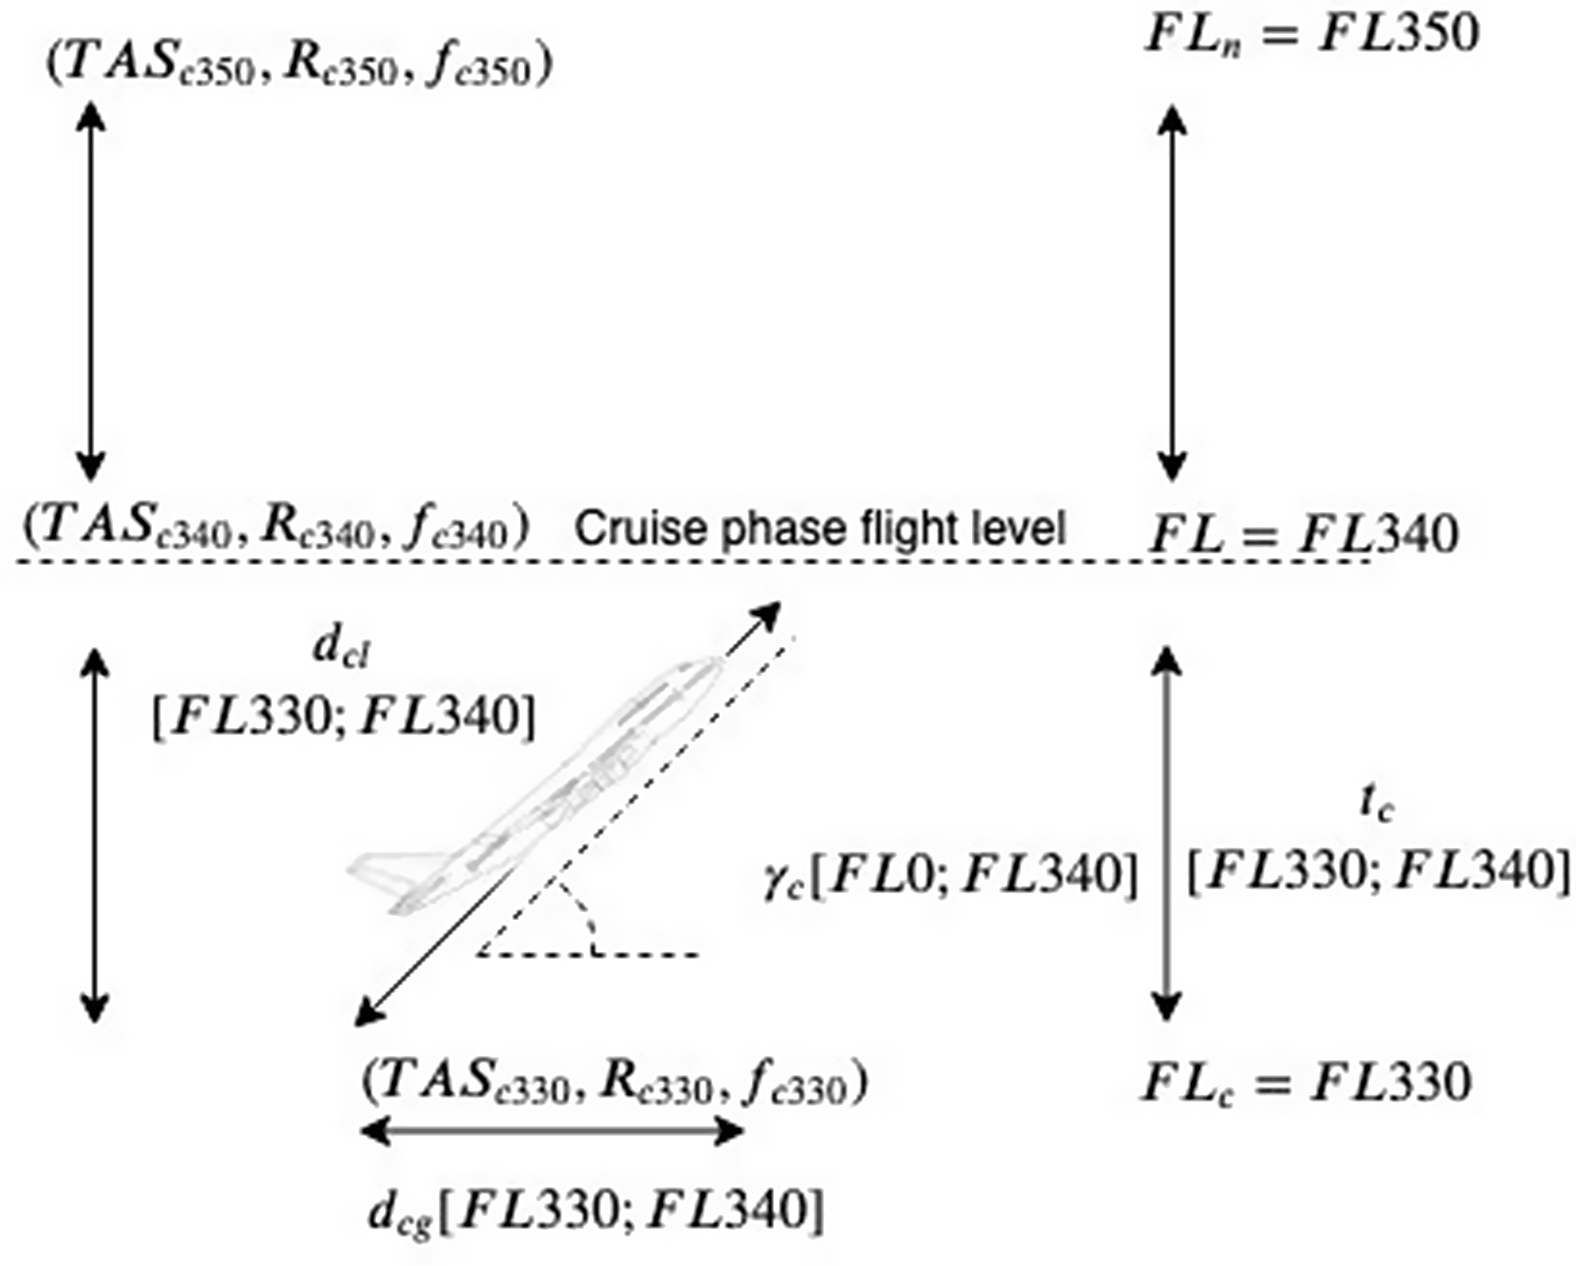
For the climb phase, to obtain the Rate Of Climb and Descent (ROCD) and fuel flow, we will be using the values for nominal mass level to avoid the problem of missing climb data for several aircraft models at high mass levels. During the climb phase, the model will interpolate between pairs of flight levels (current  $FL_c$ and next
 $FL_n$ respectively), the pairs of values for true airspeed
 $(TAS_c, TAS_n)$, fuel flow
 $(f_{cc}, f_{cn})$ and ROCD
 $(R_c, R_n)$.
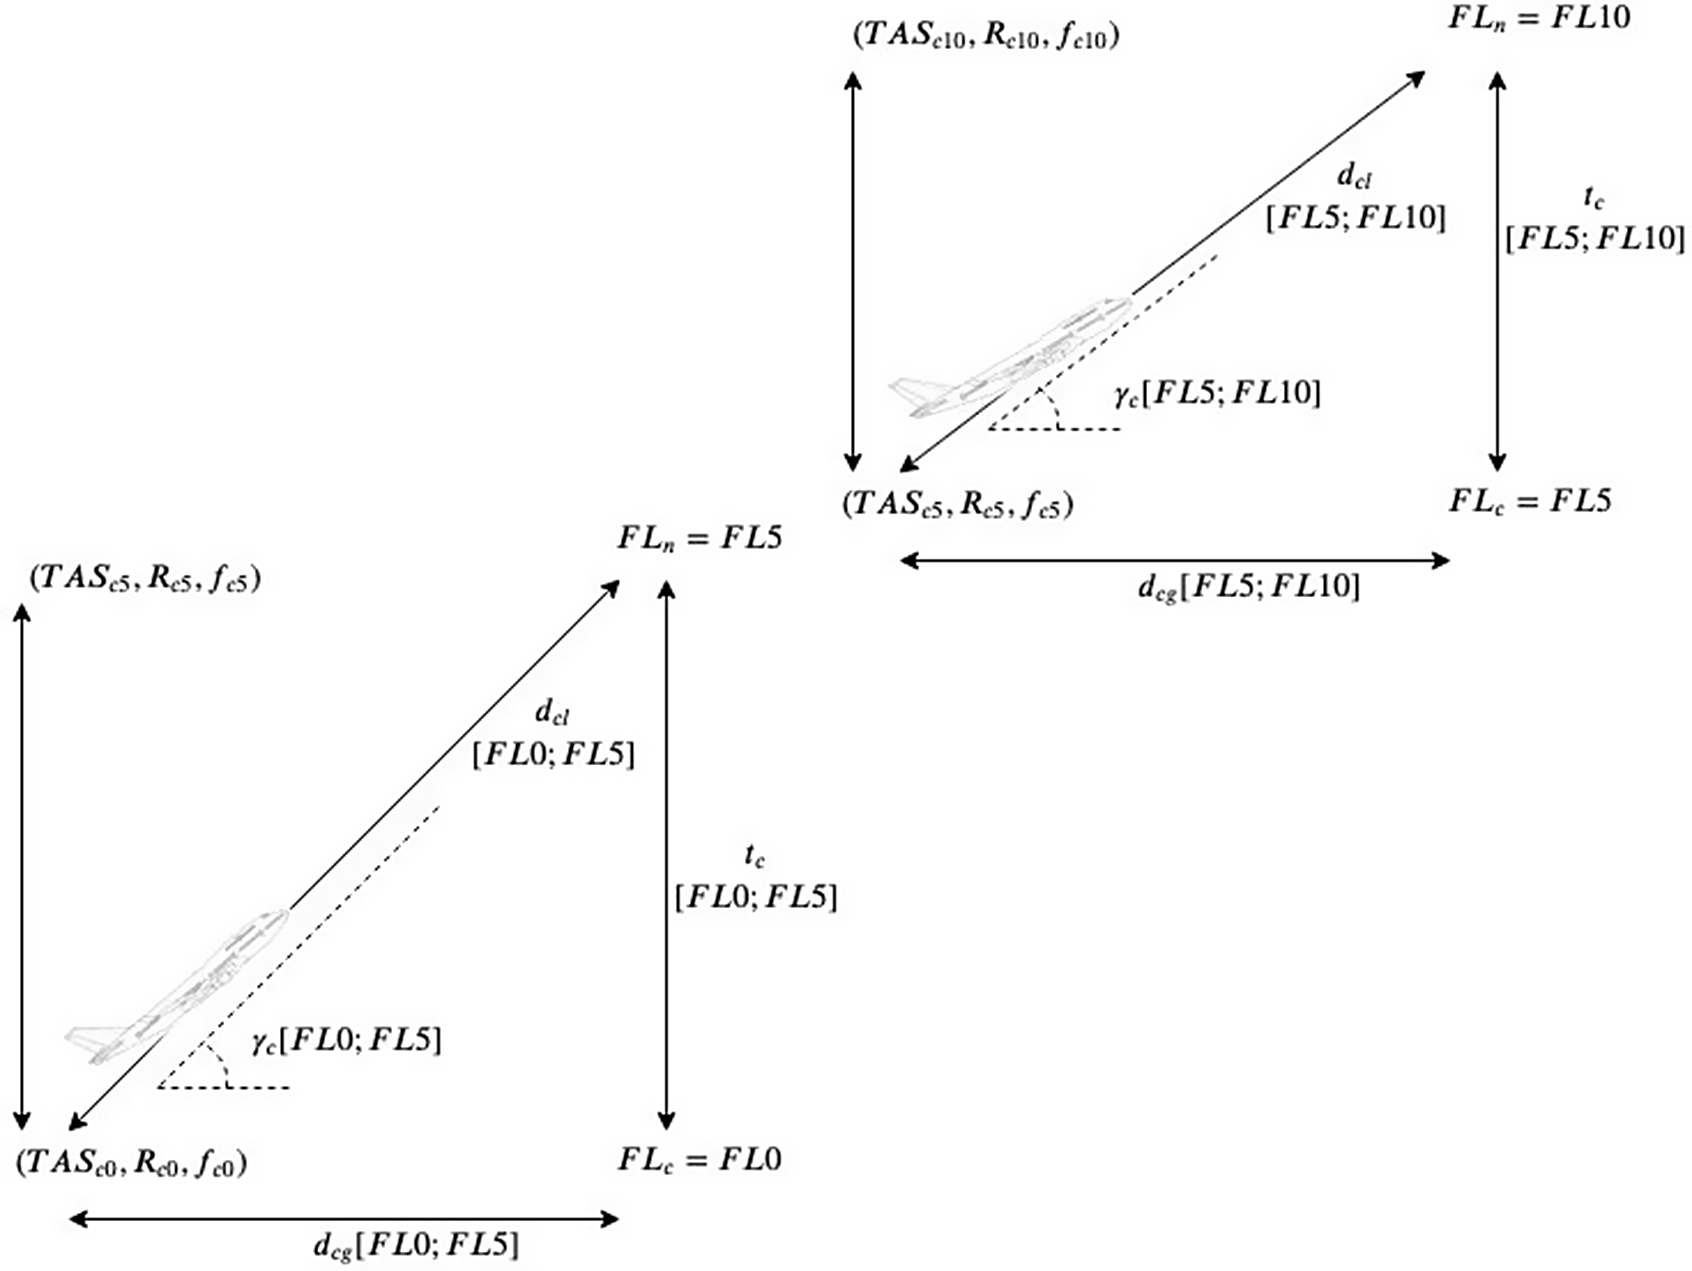
Figure 2 depicts the interpolation process during the climb phase between FL0 to FL5 and FL5 to FL10.
Climb between flight levels FL0 to FL5 and FL5 to FL10.
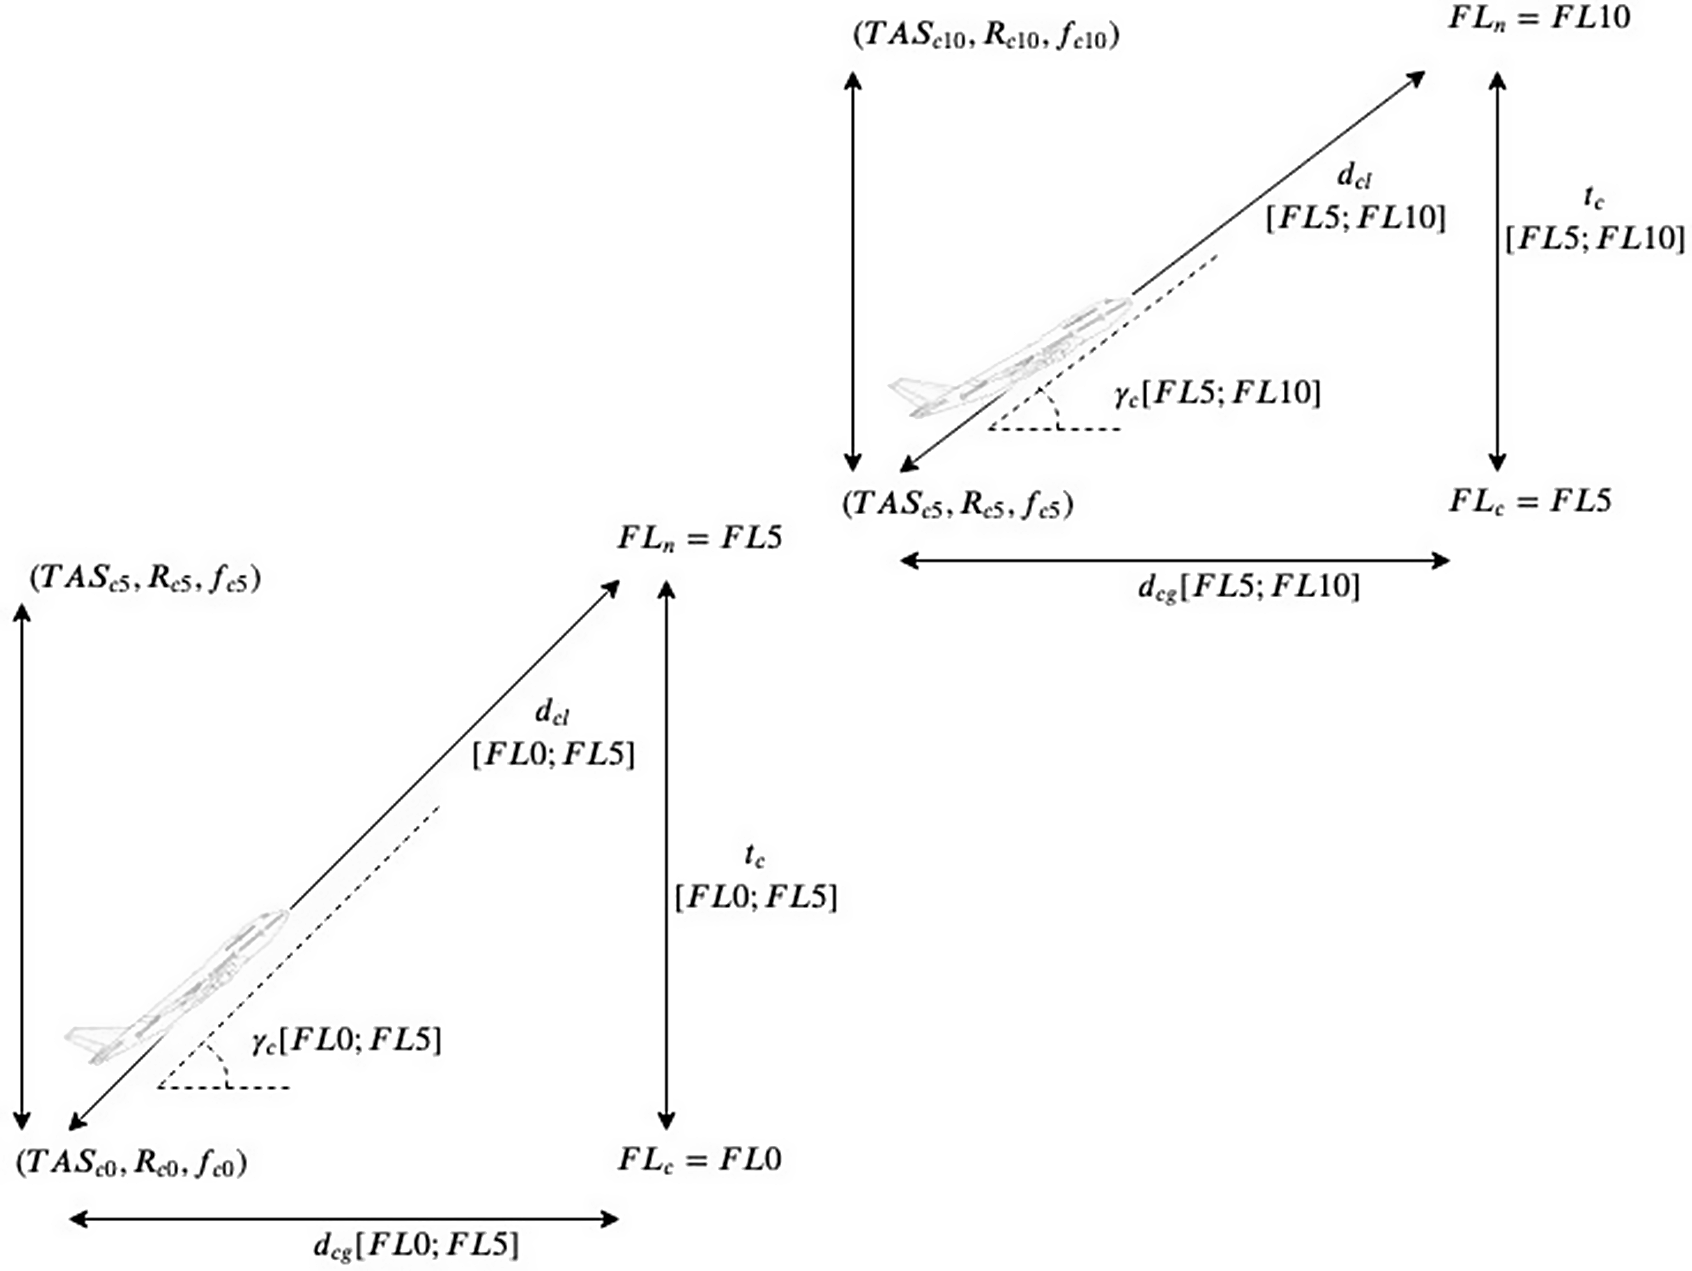
Since the ROCD consists of the variation of altitude with time, we consider it to be the aircraft’s vertical speed component. Since the ROCD changes with altitude, we proceed to obtain its rate of change with time. The latter consists of the vertical component of the aircraft’s acceleration  $a_{cv}$, and it is calculated by interpolating between the current
 $(FL_c)$ and next
 $(FL_n)$ flight level, the ROCD
 $R_c$ and
 $R_n$, respectively. On the basis of Equation (12), the interpolation equation is expressed as follows:
 \begin{equation} a_{cv} = \frac{1}{2} \times \frac{R_n^2 -R_c^2}{FL_n - FL_c}\end{equation}
After determining the aircraft’s vertical acceleration, we can now determine, on the basis of Equation (9), the time  $t_c$ the aircraft took to travel from
 $FL_c$ to
 $FL_n$:
 \begin{equation} t_{c} = \frac{R_n - R_c }{a_{cv}}\end{equation}
The longitudinal component of the aircraft’s acceleration  $a_{cl}$ is determined on the basis of Equation (9), measuring the variation of TAS between the current and the next flight level,
 $TAS_c$ and
 $TAS_n$, respectively:
 \begin{equation} a_{cl} = \frac{TAS_n - TAS_c }{t_{c}}\end{equation}
The longitudinal distance  $d_{cl}$ that the aircraft flew during the ascent between the current and next flight level can be calculated on the basis of Equation (11) and can thus be obtained by:
 \begin{equation} d_{cl} = TAS_c \times t_c + \frac{1}{2} \times a_{cl} \times t_c^2\end{equation}
The aircraft’s trajectory angle  $\gamma_c$ is obtained by:
 \begin{equation} \gamma_{c} = \arcsin\left( \frac{FL_n - FL_c}{d_{cl}} \right)\end{equation}
The ground distance  $d_{cg}$ is obtained projecting the longitudinal distance
 $d_{cl}$ on the horizontal plane:
 \begin{equation} d_{cg} = d_{cl} \times \cos(\gamma_c)\end{equation}
Finally, for the climb phase, we derive the amount of fuel consumed using a similar approach. We first calculate the variation of the fuel flow  $F_{cf}$ during the time interval
 $t_c$, according to:
 \begin{equation} F_{cf} = \frac{f_{cn} - f{cc}}{t_c}\end{equation}
where  $f_{cn}$ and
 $f_{cc}$ are the fuel flow for the next and current flight levels. The total amount of fuel consumed
 $C_c$ during the time interval
 $t_c$ is obtained using:
 \begin{equation} C_{c} = f_{cc} \times t_c + \frac{1}{2} \times F_{cf} \times t_c^2\end{equation}
During the climb phase, the interpolation procedure will terminate when the aircraft reaches the cruise Flight Level (FL). For some aircraft models, there are no data points for the specific cruise FL; for instance, for an A320 that will cruise at FL340, the PTF only has data points ( $TAS_c$,
 $R_c$ and
 $f_c$) for FL330 and FL350. In Fig. 3, we depict the interpolation between FL330 and FL340:
Climb between flight levels FL330 to FL340.

In the next part of our model, we will calculate for the descent phase the values of the vertical acceleration  $a_{dv}$, time of descent
 $t_d$, longitudinal acceleration
 $a_{dl}$, longitudinal distance
 $d_{dl}$, aircraft’s trajectory angle
 $\gamma_d$, ground distance
 $d_{dg}$, fuel flow variation
 $F_{df}$ and total amount of consumed fuel
 $C_d$. The descent phase is symmetrical to the climb phase; thus, in the descent phase, we will interpolate between flight levels, starting at cruise altitude until 3,000ft (FL30), since from there on we will be using EMEP/EEA to model approach, landing and taxi-in. The reason for this procedure derives from the fact that the EMEP/EEA data set aggregates in a single-phase approach and landing.
Finally, for the cruise phase, we start by calculating the ground distance  $d_{g}$ that needs to be covered using:
 \begin{equation} d_g = d - (d_{cg} - d_{dg})\end{equation}
To calculate the time  $t_{cr}$ that it takes to fly the ground distance, we assume that its value is the same as the one the aircraft will travel. The value for the TAS can be obtained directly from the PTF if the cruise flight level is present. Otherwise, we will interpolate between the two pairs, lower and upper FL and lower and upper TAS. Thus, the cruise time
 $t_{cr}$ is obtained by:
 \begin{equation} t_{cr} = \frac{d_g}{TAS}\end{equation}
Similarly, the value for the fuel flow ( $ \Phi $) during the cruise phase can be obtained directly from the PTF if the cruise flight level is present. Otherwise, we will interpolate between the two pairs, lower and upper FL and lower and upper
 $ \Phi $. Thus, the consumed fuel F during the cruise phase is obtained by:
 \begin{equation} F = \Phi \times t\end{equation}
With the final Equation (24), we achieve a complete integration of all phases of a flight. In the next section, we will calculate for each of them the start and end time, consumed fuel, start and end altitude and ground distance.
5.0 COMPUTATIONAL RESULTS
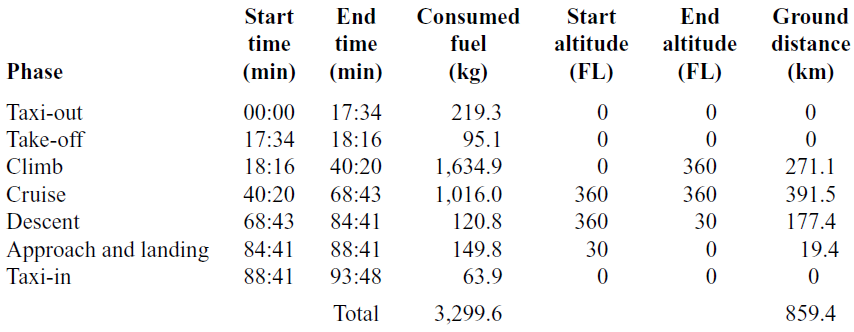
In our numerical experiments, the BTF model computed for a discrete set of time instants the values for fuel flow, altitude and ground distance. In Table 3, we can observe the flight block, grouped into seven phases, for the flight between Charles de Gaulle airport (CDG) in Paris and Josep Tarradellas airport in Barcelona, operated by a Airbus A320 aircraft.
Flight block

For clarity, in the next subsections we will describe the previous flight in detail, namely in Section 5.1 the variation through time of fuel flow. Since we were able to retrieve data from Flightaware Flight(Reference Grimm, Well and Oberle2), we will compare these data with the results obtained by the BTF model. Specifically, in Section 5.2, we will compare the results for the altitude profile, and in Section 5.3 ground distance versus the time. In Section 5.4, we perform an exploratory data analysis of our results using a rotation from the ROADEF 2009 Challenge data set. Finally, in Section 5.5, we compare the results for the BTF model with those presented in the literature review.
5.1 Fuel flow versus time
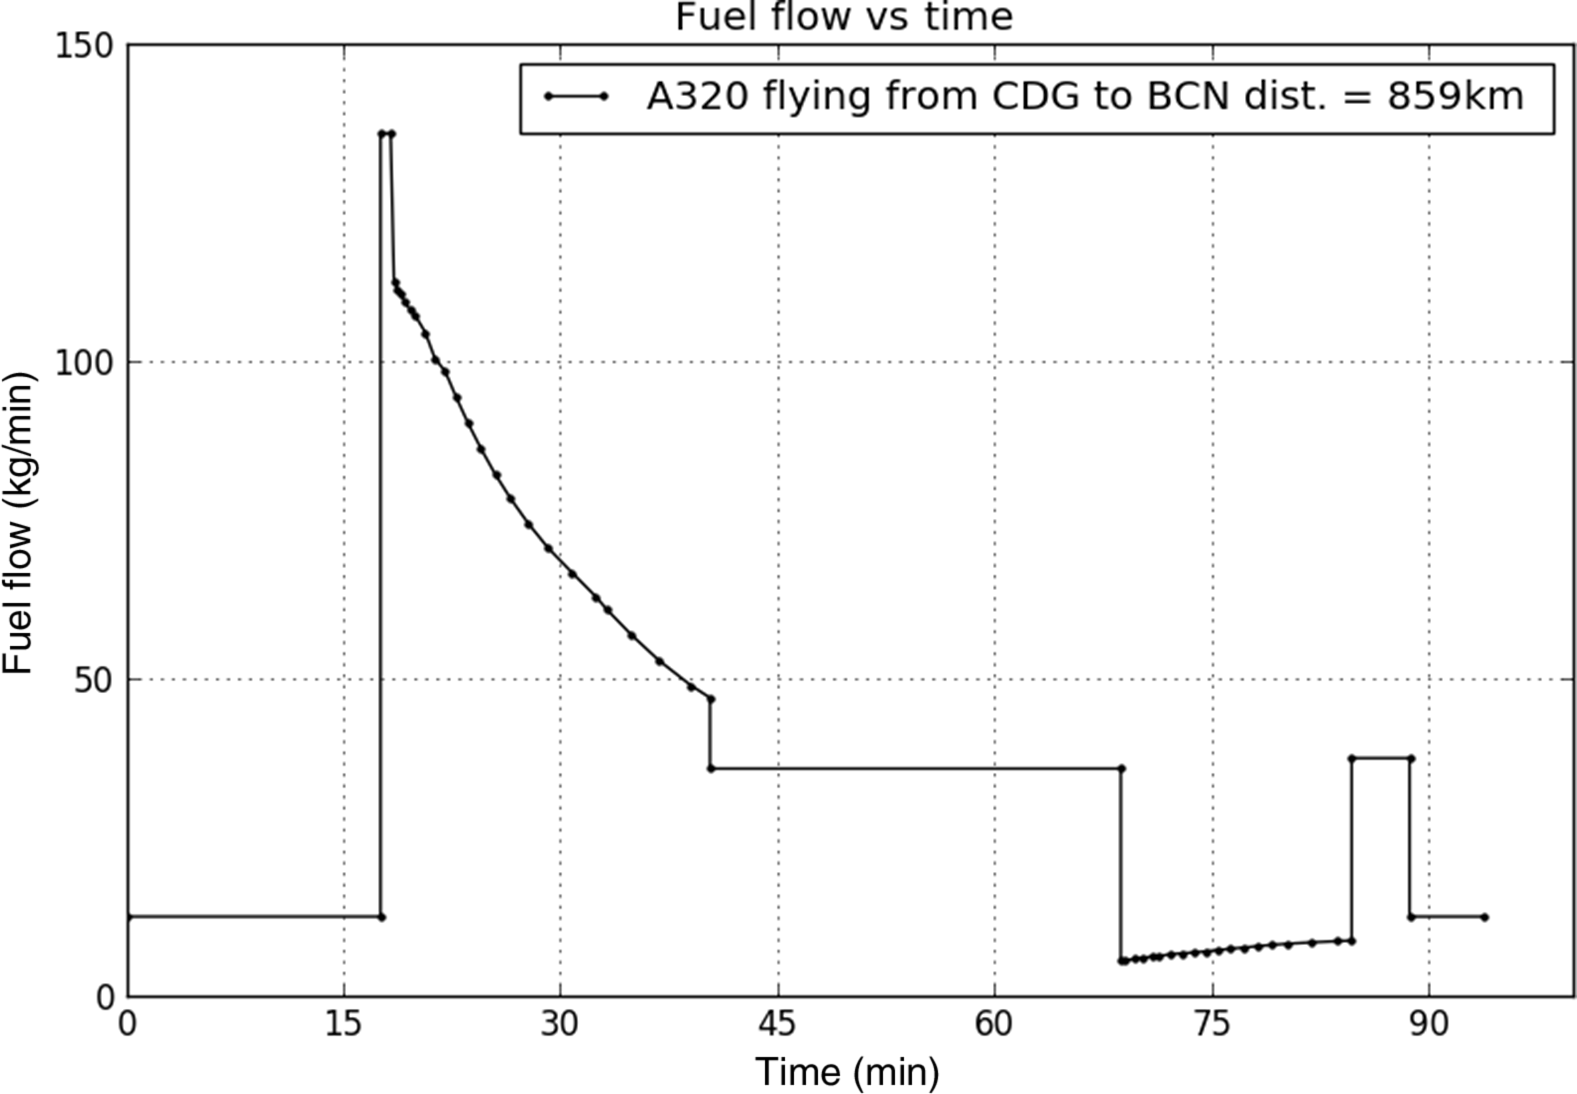
In Fig. 4, we can observe in detail the pattern of each of the seven phases. From the initial instant to 17:34, we can observe a flat fuel flow for the taxi-out phase, after which we can observe a sharp increase during 42s corresponding to the take-off phase. After the aircraft takes off, we can observe that the fuel flow starts to decrease during 22min 6s, until the aircraft reaches cruising altitude. When the aircraft reaches cruise altitude, the fuel flow first decreases instantly and then becomes a flat line for 28min 23s until the aircraft starts the descent phase. When the aircraft starts the descent phase, the fuel flow again decreases abruptly and increases very slowly for the next 15min 58s until the aircraft starts the approach and landing phase. During the approach and landing phase, the fuel flow increases instantaneously and maintains a flat rate for 4min. Finally, after landing, the aircraft initiates the taxi-in phase. This phase has a duration of 5min 7s, and the fuel flow is constant. The fuel flow presented in the our model not only is consistent to the one presented by Ref.(Reference Betts and Cramer3), but it also extends the work of these authors by including taxi-out, take-off and taxi-in phases.
A320 aircraft fuel flow versus time during the flight CDG-BCN.

5.2 Altitude versus time
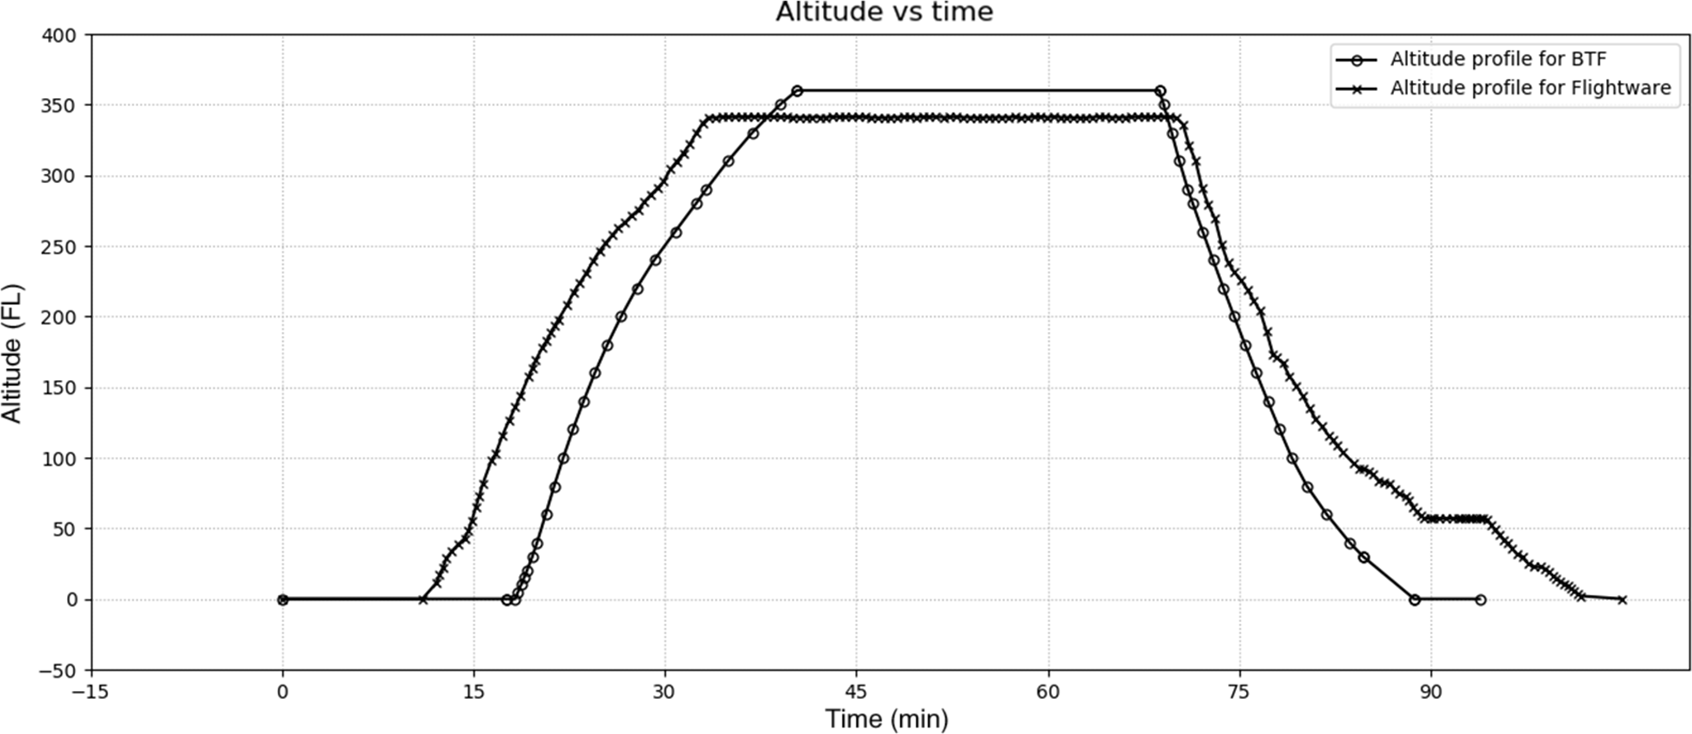
In Fig. 5, we compare the results for the altitude profile for the BTF model and the values retrieved from Flightaware flight track log(23). The end time value retrieved from Flightaware flight(25) for the taxi-out phase is 11min; however, there is no data regarding the duration of the take-off. We can verify that the BTF model takes 6min 34s longer for the taxi-out phase.
A320 altitude profile during the flight CDG-BCN.

As for the climb phase, Flightaware ends 6min 55s earlier, and in terms of duration, takes 22min 30s whereas the BTF takes 22min 6s. As for the flight level, we configured the BTF model to end the climb phase (and thus start the cruise phase) at FL360, whereas Flightaware ends the climb phase at FL341.
With respect to the cruise phase, we have already mentioned that the Flightaware flight level is lower than that of the BTF model. Moreover, the duration for Flightaware is 36min 36s, whereas the BTF model takes 28min 23s. In conclusion, the cruise phase finishes 1min 21s earlier than Flightaware.
As for the descent phase, our model starts earlier, and it is important to note that, since it is an exact representation of BADA’s PTF file, it will not fit perfectly the usual descent profile depicted by Flightaware data. In the descent phase, aircraft are piloted to glide as much as possible to save fuel; hence, the descent phase for Flightaware clearly shows changes in the slope. We can also observe from Flightaware data that, in the time interval from 89 to 94min, the altitude remains constant at flight level 57. This can be explained as a holding period for which the aircraft had to wait until it was given authorisation by the air traffic controllers to complete the descent phase and land safely.
For time comparison purposes, we aggregate the descent and approach and landing phases. We verify that the duration for the BTF model is 12min 18s less than Flightaware. As a consequence, the Flightaware flight lands 13min 5s later than the BTF model.
Finally, for the taxi-in phase, we can observe that the BTF model takes 5min 7s, whereas Flightaware takes 3min 12s.
In summary, the block time difference between the Flightaware flight and the BTF model is 11min 11s.
5.3 Ground distance versus time
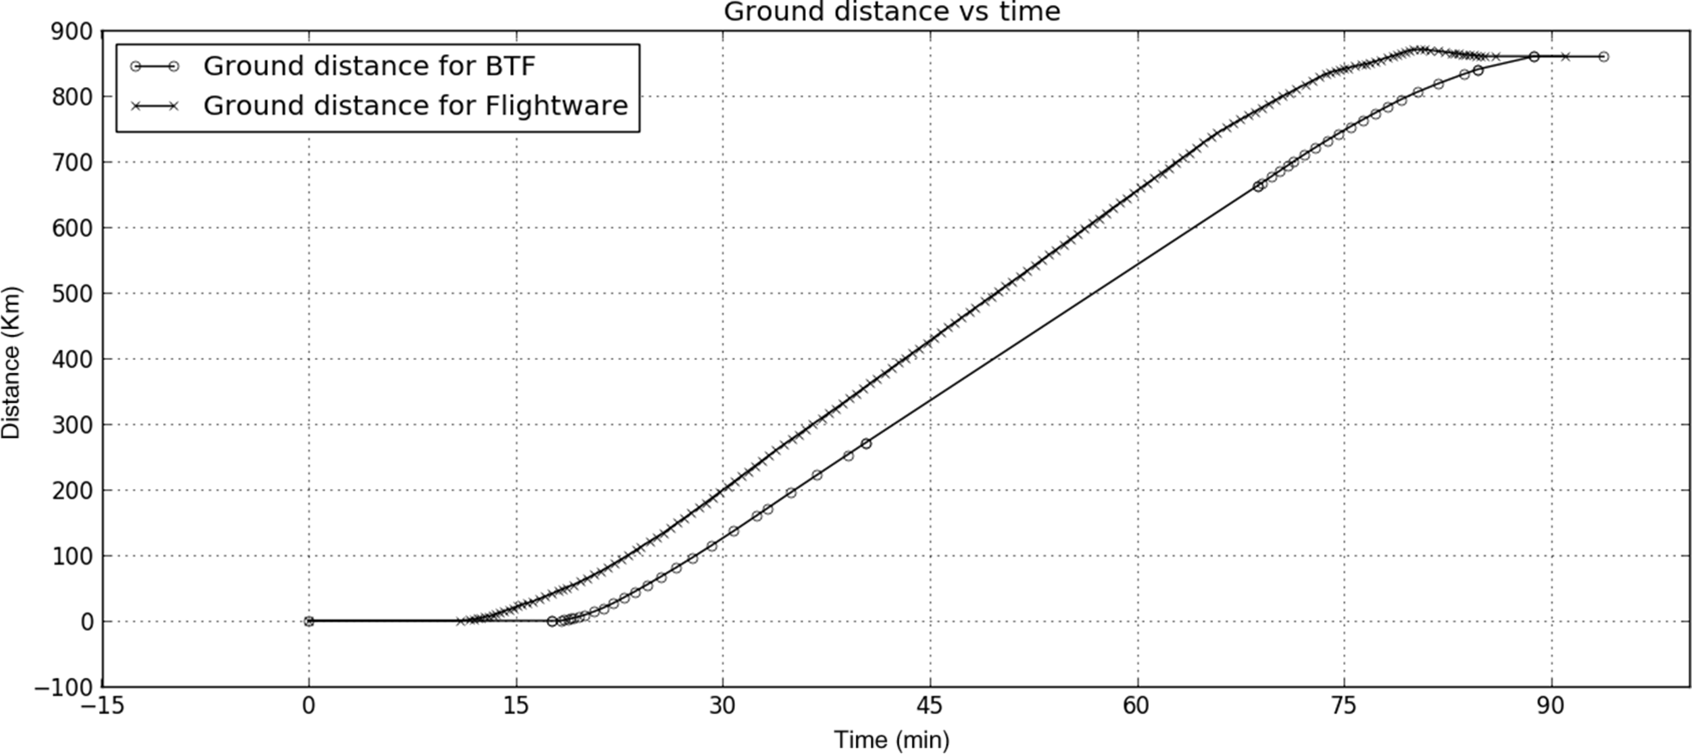
In terms of ground distance covered, we can see in Fig. 6 that it varies linearly with time soon after the aircraft take-off until the end of the descent phase at FL30. However, we can observe that, after taking off, the aircraft in the BTF model flies faster than Flightaware’s and overruns it at a distance of 400km, at 47min.
A320 ground distance versus time during the flight CDG-BCN.

5.4 Benchmarking the model results against ROADEF 2009 Challenge
Every 2 years, the French Society of Operational Research and Decision Making releases the ROADEF Challenge, which consists of a competition to solve a complex optimisation problem that occurs in industry. In the ROADEF 2009 Challenge, there is a step-wise simplification of a model for disruption management in commercial aviation that aims at finding recovery planning of flights, aircraft assignments and passengers (including flight leg cancellation) on a given maximal horizon, so that a sum of penalties corresponding to various costs or discomforts is minimised.
The ROADEF Challenge 2009 provides a data set with the duration of flights between an origin and a destination airport. However, these values do not account for the aircraft model.
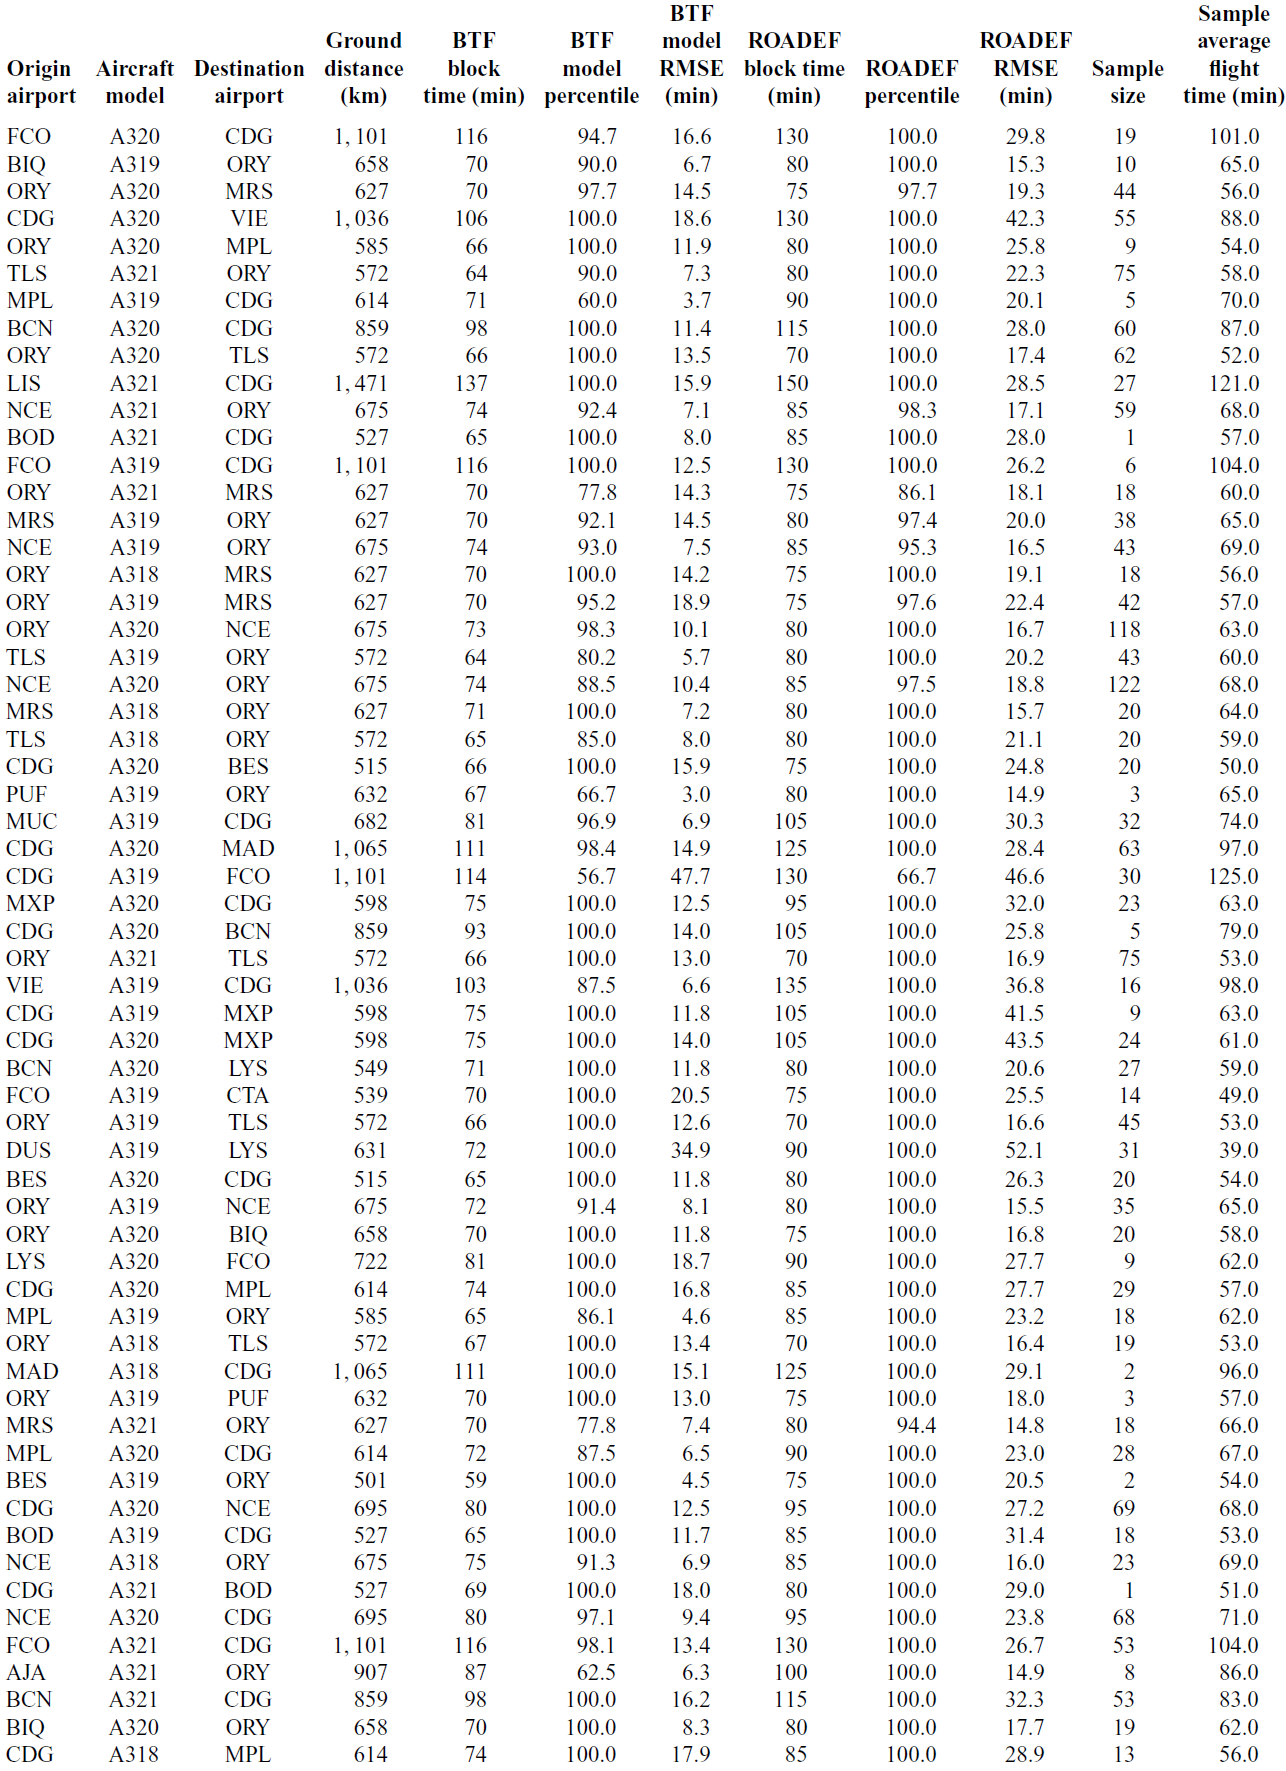
In this section, we will compare the BTF model results for block time with those supplied by the ROADEF 2009 Challenge (see Table A.1 for complete set). We sampled a total of 60 distinct flight tuples consisting of origin airport, aircraft model and destination airport and retrieved the real flight block time distribution from Ref. (26) between 7 and 23 July 2019.
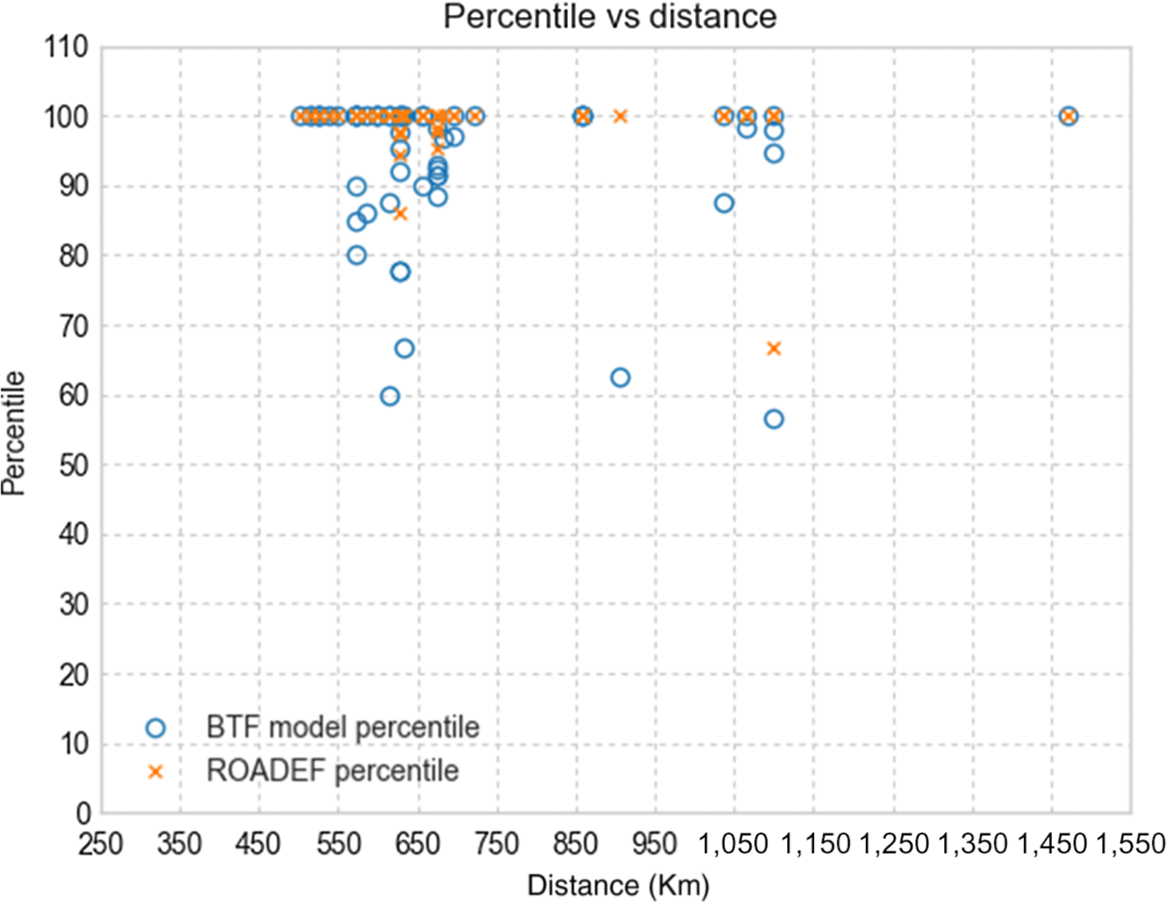
The comparison methods that are used consist of percentile versus distance and root mean square error versus distance. Figure 7 illustrates the block time percentile of the BTF model and ROADEF versus the ground distance. This graph gives the percentage of block times retrieved from Ref. (26) that are below the block time values of the BTF model or the ROADEF 2009 Challenge. We can observe that the number of percentile values less than 100 presented in the BTF model exceeds those presented by ROADEF 2009 Challenge, which leads us to conclude that our results for block time can used as a lower bound for simulation or validation procedures.
Block time percentile for the BTF model and ROADEF versus distance.

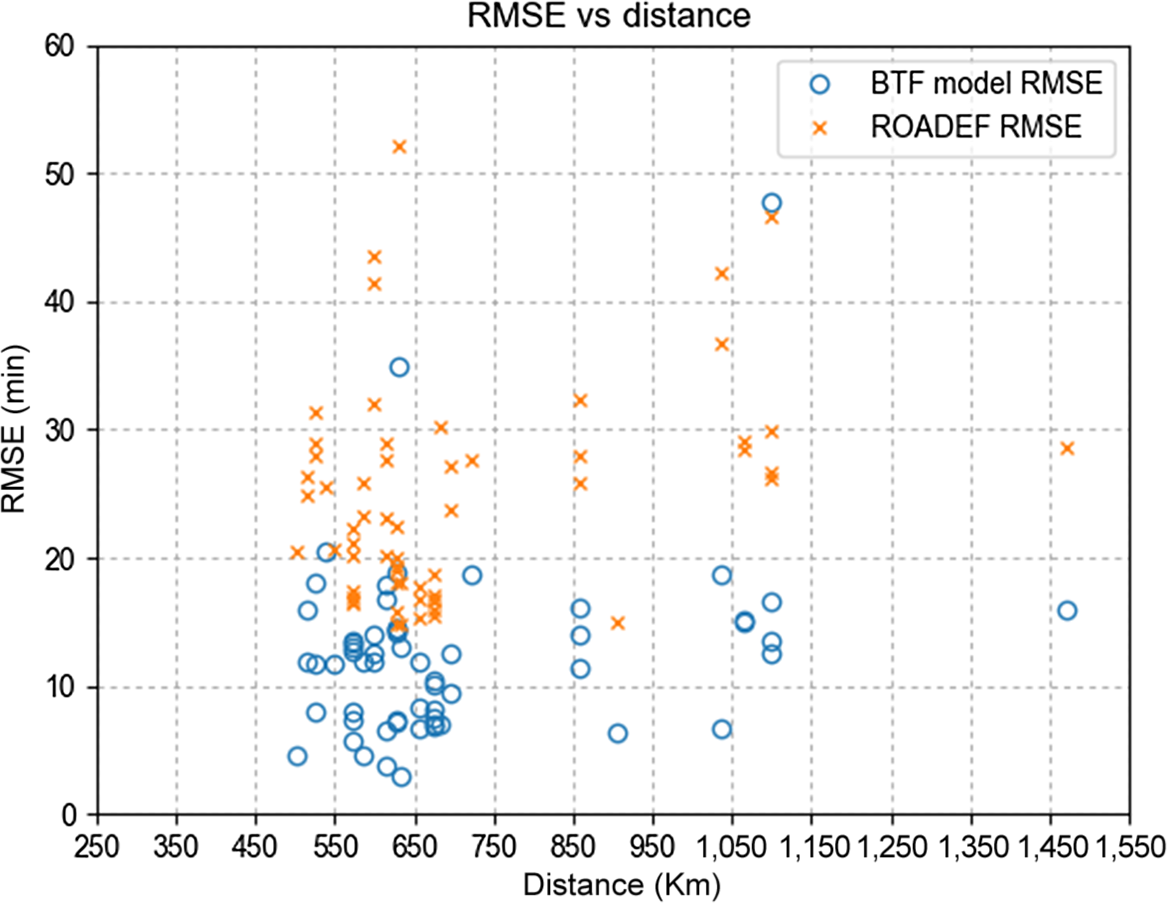
Figure 8 illustrates the RMSE for the BTF model and ROADEF 2009 Challenge versus the ground distance. The RMSE for each flight’s block time is obtained using Equation (25):
 \begin{equation} rmse_{if} = \sqrt{\frac{\sum_{n=1}^{k} (t_n - t_{if})^2 }{k}} , i = 1, 2, f = 1 ... 60\end{equation}
where k is the sample size for each flight f,  $t_n$ is the block time retrieved from Ref. (26) and t is the block time value either from the BTF model (
 $i = 1$) or the ROADEF 2009 Challenge (
 $i = 2$).
Block time RMSE for the BTF model and ROADEF versus distance.

When we calculated the RMSE for the BTF model and the ROADEF 2009 Challenge, we were able to confirm the latter in the sense that our model presented a larger set of lower values than the one presented by ROADEF.
As for the results regarding consumed fuel, we cannot make a full comparison between the BTF model and the ROADEF 2009 Challenge since it does not have these data.
5.5 Comparisons between the results in the literature review
In this section, we compare the results obtained using the BTF model and those published in the literature review. As we mentioned previously, in this work we calculate the fuel consumed by an aircraft considering each flight phase encompassed in the flight, from the origin to the destination airport gates. We also define the cruise flight level on the basis of the physical distance between the origin and destination airports. In addition, we choose an aircraft model with a range that can cover that physical distance.
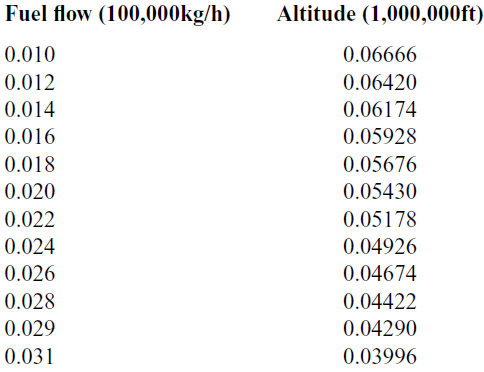
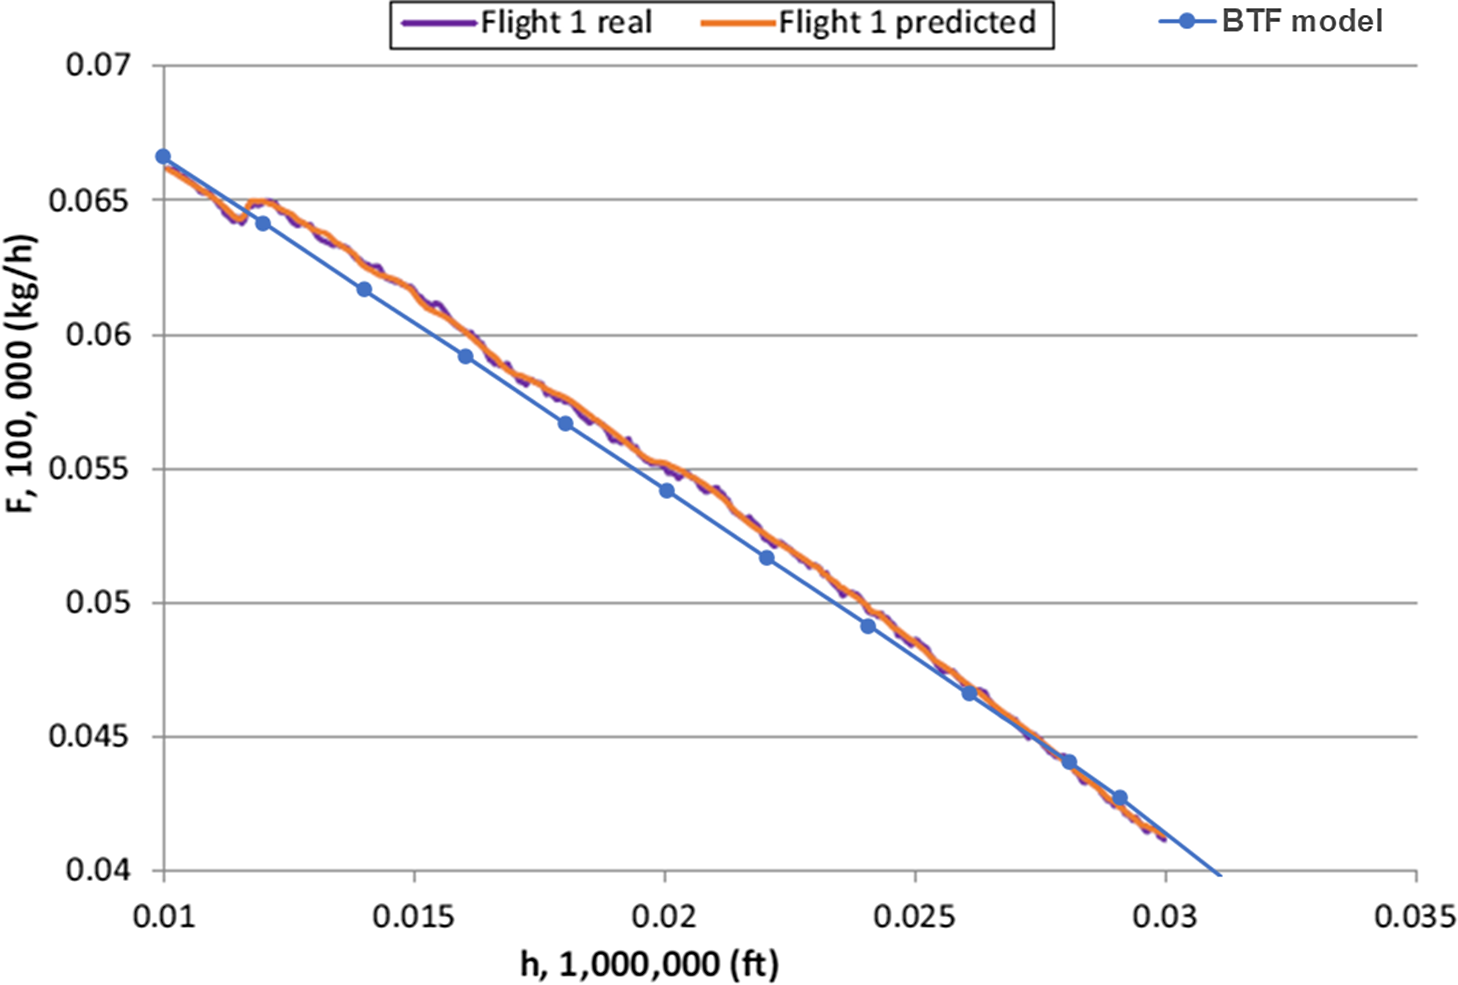
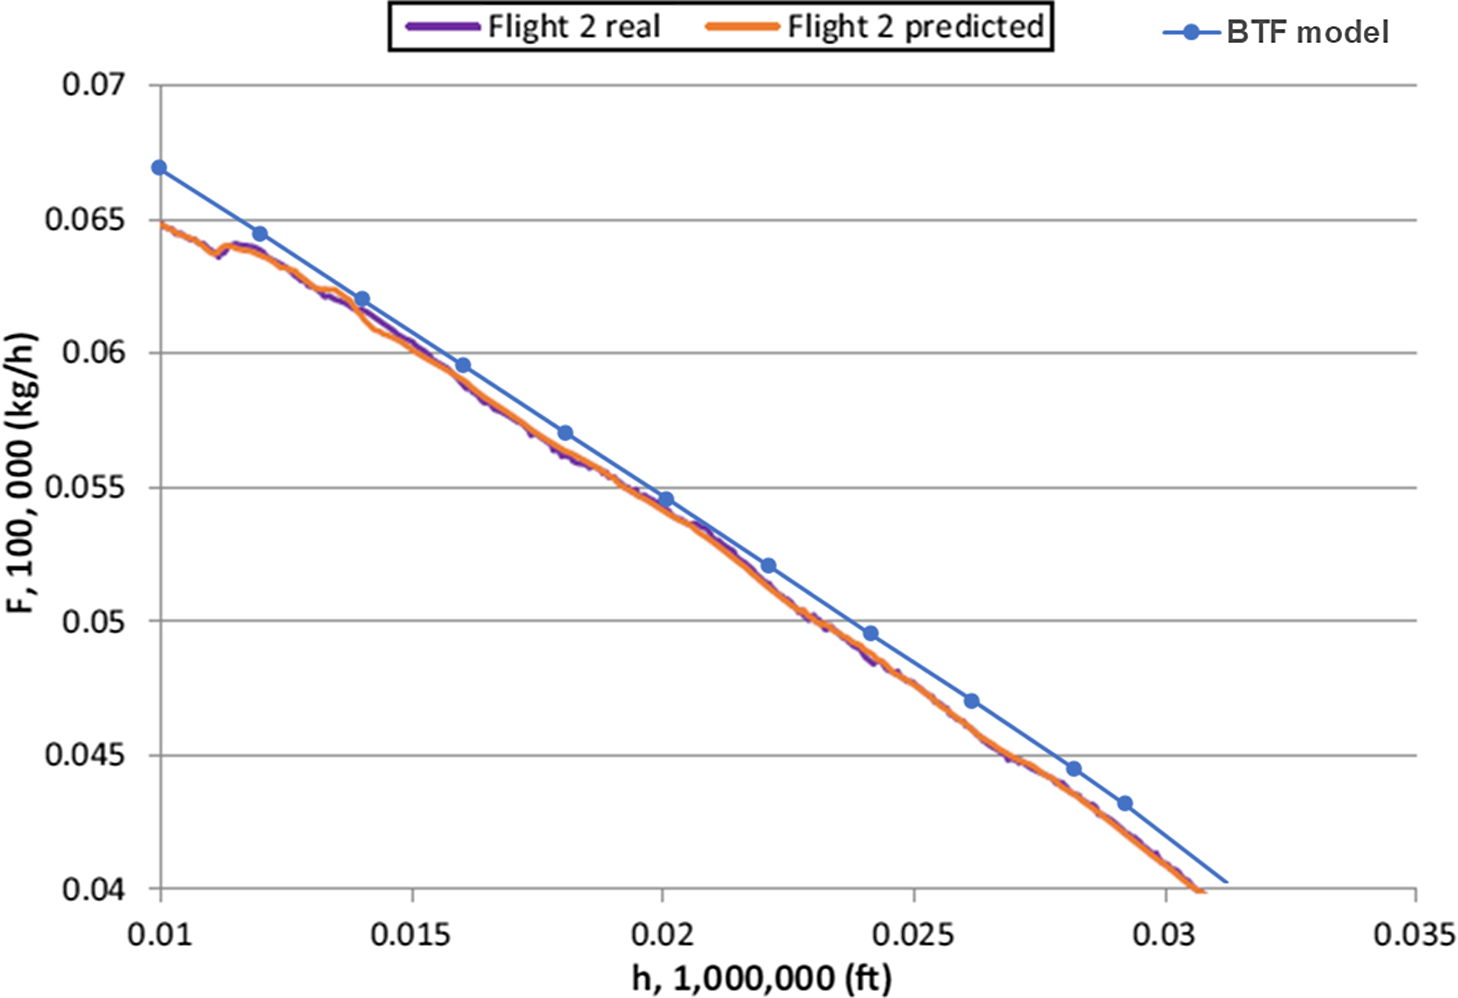
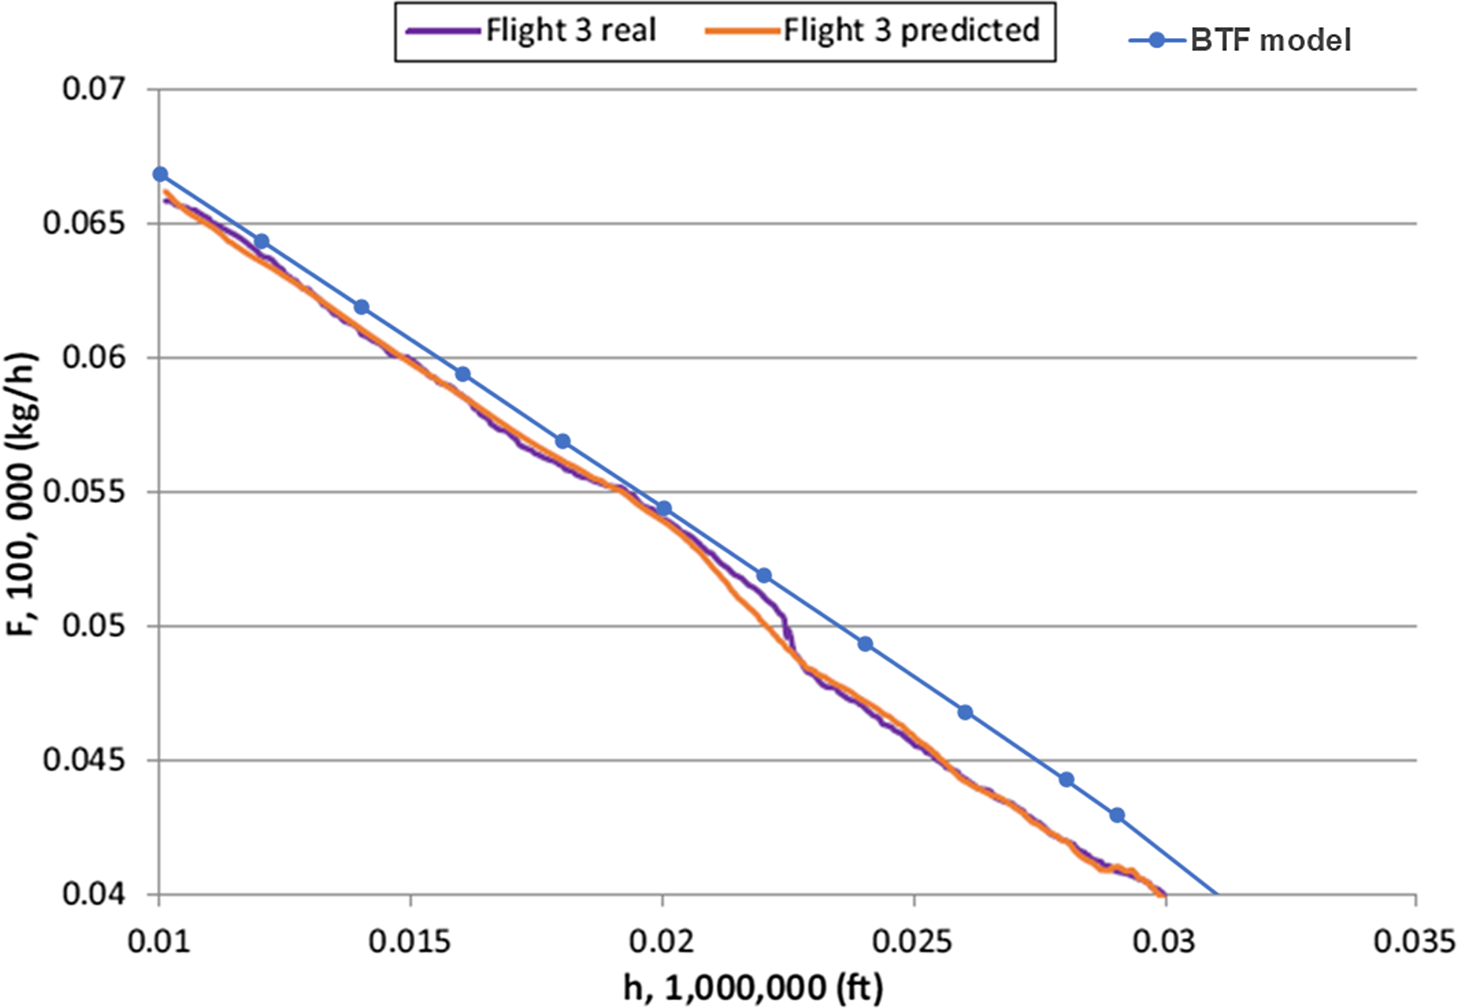
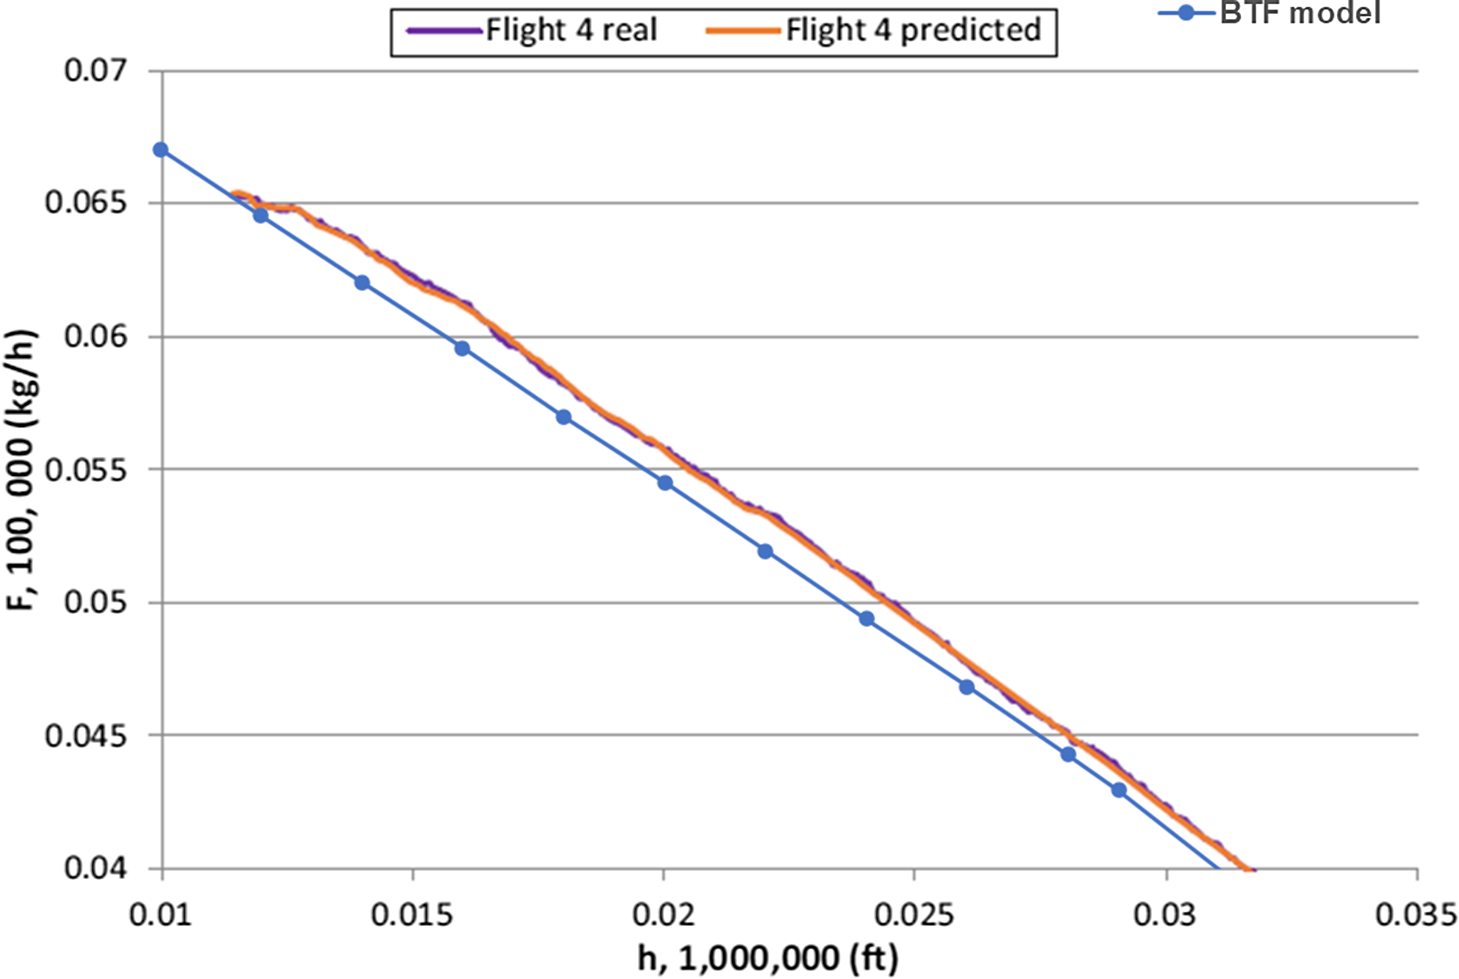
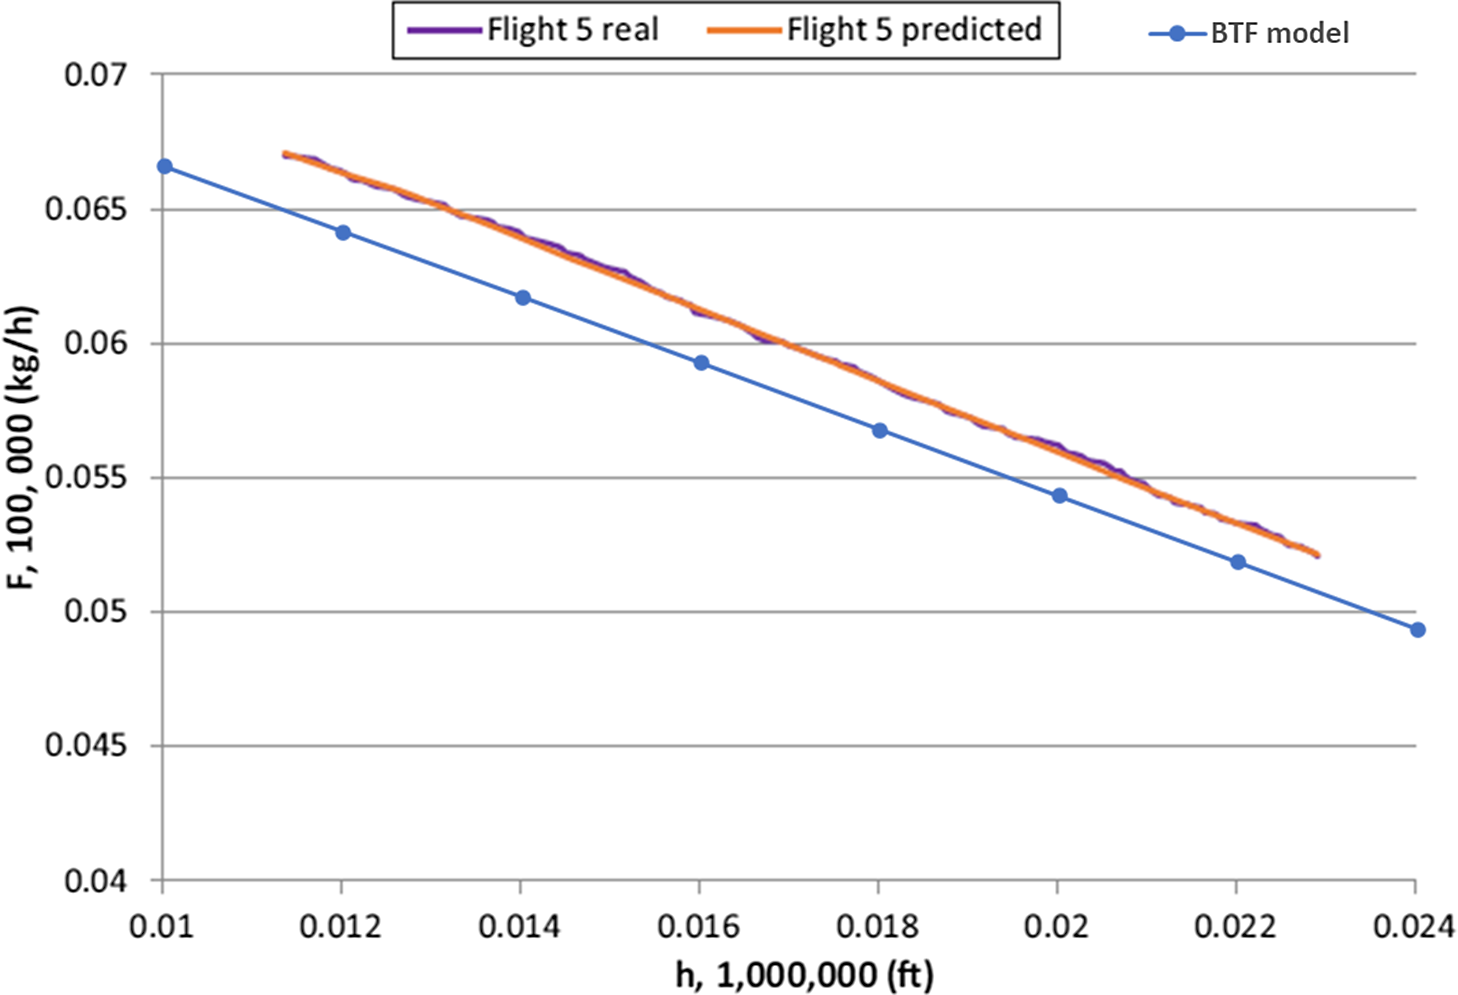
The work of Ref. (Reference Oruc and Baklacioglu9) consists of determining a fuel flow function for the climb phase, for a Boeing 737-800. With respect to the latter, the BTF model uses the fuel flow data provided by BADA, in the performance table for the Boeing 737-800. The authors modelled the fuel function for five flights, and conducted the respective error analysis. Since we do not have access to the TAS values the authors used to derive the fuel function, we cannot make an exact comparison between the values used for the BTF and those obtained using the CSA or the real ones. However, since the authors published the graphs of fuel flow versus altitude, we can make a qualitative comparison by superimposing the values used in the BTF model. Using this method, we can observe that, with the exception of flight five, the values used in the BTF model are in close accordance with those derived by the CSA and the real ones, as demonstrated in Appendix B.
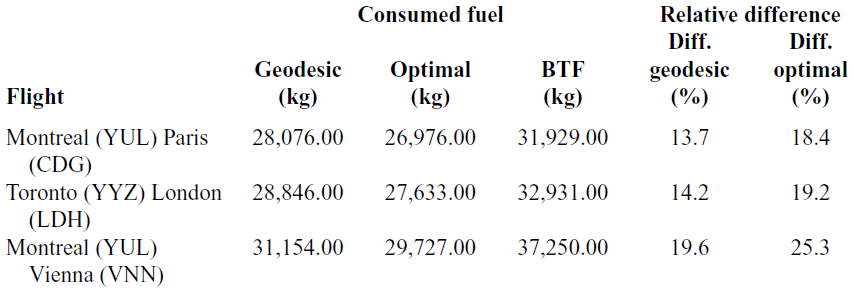
In Table 4 we compare the results of Ref. (Reference Murrieta-Mendoza, Ruiz and Botez7) with those obtained using the BTF model.
PSO and BTF results

In the work of Ref. (Reference Murrieta-Mendoza, Ruiz and Botez7), there is no explicit reference to which phases or aircraft models were considered when modelling fuel burn using the geodesic or the optimal trajectory. We assume that authors considered only CCD phases, and regarding the aircraft models, our assumption is based on our research of Flightaware for the most common aircraft models used on the same flights, namely, the Boeing 787-900 for the flights from Montreal to Paris and Toronto to London. Regarding the latter, the authors refer to the flight from Toronto to London using the International Air Transport Association (IATA) airport codes YYZ and LDH, respectively. After checking IATA codes, we were not able to find any airport in London with such IATA code; hence, we assumed in our modelling London Heathrow (LHR) airport. As for the flight from Montreal to Vienna, since we were not able to find any direct flights, we aggregate the consumed fuel from two legs, the first from Toronto to Amsterdam using a Airbus 330-200, and the second from Amsterdam to Vienna using a Boeing 737-800. We can observe relative differences that range from 13.% to 25.3%, which we can account mainly for the fact that we are not aware of the aircraft models or flight levels for the cruise phases that were used in their work.
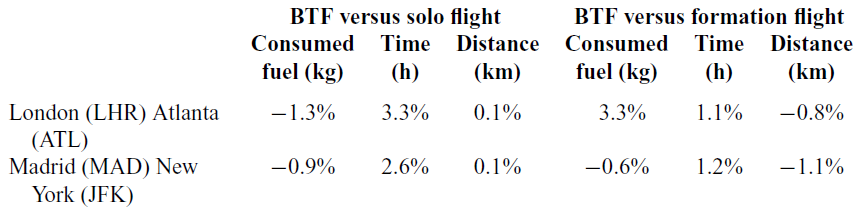
In the work of Ref. (Reference Hartjes, van Hellenberg Hubar and Visser8), the authors modelled the flights, from London to Atlanta and from Madrid to New York, using a Boeing 747-400. To compare the results of the BTF model and those presented in Ref. (Reference Hartjes, van Hellenberg Hubar and Visser8), we used the same aircraft model and assumed precise airport locations for each of the flights as presented in Table 5.
Solo flight, formation flight and BTF results

In the work of Ref. (Reference Hartjes, van Hellenberg Hubar and Visser8), during the cruise phase, the fight level increases with time and true airspeed decreases with time. In the BTF model, we assume that the cruise altitude is FL 380 and that the true airspeed has a constant value 451Kn. Although these distinctions exist, we can see that the relative differences, presented in Table 6, between the results of the work of Ref. (Reference Hartjes, van Hellenberg Hubar and Visser8) and the BTF model are minimal. The latter observation leads us to conclude that the more information we have, the better the fit between real values, for solo flights and the BTF model. Finally, we wish to note that there is a consistent pattern, albeit negligible, of the BTF time always being greater than the ones presented for solo or formation flights.
Solo flight, formation flight and BTF relative differences

6.0 CONCLUSION AND FUTURE WORK
In this paper, we modelled flight, integrating each of its composing phases starting from the departure gate and ending at the arrival gate. We integrated the ground movements using the data from EMEP/EEA emissions data set with BADA aircraft performance data tables. To model the flight when the aircraft is airborne, we used Newtonian mechanics. We assumed the Earth as a perfect sphere to calculate the distance between the origin and destination airports.
As a general rule, the aircraft reaches its flight level, then its cruising speed. From the moment the flight level is reached, the excess thrust (compared with the drag) would accelerate the aircraft. However, in this work, we consider that the cruise speed is constant. Additionally, because of the loss of mass (due to fuel burn), the lighter aircraft would tend to climb, but in our work we consider that, during the cruise phase, the altitude does not vary. As for the descent, we assume that it is continuous in the sense that the trajectory does not have periods in which it is flat. In reality, in this phase there are periods in which pilots will correct the descent trajectory, making it a stable flat line for short periods.
Although the ROADEF 2009 Challenge provides a complete data set to model airline disruption, it lacks data regarding the operation characteristics for the aircraft, namely, the amount of fuel consumed during a flight. To overcome this shortage, we used the values from literature review and concluded that the BTF model results have a good fit for time and consumed fuel for the CCD phases, provided that the inputs for origin and destination airports, and also the aircraft model, are known.
We conclude that aggregating EMEP/EEA data with BADA PTF data provides a simple and fast approach for block time and consumed fuel computation, and hence, we are able to confirm the conclusion of Ref. (Reference Alam, Tang, Lokan and Abbass24) that BADA fuel flow tables are a good approach when computational cost is a factor. Using this method, we were able to extend the work of Refs. (Reference Alam, Tang, Lokan and Abbass24), (Reference Murrieta-Mendoza, Ruiz and Botez7) and (Reference Hartjes, van Hellenberg Hubar and Visser8), not only in terms of the number flights evaluated but also for all the flight phases.
We also conclude that the model can provide lower bound results for flight planning, and we aim to introduce the current results for block time in the ROADEF Challenge 2009 and re-solve the problem. Finally, since the BTF model can calculate the fuel consumed during a flight, we also aim in future work to compare our results with those being used in commercial flight planning software.
Acknowledgements
The research included in this paper could not have been performed if not for the assistance, and support, of many individuals. I would like to extend my gratitude to Lus Costa Ramos (Aeronautical Engineer Technician), Ricardo Pato (First Officer at TAP), Antnio Francisco Caixeiro (Colonel at the Portuguese Air Force) and Jo£o Ferreira (Flight Commander at TAP). Their insight helped me through extremely difficult times over the course of the analysis and the writing of this paper, and for that I sincerely thank them for their confidence in me.
A.0 APPENDIX
A.1 Flight data for the BTF model, ROADEF and Flightaware
Block time comparison between the BTF model, ROADEF and Flightaware

B.0 APPENDIX
B.1 Fuel flow for the climb phase of the B737-800
BTF data for fuel flow versus altitude for the climb phase of the B737-800

Fuel flow versus altitude for flight 1.

Fuel flow versus altitude for flight 2.

Fuel flow versus altitude for flight 3.

Fuel flow versus altitude for flight 4.

Fuel flow versus altitude for flight 5.