Implications
It has been demonstrated that the level of dietary fibre plays a key role in preventing digestive troubles in young rabbits, but the mechanism involved remains poorly understood. We show that a switch from a control to a fibre-deficient diet alters the caecal environment and modifies the structure of the bacterial community. This study provides a comprehensive view of the interactions between fibre level and caecal bacterial community in the rabbit and suggests that the detrimental effect of a low-fibre diet on host health might be at least mediated through a modification of the structure of bacterial community.
Introduction
A high incidence of digestive diseases is observed in young mammals, particularly during the period following weaning. Anti-microbial agents are frequently used to limit the occurrence of these digestive troubles; however, the European policy tries to put a ban on such practices. One promising strategy is to modify the gastrointestinal tract microbiota by using specific nutritional components in adjusted proportions in the diet (Gidenne, Reference Gidenne1997; Carabaño et al., Reference Carabaño, Badiola, Chamorro, Garcia, Garcia-Juiz, Garcia-Rebollar, Gomez-Conde, Guttiérez, Nicodemus, Villmaide and De Blas2008). However, the relationships between dietary components, microbial community and animal health are currently poorly understood. The use of fibrous ingredients, which are the main energy substrates for the microbiota, may represent a strategy to modify bacterial population along the gastrointestinal tract.
In rabbits and pigs, several studies demonstrated that decreasing fibre content in the diet increased mortality rate (Bennegadi et al., Reference Bennegadi, Gidenne and Licois2001; Gidenne, Reference Gidenne2003; Montagne et al., Reference Montagne, Pluske and Hampson2003), suggesting that dietary fibre is a key component to improve animal health. Indeed, in rabbits, low fibre intake results in lower growth rate during the 2 weeks after weaning (Gidenne, Reference Gidenne2003), which are often associated with intake troubles or digestive disorders, without any identification of a specific pathogenic agent (Bennegadi et al., Reference Bennegadi, Gidenne and Licois2001). A decrease in the dietary fibre level has been reported to decrease the amount of Bacteroidetes(Bennegadi et al., Reference Bennegadi, Fonty, Millet, Gidenne and Licois2003) and cellulolytic bacteria in the caecum (Boulahrouf et al., Reference Boulahrouf, Fonty and Gouet1991). However, there is a lack of knowledge regarding the response of the caecal ecosystem to a change in the dietary fibre level and its consequences for host health.
Consequently, this study aimed to evaluate the response of the rabbit caecal ecosystem to a nutritional stress, using an abrupt switch from a control to a fibre-deficient diet. To study the dynamics of the bacterial community, the weaned rabbits were first fed a control diet in order to reach stability and were then submitted to the dietary change.
Material and methods
Experimental design
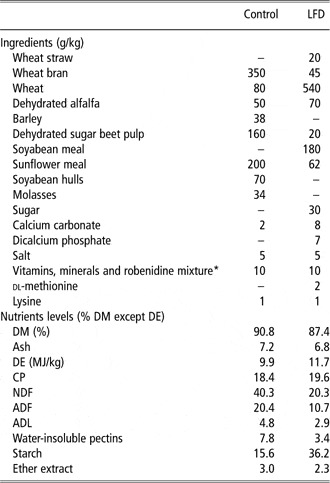
A total of 160 New Zealand × Californian rabbits were used in the experiment. At weaning (36 days), the 160 rabbits were randomly distributed into control and experimental groups according to their weight at weaning and litter origin (rabbits of each litter in equal number per group), so that 75 were assigned to low-fibre diet (LFD) group and 85 were assigned to control group. Rabbits were maintained in individual cages of 33 cm × 70 cm × 25 cm at 18°C to 21°C under controlled husbandry at the experimental unit of UMR 1289 INRA TANDEM (Castanet-Tolosan, France). Rabbits were not medicated. From weaning (36 days old) until the beginning of the experiment (49 days of age), the rabbits were fed with a control diet (Rablo Formax GVR, GCO, Castelnaudary, France, control diet; Table 1) meeting the nutrient needs of growing rabbits. At 49 days of age (day 0), rabbits were switched to a LFD for 39 days (LFD group). This feed was made at UMR 1289 INRA TANDEM (Table 1). Control animals remained to be fed on the control diet (control group). The changes in diet formulation between control and fibre-deficient diet affect mainly the level of fibre (see Table 1), but also to the type of fibre and protein sources included in the diets. Both groups of rabbits were fed ad libitum and had free access to fresh water. Mortality was checked daily on the 160 rabbits and growth performance and sampling were performed on 120 rabbits (60 per groups) according to their representative weight in the group.
Ingredients and chemical composition of the experimental diets

LFD = low-fibre diet; DM = dry matter; DE = digestible energy.
*Vitamin A: 1 800 000 UI/kg; D3: 200 000 UI/kg; B1: 300 mg/kg; E: 6000 mg/kg. Oligo elements: Cu2+: 4000 mg/kg; Fe2+: 14 000 mg/kg; Zn2+: 20 000 mg/kg; Mn2+: 7000 mg/kg. Robenidine: 66 mg/kg.
Sampling, measurement and determination of environmental parameters
Diet switch in the LFD group was performed at 49 days of age (day 0). Five control rabbits and five LFD rabbits were randomly selected for sampling and measurement purposes on days 2, 5, 8, 11, 15, 18, 22, 25, 29, 32, 36 and 39 (on the last sampling day, the rabbits were 88 days old). For sampling, the rabbits were anaesthetized using 0.5 ml/kg of Rompun® 2% (Bayer, Leverkusen, Germany) and 0.4 ml/kg of Imalgène® 1000 (Merial, Lyon, France). Caecal content (about 0.2 g) was collected after incision of the caecal wall, and stored at −20°C for 3 to 5 months until microbial analyses. Then the pH and the redox potential (Eh) were recorded in vivo according to the method of Kimsé et al. (Reference Kimsé, Monteils, Bayourthe and Gidenne2009) using electrodes with Pt 1000 for pH and combined Pt-ring electrode for Eh (Unitrode Metrohm, Heriseau, Switzerland). After these measurements, the rabbits were euthanized using 0.3 ml/kg of T61® (Intervet International GmbH, Unterschleissheim, Germany). For the determination of volatile fatty acid (VFA) concentrations, 1 g of caecal content was collected in tubes containing 2 ml of 2% HgCl2. VFA was measured by automated gas chromatography (Chrompack CP 9000 gas chromatograph, Chrompack B.V., Middleburg, the Netherlands) according to Playne (Reference Monteils1985). For NH3-N assays, 1 g of caecal content was sampled in tubes containing 3 ml of 2% H2SO4. NH3-N concentration was determined by a colorimetric method by a Continuous Flow Analyzer (SAN++, Skalar, Norcross, Georgia, USA) as previously described by Krom (Reference Krom1980). Dry matter (DM) was determined using 3 g of caecal content dried at 100°C for 24 h. Fibrous fraction of the caecal content (neutral detergent fibre ‘NDF’, acid detergent fibre ‘ADF’) was determined according to the sequential method of Van Soest et al. (Reference Van Soest, Robertson and Lewis1991). The following chemical analyses were carried out on feed (European Group of Rabbit Nutrition; EGRAN, 2001): DM (24 h at 103°C), ash (5 h at 550°C), fibrous fractions (NDF, ADF and ADL) according to the sequential method of Van Soest et al. (Reference Van Soest, Robertson and Lewis1991) with an amylolytic pretreatment, and crude fat according to the method described by Alstin and Nilsson (Reference Alstin and Nilsson1990). Nitrogen was determined according to the DUMAS combustion method using the Leco autoanalyzer (model FP-428, Leco Corporation, St Joseph, MI, USA) and converted to crude protein (factor 6.25). Starch was determined according to Edwards et al. (Reference Edwards, Gilson, Champ, Jensen, Mathers, Nagengast, Rumney and Quehl1996). The digestible energy and water-insoluble pectin contents of both diets were calculated according to Sauvant et al. (Reference Sauvant, Perez and Tran2004) and Gidenne (Reference Gidenne2003), respectively.
DNA extraction and 16S rRNA genes PCR–CE-SSCP (capillary electrophoresis single strand conformation polymorphism)
Total DNA from about 0.2 g of caecal sample was extracted and purified with QIAamp® DNA Stool Mini kit (Qiagen Ltd, West Sussex, England) according to the manufacturer's instructions. The V3 region of the 16S rRNA genes was used as a bacterial diversity marker with the primers w49 and 5′-6FAM-labeled w34 (Delbès et al., Reference Delbès, Moletta and Godon2000; Zumstein et al., Reference Zumstein, Moletta and Godon2000). PCR assays were performed as described previously (Michelland et al., Reference Michelland, Combes, Monteils, Cauquil, Gidenne and Fortun-Lamothe2009b) except that 25 cycles of amplification and Isis DNA Polymerase Taq (MP Biomedicals, Illkirch, France) were used. The CE-SSCP was performed on an ABI Prism 3100 Genetic (Applied Biosystems, Branchburg, NJ, USA) as previously described (Michelland et al., Reference Michelland, Combes, Monteils, Cauquil, Gidenne and Fortun-Lamothe2009b). CE-SSCP profiles were aligned and normalized using StatFingerprints program version 2.0 (Michelland et al., Reference Michelland, Dejean, Combes, Fortun-Lamothe and Cauquil2009a) running on R version 2.8.3 (R Development Core Team, 2008). The Simpson diversity index was estimated on each CE-SSCP profile with – log ∑(ai)2, where ai is the relative area under the ith peak (Rosenzweig, Reference Rosenzweig1995).
Real-time PCR
Absolute quantification of total bacteria was performed using the ABI Prism 7900HT sequence detection system (Applied Biosystems, Branchburg, NJ, USA) using optical grade 384-well plates in a final volume of 10 μl. TaqMan reaction mixture contained 2.5 μl of 200-times diluted template DNA, a set of primer (200 nM) and of TaqMan probe (250 nM; Suzuki et al., Reference Suzuki, Taylor and DeLong2000) and 5 μl of TaqMan® universal PCR master mix (Applied Biosystems, Branchburg, NJ, USA). The PCR programme consisted of 10 min at 95°C, followed by 40 cycles of 15 s at 95°C and 1 min at 60°C. Standard curves were generated by amplification of the serial 10-fold dilutions of plasmid (from 104 to 109 copy number) containing the 16S rRNA genes sequence (acc: EF445158 Monteils et al., Reference Monteils, Cauquil, Combes, Godon and Gidenne2008). Plasmid concentrations were measured using NanoDrop ND-1000 spectrophotometer (NanoDrop Technologies, Wilmington, DE, USA). The copy numbers for each reaction were calculated from the standard curves.
Statistical analysis
Growth performance data, caecal environmental parameters, real-time PCR data and diversity index were subjected to analysis of variance (ANOVA) and Tukey's HSD post-hoc test using dietary treatment (2 levels), day of sampling (12 levels) and their interaction as fixed effects (R Development Core Team, 2008). Mortality was tested using a Chi-square test. The correlations between the caecal environmental parameters, the diversity index and the number of 16S rRNA gene copies of total bacteria, were analysed using a centred and scaled principal components analysis (PCA). The CE-SSCP profiles were explored using a centred and scaled PCA to visualize on a two-dimensional figure the variability among the 120 CE-SSCP profiles without any prerequisites. To test the effect of diet, time and their interaction on the CE-SSCP profiles a fifty–fifty multivariate ANOVA (FF-MANOVA) was performed with 10 000 rotations (Langsrud, Reference Langsrud2002 and Reference Langsrud2005) using dietary treatment, day of sampling and their interaction as fixed effects. Finally to assess which scans of the CE-SSCP profiles differed between the two groups, an iterative Mann–Whitney test on the 1200 scans was performed (result are indicated using bold horizontal dashed line in Figure 3b). The correlations between the CE-SSCP profiles of the bacterial community and the caecal traits were tested using redundancy analysis (RDA) with 10 000 Monte Carlo permutations (Legendre and Legendre, Reference Legendre and Legendre1998). Before the RDA, the caecal traits (centred and scaled) included in the model were selected using a stepwise selection.
Results
Effect of switch to LFD diet on rabbit performance and caecal environment
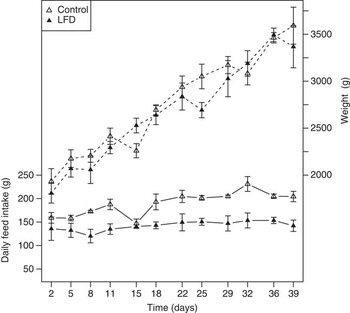
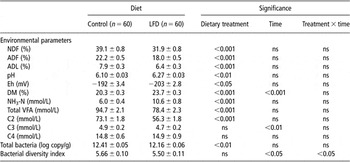
Seven rabbits out of 160 died between weaning (36 days of age) and day 0 (49 days of age). Despite a severe deficiency in fibre supply, the mortality during the experimental period (day 0 to day 39) was not significantly different for the control and the LFD groups. During this period, 13 rabbits died: eight during the first week after the switch (three in control group and five in LFD group, ns) and five others during the 3 following weeks (two in the control group and three in the LFD group, ns). The 120 rabbits used for caecal sampling weighted 1091 ± 121 g at weaning (36 days old) and 1772 ± 224 g at the moment of the dietary switch (49 days old). High growth performances were recorded in both groups (Figure 1) during the entire experimental period (3479 ± 414 g at 88 days of age). As expected, the daily feed intake was lower (P < 0.001; Figure 1) when rabbits were fed the LFD instead of the control diet. Thus, over the experimental period (day 0 to day 39), the feed intake reduction combined with the reduced dietary fibre concentration of the diet emphasized the difference in the level of fibre intake between the two groups. However, owing to diet formulation constraint (Table 1), the decrease in fibre supply is also associated with a modification in fibre and protein sources. The caecal concentrations of the fibre components were lower in the LFD than in the control rabbits (−7.2, −4.2 and −1.5 g 100 per g for NDF, ADF and ADL, respectively; P < 0.001; Table 2). Indeed, the caecal environment of the LFD rabbits was less acid (+0.2 unit), more reductive (−11 mV) and drier (+3.4 g 100 per g) than those of the control rabbits (P < 0.05). Concentration of total VFA in the caecal ecosystem was lower (−17%; P < 0.001) in the LFD group than in control rabbits. This was because of a lower acetic acid level (−23%; P < 0.001) in LFD than in the control rabbits. Moreover, NH3-N caecal concentration was 77% higher in LFD rabbits (P < 0.001) than in control rabbits. During the entire experiment, the chemical composition of the caecal environment in both groups remained stable, except the percentage of DM and the concentration of propionic acid, which exhibited brief and sporadic fluctuations (P < 0.01; data not shown).
Effect of dietary changeon voluntary feed intake (solid line) and live weight (dashed line) in the 60 low fibre diet (▴) compared to the 60 control (▵) rabbits. Day 0 was the day of the dietary switch (49 days of age). Values are mean ± s.e. (n = 5 per group and per sampling day).

Effect of dietary change on the caecal environmental parameters, the number of 16S rRNA gene copies of total bacteria and the bacterial diversity index in rabbits (values are mean ± s.e. of these parameters for the rabbits between 49 and 88 days of age)

LFD = low-fibre diet; Eh = redox potential; DM = dry matter; C2 = acetic acid; C3 = propionic acid; C4 = butyric acid.
ns at P < 0.05.
Effect of LFD switch on bacterial concentrations and diversity
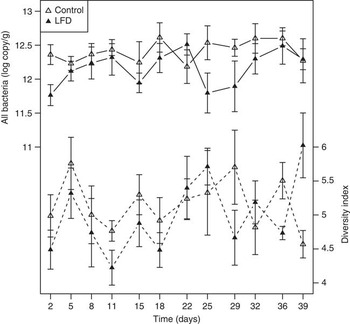
Throughout the experiment, the number of total bacteria 16S rRNA gene copies in both groups remained stable between days of sampling but was lower in the caecum of the LFD than of the control rabbits (P < 0.01; Table 2, Figure 2). The bacterial diversity index was similar between groups (5.6 ± 0.8, ns, Table 2, Figure 2). The significant interaction time × group was explained by a lower value on day 11 and a higher one on day 39 in the LFD group (P < 0.05).
Effect of dietary changeon the number of 16S rRNA gene copies of total bacteria and the bacterial diversity index in the 60 low fibre diet (▴) compared to the 60 control (▵) rabbits. Day 0 was the day of the dietary switch (49 days of age). Values are mean ± s.e. (n = 5 per group and per sampling day).

Effect of the switch to a LFD on the bacterial community structure
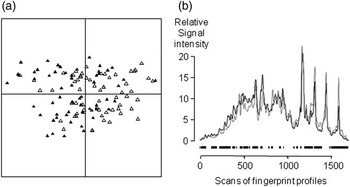
The CE-SSCP profiles of the caecal bacterial community differed significantly between the control and the LFD rabbits (P < 0.001). However, only 2% of the variance of the CE-SSCP profiles set was explained by the change in level and type of fibre according to the FF-MANOVA (data not shown). This result was apparent from the PCA analysis, which showed a strong overlap between the two groups (Figure 3a). However, 60% of the scans throughout the CE-SSCP profile differed between the LFD rabbits and the control rabbits (Figure 3b). These modifications in the structure of the bacterial community were more related to changes in peaks’ relative area than in appearance/disappearance of peaks. In both groups, the structure of the caecal bacterial community did not differ over time (data not shown).
Effect of dietary changeon the structure of the bacterial community. (a) Principal components analysis plot of the capillary electrophoresis single strand conformation polymorphism profiles assessed in the 60 low fibre diet (LFD; ▴) compared to the 60 control (▵) rabbits. (b) Mean of the CE-SSCP profiles in the LFD (solid line), and control (dotted line) rabbits and iterative test significance at P < 0.05 (bold horizontal dashed line).

Relationships between bacterial concentrations and diversity and the caecal environment
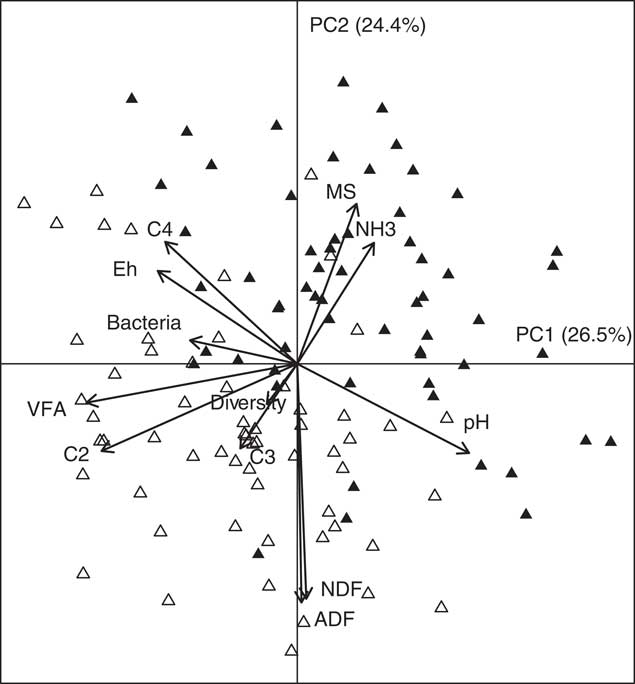
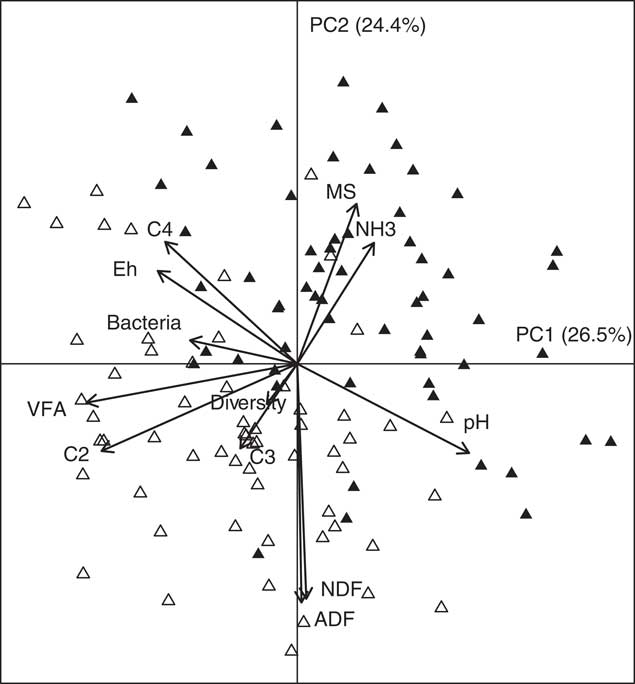
PCA analysis was performed to study the relationship between the environmental parameters, the diversity index and the number of 16S rRNA gene copies of total bacteria (Figure 4). The first three principal components explained 64% of the total variance. On the first principal component, 16S rRNA gene copy number for total bacteria was positively related to total VFA, acetic acid, butyric acid, Eh and negatively to pH value. NDF and ADF caecal concentrations were strongly correlated to the second axis, and thus were not correlated to 16S rRNA genes copy number. The bacterial diversity index makes a low contribution to the constitution of the three first components and was thus poorly related to the previous variables.
Principal components analysis plot of the ten caecal environmental parameters, the diversity index and the number of gene copies of total bacteria, assessed in caecum contents of the 60 low fibre diet (▴) compared to the 60 control (▵) rabbits aged 49 to 88 days. C2 = acetic acid; C3 = propionic acid; C4 = butyric acid.
Relationships between the bacterial community structure and the caecal environment
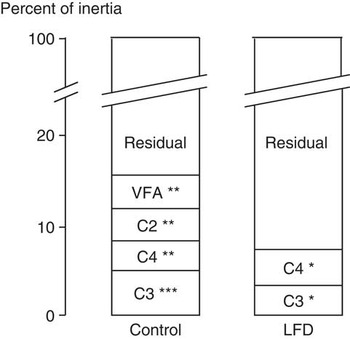
In both groups, the caecal traits barely constrained the total inertia of CE-SSCP profiles set (14% and 7% for the control and the LFD rabbits, respectively; Figure 5). In the control rabbits, the structure of the bacterial community was correlated to the total VFA concentrations of the ecosystem (P < 0.01) and subsequent relative concentrations: acetic (P < 0.01), propionic (P < 0.001) and butyric (P < 0.01) acids. In the LFD rabbits, the structure of the bacterial community was correlated to the propionic (P < 0.05) and butyric (P < 0.05) acid concentrations.
Variance partitioning with partial redundancy analysis of capillary electrophoresis single strand conformation polymorphism data from the 60 control and the 60 low fibre diet rabbits aged 49 to 88 days according to the stepwise selected environmental parameters. C2 = acetic acid; C3 = propionic acid; C4 = butyric acid; VFA = total volatile fatty acids; *P < 0.05; **P < 0.01; ***P < 0.001.

Discussion
In the present work, we intended to better characterize the effects of a dietary change, consisting mainly in a reduction in dietary fibre level, but also in a modification in fibre type and protein supply, on structure and diversity of the caecal bacterial community using CE-SSCP and concentrations of total bacteria using real-time PCR.
To our knowledge, despite the value of fibre in preventing digestive troubles, there are no data available on the effects of dietary fibre level on whole caecal bacterial community in rabbits using molecular profile analyses. Previous studies focused particularly on the effect of fibre level on specific cultivable taxonomic groups (Bennegadi et al., Reference Bennegadi, Fonty, Millet, Gidenne and Licois2003) or cultivable functional groups (Boulahrouf et al., Reference Boulahrouf, Fonty and Gouet1991). Recently, Gomez-Conde et al. (Reference Gomez-Conde, de Rozas, Badiola, Pérez-Alba, de Blas, Carabaño and García2009) studied the effect of soluble fibre level on the whole bacterial community but ADF, NDF and ADL were fixed. In the hindgut fermenters of other mammals, the effect of dietary fibre levels on the bacterial community is controversial. In the pig, terminal restriction fragment length polymorphism analysis demonstrated differences in the bacterial community structure in the colon according to non-starch polysaccharide dietary level (Leser et al., Reference Leser, Lindecrona, Jensen, Jensen and Moller2000). Moreover, some operational taxonomic units were shown to be specific to the dietary treatment. In the same species, lignocellulose supplementation (5-fold and 3-fold increase compared with the control diet for ADF and NDF levels, respectively) tended to increase the cell counts of total bacteria in faeces and increased the band numbers of denaturing gradient gel electrophoresis (DGGE) in the ileum content samples (Metzler et al., Reference Metzler, Vahjen, Baumgärtel, Rodehutscord and Mosenthin2009). Recently, using DGGE, Jia et al. (Reference Jia, Frantz, Khoo, Gibson, Rastall and McCartney2010) demonstrated that a 0.9% fibre blend supplementation was sufficient to modify the gut microbiota of dogs. However, using the same methods and species, Simpson et al. (Reference Simpson, Martineau, Jones, Ballam and Mackie2002) did not find any differences in the structure of the bacterial community when dietary-insoluble fibre was reduced from 12% to 6%. These controversial results may be partly attributed to the magnitude of the perturbation and/or the buffering capacity of fermenters of each mammal species. In the present study, the dietary change modifies the bacterial community structure, as well as the quantity of total bacteria. However, these modifications did not affect the diversity index. Consequently, the decrease of proportion of some species as a consequence of a change in substrate availability could be compensated for by the increase of proportion of other species better adapted to the available nutrients (Cardinale et al., Reference Cardinale, Palmer and Collins2002; Zoetendal et al., Reference Zoetendal, Collier, Koike, Mackie and Gaskins2004).
This decrease in fibre substrate for the caecal microbiota altered the physico-chemical parameters of the ecosystem as previously reported (Gidenne et al., Reference Gidenne, Combes, Licois, Carabaño, Badiola and Garcia2008 for review). The caecal environment was drier, less acid and more reductive when the dietary fibre supply decreased. Small difference in Eh (11 mV) between groups might be explained by difference in pH. We also observed changes in the fermentation pattern with a decrease in the VFA concentrations and an increase in the NH3-N concentration. The increase in pH might be explained by the smaller quantity of VFA and especially of the acetic acid produced by the bacterial community, although a relationship between those parameters is not systematically observed in rabbit caecum (Garcia et al., Reference Garcia, Gidenne, Falcao, Cunha and De Blas2002). Garcia et al. (Reference Garcia, Gidenne, Falcao, Cunha and De Blas2002), who analysed a database constituting data from three laboratories, demonstrated that NDF was significantly correlated with caecal pH and VFA concentration. A lower production of VFA in the rabbit caecum underlined thus the change in caecal microbial activity in relationship with the lower level of poorly digested fibre (such as lignin and cellulose) and was previously attributed to a decrease in the number of cellulolytic bacteria (Boulahrouf et al., Reference Boulahrouf, Fonty and Gouet1991). Falcão-e-Cunha et al. (Reference Falcão-e-Cunha, Peres, Freire and Castro-Solla2004) showed that the type of fibre affected the caecal fermentative activity. In the present study, we found that the reduction in fibre intake did not induce an increase in the butyric acid concentration, in contrast with previous reports (Gidenne and Bellier, Reference Gidenne and Bellier2000; Bennegadi-Laurent et al., Reference Bennegadi-Laurent, Gidenne and Licois2004). We also found weak but significant correlations between the bacterial communities, the quantities of bacteria and the caecal traits of the caecal ecosystem. Total bacterial numbers were positively related to the fermentative activity product concentrations (total VFA, acetic acid and butyric acid), and thus negatively to pH. The reductive status (measured by Eh) and acidity (pH) were previously described as important parameters selecting bacterial species in the digestive tract of other animals (Kamra, Reference Kamra2005). In control rabbits, the proportion of the three VFA, as well as total VFA, seemed to partially shape the structure of the community, whereas in LFD rabbits only propionic and butyric acid seemed to be related to the community structure.
In the present work, the control group enabled us to study the dynamics of the caecal ecosystem in stable nutritional conditions. Our results demonstrated that the bacterial community (structure and total quantity of bacteria) and the caecal traits (except DM) of the caecal ecosystem were stable over the 39 days of the experiment. Several studies previously demonstrated such stability in the hindgut fermenter in rabbit (Michelland et al., Reference Michelland, Combes, Monteils, Cauquil, Gidenne and Fortun-Lamothe2009b), in man (Abell and McOrist, Reference Abell and McOrist2007), pigs (Leser et al., Reference Leser, Lindecrona, Jensen, Jensen and Moller2000) and dogs (Simpson et al., Reference Simpson, Martineau, Jones, Ballam and Mackie2002). Such stability may be partly attributed to the constant composition of nutrients entering the caecum because of the constant composition of the diet and the distal position of this fermenter. In the LFD group, only 2 days after the change in diet, the bacterial community and the caecal traits in the caecal ecosystem reached a new steady state and remained stable during the 37 subsequent days. In accordance with our results, in the horse colon or caecum, it has been shown that bacterial counts and the activity of the microbial communities were modified as early as 29 h after an abrupt incorporation of barley in the diet (de Fombelle et al., Reference De Fombelle, Julliand, Drogoul and Jacotot2001). The stability we observed in the present study indicated that the caecum bacterial community had quickly adapted to the lower availability of fibre substrate. All these results suggest that the bacterial community can quickly reach a new balance in response to a switch to a LFD. As, in commercial rabbit husbandry, digestive troubles occur in the 2 weeks following the weaning, further studies have to be undertaken to confirm the ability of the bacterial community to rapidly adapt in the weaned rabbits. Indeed, in the present study, the older age of the animals used in this study, and the higher maturity of the caecum, explains the rapid adaptation of the rabbit caecal ecosystem to a dietary change and the lack of effect on mortality.
Conclusion
In conclusion, the present experiment demonstrated that a reduction in the dietary fibre supply altered the caecal ecosystem. Indeed, it modified the structure of the bacterial community, and decreased the quantity of bacteria. Weak but significant correlations were found between the caecal bacterial community and its environment, providing us new prospects for understanding the metabolism of the rabbit caecal ecosystem. Moreover, our results suggested that the bacterial community of the rabbit caecum can quickly reach a new equilibrium state in response to a fibre dietary change.
Acknowledgements
The authors are grateful to Carole Bannelier, Béatrice Gabinaud, Muriel Segura and Véronique Tartie for their technical assistance in the laboratory and to Patrick Aymard, Jacques De Dapper, Jean De Dapper and André Lapanouse in the breeding centre. The work of the staff at the Centre de Ressources, Génotypage et Séquencage of Toulouse is also gratefully acknowledged.