Implications
The size of the reference population strongly influences genomic evaluation. If the size of the progeny-tested bull reference population is small, inclusion of domestic cows must be considered. In order to maximize the prediction accuracy by including genotyped cows in the reference population, we must investigate how the reliability and prediction bias are affected by the inclusion of cows under several conditions. The results of this study indicate that the prediction method, the contribution of included animals, and genetic relatedness should be taken account in designing genomic evaluation in order to maximize the prediction accuracy.
Introduction
Genomic evaluation is now a standard procedure in dairy cattle breeding, owing to the possibility of improving the accuracy of traditional estimated breeding value (EBV) by predicting the genomic enhanced breeding value (GEBV) (Hayes et al., Reference Hayes, Bowman, Chamberlain and Goddard2009; VanRaden et al., Reference VanRaden, Van Tassell, Wiggans, Sonstegard, Schnabel, Taylor and Schenkel2009). Many factors influence the accuracy of GEBV; in particular, the accuracy of GEBV is strongly dependent on the number of genotyped animals in the reference population (VanRaden et al., Reference VanRaden, Van Tassell, Wiggans, Sonstegard, Schnabel, Taylor and Schenkel2009; Daetwyler et al., Reference Daetwyler, Pong-Wong, Villanueva and Woolliams2010). The accuracy of GEBV was shown to increase significantly as the size of the reference population increased to 10 000 bulls (Lund et al., 2011; Wiggans et al., Reference Wiggans, VanRaden and Cooper2011b). Therefore, a large number of genotyped animals are required in the reference population to obtain higher accuracy of GEBV. In dairy cattle, the reference population is usually composed of progeny-tested bulls, because these bulls possess more reliable information, which is obtained from a larger number of daughters’ records, compared with cows with records. However, the number of progeny-tested bulls is limited because of a small dairy cattle population in Japan, and the current number of genotyped bulls in the reference population is substantially lower than that in the United States and other countries.
Alternative approach for the genomic evaluation using small progeny-tested bull populations is to include genotyped foreign bulls (Weller et al., Reference Weller, Stoop, Eding, Schrooten and Ezra2015) or genotyped domestic cows with records (Wiggans et al., Reference Wiggans, Cooper, VanRaden and Cole2011a) in the reference population (Calus, Reference Calus2016). When including the latter, it is important to understand how information from additional genotyped cows contributes to the accuracy of GEBV in our population, because the contribution to overall reliability is different between bulls and cows (de Roos, Reference de Roos2011). However, the accuracy of GEBV using these animals depends on the evaluation methods used (Wiggans et al., Reference Wiggans, Cooper, VanRaden and Cole2011a; Tsuruta et al., Reference Tsuruta, Misztal and Lawlor2013). In addition, it is important to control the genetic relatedness among animals in the reference population and between animals in the reference and test populations to control prediction bias (Clark et al., Reference Clark, Hickey, Daetwyler and van der Werf2012; Wu et al., Reference Wu, Lund, Sun, Zhang and Su2015) when additional animals are included in the reference population for genomic evaluation. In order to maximize the accuracy of GEBV when evaluated by including cows in the reference population, it is important to understand how genotyped cows in the reference population affect the genomic evaluation in the point of these factors in our population.
The objective of this study was (i) to evaluate the effect of genotyped cows in the reference population on the accuracy of GEBV under different prediction methods; (ii) to investigate how information on additional cows in the reference population contributes to the prediction accuracy, and how this compares with the inclusion of bulls; and (iii) to investigate the effect of genetic relatedness among bulls and cows on genomic evaluation.
Material and methods
For objective (i), single-step (Aguilar et al., Reference Aguilar, Misztal, Johnson, Legarra, Tsuruta and Lawlor2010) and multi-step methods (VanRaden et al., Reference VanRaden, Van Tassell, Wiggans, Sonstegard, Schnabel, Taylor and Schenkel2009) were used to predict GEBV. For objective (ii), we performed a validation study to compare how the accuracy of GEBV increased by including 800 additional genotyped bulls or cows in the base reference population composed of 2000 genotyped bulls. For objective (iii), we performed a validation study to investigate the effect of genetic relatedness between cows and bulls in the reference and test population on genomic evaluation. We also assessed the effect of genetic relationships among bulls in the reference population. The genomic evaluation was performed using the Japanese Holstein population, and the accuracy of GEBV was assessed for three production traits and 13 conformation traits.
Data
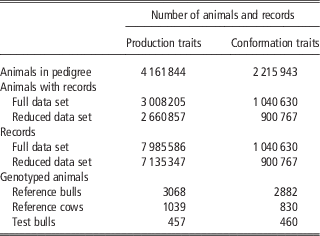
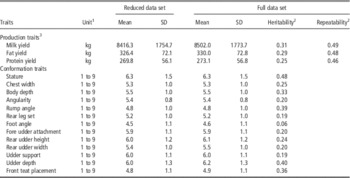
In this study, two data sets were prepared using Japanese Holsteins born between 1977 and 2013, as follows: the full data set contained records up to 2015, and the reduced data set included records up to 2011. The pedigree was traced back four generations for genotype imputation and to create a numerator relationship matrix (NRM) and its inverse matrix for the genotyped animals. Each data set contained three production traits and 13 conformation traits and the records for 305-day production traits from the first to fifth lactation and the record for conformation traits at first lactation were used in this study. For conformation traits, linear type traits were scored from 1 to 9, according to the method detailed in the World Holstein Friesian Federation guidelines (http://www.whff.info/documentation/typeharmonisation.php). Pedigree and records of conformation traits were obtained from the Holstein Cattle Association of Japan (HCAJ), and records of production traits were obtained from the Livestock Improvement Association of Japan. The number of records, animals with records and animals in pedigree in each data set are shown in Table 1, and all traits with the corresponding descriptive statistics are shown in Table 2. For both traits, an adjustment was made for heterogeneous variance by contemporary group (Weigel and Gianola, Reference Weigel and Gianola1993).
Number of animals and records used in this study

Descriptive statistics, heritability and repeatability of production and conformation traits

1 Unit of conformation was scored by linear classification (ranged from 1 to 9) based on body measurement.
2 Standard deviations from the posterior distribution for heritability and repeatability were 0.00 in all traits.
3 The coefficient of determination by the model (2) with only fixed effects were 0.70 in milk yield, 0.74 in fat yield and 0.76 in protein yield in full data set.
In this study, a total of 4564 animals for production traits and 4172 animals for conformation traits were genotyped using an Illumina BovineSNP50 array (Table 1). Genotyped data were obtained from the HCAJ. The Missing genotypes were imputed by FIMPUTE software (Sargolzaei et al., Reference Sargolzaei, Chesnais and Schenkel2014), and autosomal chromosomes were used. The quality of single nucleotide polymorphisms (SNPs) was assessed by PLINK software (Purcell et al., Reference Purcell, Neale, Todd-Brown, Thomas, Ferreira, Bender, Maller, Sklar, de Bakker, Daly and Sham2007). The exclusion criteria were as follows: minor allele frequency <0.01, call rate <0.95, and Hardy–Weinberg equilibrium test P-value <0.001. After quality control, 42 532 SNPs for production traits and 42 568 SNPs for conformation traits were used for genomic evaluation.
Heritability and repeatability estimation
To estimate heritability and repeatability using the full data set, two models were used to estimate variance components of production and conformation traits. For conformation traits, the single-trait animal model was applied as follows:
 $${\bf y}\,{\equals}\,{\bf Xb}{\plus}{\bf Z}_{{\bf 1}} {\bf u}{\plus}{\bf e}$$
where, y is the vector of observations for conformation traits, X and Z
1
the design matrices for fixed and random effects, respectively. b the estimates of the discrete effects of herd-classifier-date at classification (153 727 levels), the age at classification (47 levels) and lactation stage at classification (12 levels) as fixed effects. u and e the random effects due to breeding value with
 $${\bf u}\,\sim\,N(0,{\bf A}\sigma _{u}^{2} )$$
and residual effect with
 $${\bf e}\,\sim\,N(0,{\bf I}\sigma _{e}^{2} )$$
.
 $$\sigma _{u}^{2} $$
and
 $$\sigma _{e}^{2} $$
represent additive genetic and residual variance, respectively, and A and I are NRM and identity matrix, respectively.
For production traits, a single-trait repeatability animal model was applied to consider multiple lactations as follows:
 $${\bf y}\,{\equals}\,{\bf Xb}{\plus}{\bf Z}_{{\bf 1}} {\bf u}{\plus}{\bf Z}_{{\bf 2}} {\bf pe}{\plus}{\bf e}$$
where, y is the vector of observation for 305-day yields in the first five parities, Z
2
the design matrix for random effects, b represents estimates of the discrete effects of herd-calving year-parity-milking frequency (575 129 levels), calving month-year-regional block (648 levels) and calving age (47 levels) as fixed effects, and pe the permanent environmental effect for cow with
 $${\bf pe}\sim N(0,{\bf I}\sigma _{{pe}}^{2} )$$
.
 $$\sigma _{{pe}}^{2} $$
is the permanent environmental variance.
Variance components were estimated by Bayesian estimation using the Gibbs sampling method in GIBBS1f90 software (Misztal et al., Reference Misztal, Aguilar, Legarra and Lawlor2002). Prior distributions were flat for the fixed effects and normal for the animal and permanent environmental effects. The number of iterations was set to 100 000 with the first 50 000 iterations discarded as burn-in. Estimates of the variance components and their uncertainty were obtained as posterior means and standard deviations of 50 000 samples, respectively. Convergence was determined from a visual inspection of the plotting of Gibbs sampling. The heritabilities and repeatabilities were estimated from full data (Table 2), and these were used in genetic and genomic analyses.
Single-step method
The single-step genomic BLUP approach (Aguilar et al., Reference Aguilar, Misztal, Johnson, Legarra, Tsuruta and Lawlor2010) was applied in this study. Equation (1) for conformation traits and equation (2) for production traits with the reduced data set were used, but the inverse of NRM A was replaced by the inverse of matrix H in the mixed model equations. The inverse of matrix H is as follows:
 $${\bf H}^{{{\minus}{\bf 1}}} \,{\equals}\,{\bf A}^{{{\minus}{\bf 1}}} {\plus}\left[ {\matrix{ 0 & 0 \cr 0 & {\tau (\alpha {\bf G}{\plus}\beta {\bf A}_{{{\bf 22}}} )^{{{\minus}1}} {\minus}\omega {\bf A}_{{{\bf 22}}}^{{{\minus}{\bf 1}}} } \cr } } \right]$$
where
 $${\bf A}_{{{\bf 22}}}^{{{\minus}{\bf 1}}} $$
is the inverse of NRM for genotyped animals; G the genomic relationship matrix (GRM) proposed by VanRaden (Reference VanRaden2008) and is calculated as follows:
 $${\bf G}\,{\equals}\,{{{\bf WW'}} \over {2\mathop{\sum}\limits_{j\,{\equals}\,1}^m {p_{j} (1{\minus}p_{j} )} }}$$
where m is the number of SNPs, p j the frequency of the second allele of the jth SNP and the frequency of the second allele was calculated using all genotyped animals in each study, and the elements of W are calculated as follows:
 $$w_{{ij}} \,{\equals}\,x_{{ij}} \,{\minus}\,2p_{j} $$
where x ij is the number of the second allele of the ith animal at the jth SNP. α, β, ω and τ are weighting factors. The weighting factors α and β, which can avoid singularity problems, were selected as 0.95 and 0.05, respectively (VanRaden, Reference VanRaden2008). The weighting factors ω and τ, which can reduce bias in GEBV, were selected as 0.5 and 1.0, respectively (Misztal et al., Reference Misztal, Tsuruta, Strabel, Auvray, Druet and Lee2010). The prediction value, u, in the equations (1) and (2), which was GEBV, was estimated using BLUPF90 software (Misztal et al., Reference Misztal, Aguilar, Legarra and Lawlor2002).
Multi-step method
The selection index approach (VanRaden et al., Reference VanRaden, Van Tassell, Wiggans, Sonstegard, Schnabel, Taylor and Schenkel2009) was applied in this study. This approach is composed of three steps: the first step calculates the deregressed proof (DRP) of reference animals; the second step predicts direct genomic value (DGV); the third step calculates GEBV.
In the initial step, EBV was calculated using equation (1) for conformation traits and equation (2) for production traits with the reduced data set. EBV of genotyped animals was then deregressed Mendelian term according to the method which was used in a similar form of deregression procedure described by VanRaden et al. (Reference VanRaden, Van Tassell, Wiggans, Sonstegard, Schnabel, Taylor and Schenkel2009), Schopen and Schrooten (Reference Schopen and Schrooten2013) and Weller et al. (Reference Weller, Stoop, Eding, Schrooten and Ezra2015) as follows:
 $${\rm DRP\,{\equals}\,PA{\plus}(EBV}\,{\minus}\,{\rm PA){\times}}{{{\rm EDC}_{{{\rm EBV}}} } \over {{\rm EDC}_{{{\rm EBV}\,{\minus}\,{\rm PA}}} }}$$
where, DRP is deregressed EBV, PA the parent average EBV and EDCEBV is the effective daughter contribution (EDC) of EBV. EDCEBV–PA was calculated as
 $$EDC_{{EBV\,{\minus}\,PA}} \,{\equals}\,EDC_{{EBV}} \,{\minus}\,EDC_{{PA}} $$
where EDCPA is the EDC for sum of parents. EDCEBV and EDCPA were calculated as
 $${\rm EDC}_{{{\rm EBV}}} \,{\equals}\,{{\lambda r_{{{\rm EBV}}}^{2} } \over {1{\minus}r_{{{\rm EBV}}}^{2} }}$$
 $${\rm EDC}_{{{\rm PA}}} \,{\equals}\,{{\lambda r_{{{\mathop{\rm PA}\nolimits} }}^{2} } \over {1{\minus}r_{{{\rm PA}}}^{2} }}$$
where
 $$r_{{{\rm EBV}}}^{2} $$
is the reliability of EBV,
 $$r_{{{\rm PA}}}^{2} $$
the reliability of PA EBV, and
 $\lambda \,{\equals}\,{{4{\minus}h^{2} } \over {h^{2} }}$
, where h
2 is the heritability of the trait. The reliability of all animals in the pedigree was estimated using the method described by Liu et al. (Reference Liu, Reinhardt, Bünger and Reents2004).
In the second step, the DGV was predicted by GBLUP using DRP as calculated in the first step. The DRP for cows was scaled to have the same mean and variance as bulls’ DRP as described by Wiggans et al. (Reference Wiggans, Cooper, VanRaden and Cole2011a). The model used to predict DGV was as follows:
 $${\bf y}_{{{\bf DRP}}} \,{\equals}\,{\bf 1}_{{\bf n}} \mu {\plus}{\bf Zg}_{{\bf 1}} {\plus}{\bf Zg}_{{\bf 2}} {\plus}{\bf e'}$$
where, y
DRP
is a vector of DRP, 1
n
the vector of n ones, n the number of genotyped animals, μ the mean, g
1
the DGV of genotyped animals with
 $${\bf g}_{1} \sim N(0,{\bf G{\asterisk}}(b\sigma _{g}^{2} ))$$
, and g
2
the effect of family relatedness with
 $${\bf g}_{{\bf 2}} \sim N(0,{\bf A}_{{{\bf 22}}} \{ (1{\minus}b)\sigma _{g}^{2} \} )$$
. The b is the weighting factor, which can account for family relatedness. In preliminary analysis, the realized reliability and regression coefficient of DGV and GEBV for milk yield were calculated by changing the weighting factor of b from 0.10 to 1.00. In that case, the highest realized reliability of DGV and GEBV was obtained when the weighting factor of b was 0.90 (see Supplementary Table S1). Therefore, the weighting factor of b was selected as 0.90 in this study. G* was G*=
α
G +
β
A
22
, and the weighting factors of α and β were selected as 0.95 and 0.05, respectively (VanRaden, Reference VanRaden2008). A
22
is NRM for genotyped animals. e' is the residual effect with
 $${\bf e'}\sim N(0,{\bf D}\sigma _{{e'}}^{2} )$$
.
 $$\,\,\sigma _{{e'}}^{2} $$
is the residual variance, and D is a diagonal matrix, which has ith diagonal element
 $$d_{{ii}} \,{\equals}\,{{1\,{\minus}\,r_{{{\rm DRP}}}^{2} } \over {r_{{{\rm DRP}}}^{2} }}$$
, to account for heterogeneous residual variances due to different reliabilities of DRP (
 $$r_{{{\rm DRP}}}^{2} $$
). The reliability of DRP for bulls and cows was computed from EDC after removing the parental contribution (i.e. EDCEBV–PA). D accounts for heritability and differences in daughter numbers, and the ratio
 $${{\sigma _{{e'}}^{2} } \over {\sigma _{g}^{2} }}$$
was simplified to 1 (VanRaden, Reference VanRaden2008) because the value of ratio did not affect the estimation of DRP.
In the third step, GEBV was calculated using the selection index approach based on the method described by VanRaden et al. (Reference VanRaden, Van Tassell, Wiggans, Sonstegard, Schnabel, Taylor and Schenkel2009) as follows:
 $${\rm GEBV}_{{{\rm (M)}}} \,{\equals}\,w_{1} {\rm DGV}{\plus}w_{2} {\rm subsetPA}{\plus}w_{3} {\rm PA}$$
where subsetPA is the parent average EBV calculated from the genotyped animals in the reference population and PA the parent average EBV calculated from all animals in pedigree. The scaling factors w 1 , w 2 and w 3 were calculated as
 $$\left[ {\matrix{ {w_{1} } & {w_{2} } & {w_{3} } \cr } } \right]{\equals}\,\left[ {\matrix{ {V_{{11}} } & {V_{{22}} } & {V_{{33}} } \cr } } \right]\left[ {\matrix{ {V_{{11}} } & {V_{{12}} } & {V_{{13}} } \cr {V_{{12}} } & {V_{{22}} } & {V_{{23}} } \cr {V_{{13}} } & {V_{{23}} } & {V_{{33}} } \cr } } \right]^{{{{\!}{\!}\minus}1}} $$
where V
11
, V
22
and V
33
are the reliabilities of DGV, subsetPA and PA, respectively, and
 $$V_{{12}} \,{\equals}\,V_{{22}} $$
,
 $$V_{{23}} \,{\equals}\,V_{{22}} $$
and
 $$V_{{13}} \,{\equals}\,V_{{22}} {\plus}{{(V_{{11}} \,{\minus}\,V_{{22}} )(V_{{33}} \,{\minus}\,V_{{22}} )} \over {1\,{\minus}\,V_{{22}} }}$$
are defined. The reliabilities of subsetPA and PA were estimated according to Liu et al. (Reference Liu, Reinhardt, Bünger and Reents2004), and that of DGV was estimated using the Monte Carlo sampling methods described by Hickey et al. (Reference Hickey, Veerkamp, Calus, Mulder and Thompson2009).
Validation of genomic evaluation
The genotyped animals were classified into reference animals and test animals. In the reference population, the genotyped bulls have at least 20 daughters with records in the reduced data set, and the genotyped cows have at least one record in the reduced data set. The test population was comprised of genotyped bulls, which were born between 2008 and 2010, had at least 20 daughters with records in the full data set, and had no daughters in the reduced data set. The numbers of genotyped bulls and cows in the reference and the test populations are shown in Table 1.
To evaluate the accuracy of genomic evaluation, the realized reliability and regression coefficient were calculated using a regression model as suggested by Mäntysaari et al. (Reference Mäntysaari, Liu and VanRaden2010) as
 $${\rm DRP}_{{{\rm TST}}} \,{\equals}\,b_{0} {\plus}b_{1} {\times}{\rm PV}{\plus}e$$
where DRPTST is the DRP of test bulls. The DRP of test bull was calculated by applying the iterative procedure described in Jairath et al. (Reference Jairath, Dekkers, Schaeffer, Liu, Burnside and Kolstad1998), which can reduce the contribution of PA on DRP compared with VanRaden et al. (Reference VanRaden, Van Tassell, Wiggans, Sonstegard, Schnabel, Taylor and Schenkel2009), and all bulls with non-zero reliability in pedigree were used in the calculation. The reliability of the DRPTST was computed from EDC calculated using Interbull recommendations (Fikse and Banos, Reference Fikse and Banos2001). PV is an independent variable of the prediction value (i.e. PA or GEBV), and e is the residual value. b 0 is the intercept and b 1 is the regression coefficient, which is the indicator of prediction bias and is expected to be 1. The realized reliability was calculated by dividing the coefficient of determination (R 2) from equation (3) by the average reliability of the DRPTST. The 95% bootstrap confidence intervals were estimated for the regression coefficient and the realized reliability by the boot package for the R software (http://www.r-project.org) (Koivula et al., Reference Koivula, Strandén, Pösö, Aamand and Mäntysaari2015). The number of bootstrap samples was 10 000 and confidence intervals by the basic method were given.
Effect of genotyped cows under different factors
To assess the effect of genotyped cows in the reference population on the reliability and prediction bias under different methods, we used single-step and multi-step genomic evaluation methods with genotyped bulls as reference animals (bull-only reference population) and genotyped bulls and genotyped cows as reference animals (bull-cow reference population). The number of animals used in the bull-only and bull-cow reference populations were 3068 and 4107 animals for production traits, and 2882 and 3712 animals for conformation traits, respectively (Table 1). The differences in the realized reliability and regression coefficients between the two reference populations were compared in each method.
To investigate the different contributions of genotyped bulls and cows in the reference population to the prediction accuracy, we performed a validation study using a single-step method for all traits, and calculated the realized reliability and regression coefficient. We evaluated how the accuracy of GEBV increases when including genotyped bulls or cows in the reference population. A total of 2000 bulls were initially selected from all genotyped bulls at random, and the population was regarded as the base reference population (POPbase). Another 800 bulls or 800 cows were then randomly selected from the remaining genotyped animals and added in POPbase. These populations were also regarded as reference populations and named as POPbull and POPcow, respectively. This was replicated 100 times to calculate the realized reliability and regression coefficient in test bulls in Table 1, and the mean and SD of 100 replicates were then calculated for each result of the reference population. We compared the difference of the prediction accuracy among POPbase, POPbull and POPcow.
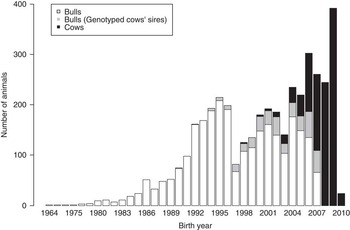
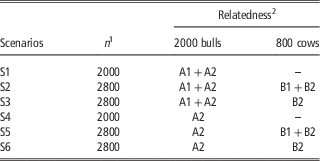
To evaluate the effect of genetic relatedness of genotyped cows on prediction accuracy, the effect of the genetic relatedness between genotyped cows and bulls in the reference and the test populations was assessed. To evaluate these relationships, four measures of relatedness were considered: (A1) 335 bulls that have a daughter in reference cows; (A2) 2733 bulls that have no daughter in reference cows; (B1) 80 cows that have a son in test bulls; (B2) 959 cows that have no son in test bulls. The number of animals was for production traits. A total of 2000 bulls and an additional 800 cows accounted for the relatedness were regarded as the reference animals. Six scenarios (S1 to S6) were defined to account for the relatedness, and they are shown in Table 3. The six sets of scenarios could be classified into two bull groups. Scenarios S1 to S3 include bulls that are sires of reference cows, and scenarios S4 to S6 include bulls that are non-sires of reference cows. These scenarios can also be classified into two cow groups. Scenarios S2 and S5 include cows that are dams of test bulls and scenarios S3 and S6 include cows that are non-dams of test bulls. For the scenarios including (A1) and (B1), all animals of (A1) and (B1) were included, and the remaining animals were randomly selected from (A2) and (B2) to obtain 2000 bulls and 800 cows, respectively. We performed a validation study using a single-step method for milk yield, which was replicated 100 times to select the reference animals. In each replicate, we calculated the realized reliability and regression coefficient in test bulls in Table 1 under different conditions of genetic relatedness, and the mean and SD of 100 replicates were calculated. In addition, we also evaluated the effect of the genetic relationship among bulls in the reference population. We calculated the realized reliability and regression coefficient for milk yield in test bulls in Table 1 using a single-step method under three reference populations; OLD, the reference population composed of the first 2000 older bulls; YOUNG, the reference population composed of the first 2000 younger bulls; UNRELATED, the reference population composed of the first 2000 most unrelated bulls. For UNRELATED, the animals with larger absolute values of off-diagonal elements in GRM were excluded, in order to exclude close relatives, until 2000 bulls remained. The remaining 2000 bulls, which had minimum genetic relationship among bulls in our population, were then used as the reference animals. The 2000 reference animals were chosen from 3068 genotyped bulls, and 905 bulls were overlapped among OLD, YOUNG and UNRELATED. The distribution of reference animals per birth year for production traits is shown in Figure 1.
Distribution of reference animals for production traits. The x-axis indicates birth year of animals, and the y-axis represents the number of animals.

Definition of different genetic relatedness in the reference population

1 Total number of genotyped animals in the reference population.
2 The relatedness defined as: (A1) 335 bulls that have a daughter in reference cows; (A2) 2733 bulls that have no daughter in reference cows; (B1) 80 cows that have a son in test bulls; (B2) 959 cows that have no son in test bulls. The number of animals was for production traits.
Results
Prediction methods
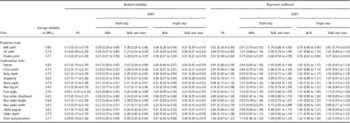
For objective (i), we assessed the effect of including genotyped cows in the reference population on the genomic evaluation under different methods. Average reliabilities of DRPTST are shown in Table 4 for each trait, and they ranged from 0.77 to 0.80 for production traits and from 0.35 to 0.83 for conformation traits. Reliability of DRPTST followed similar trends as the heritabilities for traits (the traits with higher heritability had higher reliability). The realized reliability and regression coefficient of PA and GEBV determined by single-step and multi-step methods are shown in Table 4 for each trait. The realized reliability for PA were lower than those for GEBV in all traits. For GEBV, there were no large differences in the realized reliability and regression coefficient between bull-only and bull-cow reference populations in our population. However, there was a slightly different trend between the two methods, especially for production traits. For fat yield and protein yield, the realized reliability and regression coefficient of the bull-cow reference population were increased slightly compared with those of the bull-only reference population in GEBV determined by the single-step method. Conversely, the realized reliability and regression coefficient of the bull-cow reference population was decreased slightly compared with those of the bull-only reference population in GEBV determined by the multi-step method. For example, for fat yield, the realized reliabilities of bull-only and bull-cow reference populations when using the single-step method were 0.35 and 0.36, respectively, but those obtained by the multi-step method were 0.36 and 0.31, respectively. The regression coefficients for bull-only and bull-cow reference populations using the single-step method were 1.01 and 1.01, respectively, but those determined by the multi-step method were 1.01 and 0.90, respectively.
A comparison of different methods for prediction accuracy of parent average (PA) and genomic enhanced breeding value (GEBV)Footnote 1

DRPTST=deregressed proof of test animals.
1 95% bootstrap confidence interval are shown in parentheses.
Genotyped bull and cow information
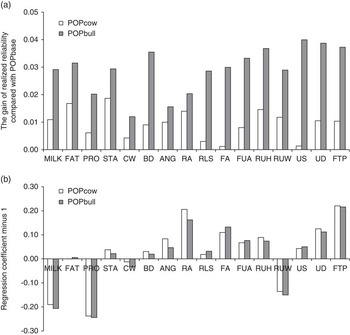
For objective (ii), we evaluated how bulls and cows included in a reference population contributed to the accuracy of GEBV. In a validation study, 800 bulls or 800 cows were randomly selected and added to the base reference population composed of 2000 bulls. The realized reliability and regression coefficient determined by the single-step method for three reference populations (POPbase, POPbull and POPcow) are shown in Supplementary Table S2 for each trait. The realized reliability gains from POPbull and POPcow compared with POPbase are shown in Figure 2. The regression coefficient −1 for the results of POPbull and POPcow are also shown in Figure 2. The results of the realized reliability and regression coefficient followed a different trend. The realized reliabilities of POPbull were higher than those of POPcow in all traits. For the realized reliability gain over POPbase, the average ratios of POPbull gain to POPcow gain for production and conformation traits were 2.6 (ranging from 1.9 for fat yield to 3.3 for protein yield) and 7.2 (ranging from 1.5 for rump angle to 29.9 for udder support), and a different ratio among traits was found for conformation traits. There was no large difference in the results of the regression coefficient between POPbull and POPcow.
Comparison of the realized reliability and regression coefficient for each trait based on different reference data sets in the validation study. (a) The gain of realized reliability from a 2800-bull reference data set (POPbull) and a 2000-bull and 800-cow reference data set (POPcow) compared with a 2000-bull reference data set (POPbase) are shown. (b) The regression coefficient −1 for the results of POPbull and POPcow are shown. MILK=milk yield; FAT=fat yield; PRO=protein yield; STA=stature; CW=chest width; BD=body depth; ANG=angularity; RA=rump angle; RLS=rear leg set; FA=foot angle; FUA=fore udder attachment; RUH=rear udder height; RUW=rear udder width; US=udder support; UD=udder depth; FTP=front teat placement.

Genetic relatedness
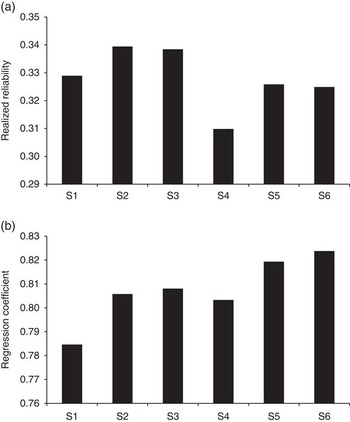
For objective (iii), we evaluated the effect of the genetic relatedness of genotyped cows on genomic evaluation by the single-step method for milk yield. For the genetic relatedness of genotyped cows with bulls in the reference population and bulls in the test population, the realized reliability and regression coefficient under six sets of scenarios are shown in Figure 3. The realized reliability and regression coefficient, including cows in the reference population (S2 to S3 and S5 to S6) were higher than those of the bull reference only (S1 and S4, respectively). For the two cow groups, the difference in the results between S2 and S3 and between S5 and S6 were almost the same for the realized reliability and regression coefficient. However, different results were found between the two bull groups. The realized reliabilities of S1 (0.33), S2 (0.34) and S3 (0.34) were higher than those of S4 (0.31), S5 (0.33) and S6 (0.33), respectively. However, the regression coefficients of S1 (0.79), S2 (0.81) and S3 (0.81) were lower than those of S4 (0.80), S5 (0.82) and S6 (0.82), respectively.
Comparison of the realized reliability and regression coefficient for milk yield under six different scenarios. (a) Realized reliability and (b) regression coefficient are shown. The different scenarios are based upon different levels of genetic relatedness between genotyped cows and bulls in the reference population and bulls in the test population. Six sets of scenarios (S1 to S6) are defined in Table 3. SDs of 100 replicates for six scenarios is about 0.01 for realized reliability and about 0.02 for regression coefficient.

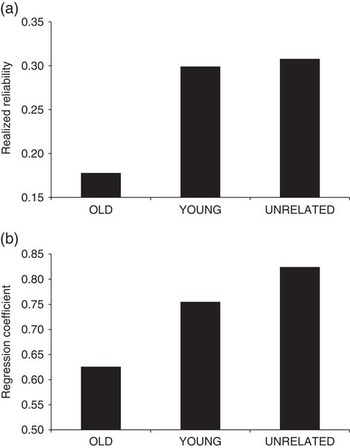
We also evaluated the effect of genetic relatedness among bulls in the reference population. The realized reliability and regression coefficient for three reference populations (OLD, YOUNG and UNRELATED) are shown in Figure 4. The realized reliability and regression coefficient for OLD were lower than those for YOUNG and UNRELATED. The realized reliability of YOUNG was almost similar to that of UNRELATED (0.30 and 0.31, respectively). However, the regression coefficient of YOUNG was lower than that of UNRELATED (0.76 and 0.82, respectively).
Comparison of the realized reliability and regression coefficient for milk yield based on different reference populations in terms of relationship among reference bulls. (a) Realized reliability and (b) regression coefficient are shown. OLD, the reference population based on the first 2000 older bulls; YOUNG, the reference population based on the first 2000 younger bulls; UNRELATED, the reference population based on the first 2000 most unrelated bulls. The 95% bootstrap confidence interval for OLD, YOUNG and UNRELATED were 0.10 to 0.24, 0.22 to 0.37 and 0.22 to 0.39 in realized reliability, and 0.49 to 0.76, 0.63 to 0.87, 0.70 to 0.85 in regression coefficient, respectively.

Discussion
Prediction methods
The advantages of the single-step method are to avoid bias from preselection of genotyped animals, to allow only one calculation, and to allow direct comparison of genotyped and non-genotyped animals (Aguilar et al., Reference Aguilar, Misztal, Johnson, Legarra, Tsuruta and Lawlor2010; Legarra et al., Reference Legarra, Christensen, Aguilar and Misztal2014). On the other hand, the multi-step method has the flexibility to use prediction methods such as Bayesian methods and could easily use EBV from multi-trait across-country evaluation in the reference population including genotyped foreign bulls. Some studies have compared the single-step and multi-step methods (Su et al., Reference Su, Madsen, Nielsen, Aamand, Wiggans, Guldbrandtsen and Lund2012; Lourenco et al., Reference Lourenco, Misztal, Tsuruta, Aguilar, Ezra, Ron, Shirak and Weller2014). However, few studies have compared the results obtained with and without genotyped cows analyzed by both single-step and multi-step methods. The inclusion of genotyped cows in the multi-step method might decrease the accuracy of GEBV and increase bias when compared with other prediction methods (Wiggans et al., Reference Wiggans, Cooper, VanRaden and Cole2011a). Conversely, the use of cow genotypes in the single-step method could increase prediction accuracy and reduce bias (Tsuruta et al., Reference Tsuruta, Misztal and Lawlor2013). Our results followed a similar trend, and showed that the prediction methods affect the accuracy of GEBV when information on the genotypes of cows are included. For the multi-step method, GEBV including genotyped cows in the reference population could reduce the reliability and increase prediction bias compared with GEBV predicted using only the bull reference. The decreased reliability of GEBV prediction could be from the noise in deregression procedure. In using genotyped cows as reference animals, the multi-step method has to rely on the accuracy of the estimates of cows’ EDC and DRP. By contrast, the single-step method works directly with original measured values (not DRP), and decreasing of reliability was not manifested. Therefore, our results showed that using GEBV by the single-step method as a predictor is more realistic and could be effective in genomic evaluation for all traits, when including cow genotype information.
Genotyped bull and cow information
To determine the contribution of bulls and cows to genomic analyses, the design of quantitative trait loci analysis was first investigated. For this, one-quarter of the total number of genotyped animals are required in the granddaughter design (including genotyped sires with no record) compared with the daughter design (including genotyped granddaughters with records) (Weller et al., Reference Weller, Kashi and Soller1990). Recently, the contribution of bulls and cows to the reliability of genomic evaluation was reported. de Roos (Reference de Roos2011) described that the number of reference cows (n c ), which is equal to one reference bull with n d daughters, could deterministically calculate with heritability (h 2) as follows:
 $$n_{c} \,{\equals}\,{{n_{d} } \over {(n_{d} \,{\minus}\,1)h^{2} {\plus}4}}$$
For example, approximately seven, three and two cows should be added to a reference population to contribute to the reliability in an equal manner as one bull with 100 daughters for traits with heritabilities of 0.1, 0.3 and 0.5, respectively. Therefore, the contribution of bulls and cows in the reference population to the reliability depends on the number of bull’s daughters and on the heritability of the trait. Our results showing the bull and cow contributions followed a similar trend using this formula. For the realized reliability gains from POPbull and POPcow compared with POPbase for conformation traits, the two lowest ratios were 1.5 and 1.6, and the heritabilities were 0.39 and 0.48 for rump angle and stature, respectively. Conversely, the two highest ratios were 29.9 and 25.8, and the heritability was 0.19 and 0.06 for udder support and foot angle, respectively. Therefore, our results showed that the difference in the results between the additional bulls and cows increased as the heritability decreased.
In our study, the realized reliabilities of POPbull were higher than those of POPcow for all traits when 800 bulls or 800 cows were included in the 2000-bull reference population. On the other hand, inclusion of cows in the reference population did not have a large benefit on genomic evaluation (see Table 4) when the bull-only (3068 animals for production traits and 2882 animals for conformation traits) and bull-cow populations (4107 animals for production traits and 3712 animals for conformation traits) were used as the reference population. In general, the inclusion of cows in the reference population greatly benefits small bull reference populations, but may not be of benefit in the large bull reference population (Cooper et al., Reference Cooper, Wiggans and VanRaden2015; Su et al., Reference Su, Madsen, Nielsen, Mäntysaari, Aamand, Christensen and Lund2016). For example, the inclusion of ~4800 cows in the base reference population (about 1250 bulls) increased reliability by 8.2% for test bulls (Su et al., Reference Su, Madsen, Nielsen, Mäntysaari, Aamand, Christensen and Lund2016). On the other hand, the inclusion of ~31 000 cows in the base reference population (about 22 000 bulls) slightly increased reliability by 0.4% for test bulls (Cooper et al., Reference Cooper, Wiggans and VanRaden2015). In our study, the number of cows included in the reference population was limited by the limited genotyping of cows at this time in Japan, and the accuracy would not plateau at the size of this population. In general, the accuracy of GEBV could increase as the size of the reference population increased to at least 10 000 bulls (Lund et al., 2011; Wiggans et al., Reference Wiggans, VanRaden and Cooper2011b). Therefore, further study is needed to increase the prediction accuracy by including additional animals in the reference population. In that case, the composition of the reference population (bull-only or bull-cow) must be considered. In addition, a large number of cows would be needed as compared with bulls when including cows in the reference population.
Genetic relatedness
In this study, two cow groups (dams and non-dams of test bulls) were defined in order to evaluate the effect of genetic relationships between cows and test bulls. In our population, the number of cows that were dams of test bulls was 80 for the relatedness (B1), and 99 bulls in the test population (457 test bulls) were their sons. The results revealed no large difference in the results between the two cow groups. In terms of the genetic relatedness between bulls in the test and the reference populations, some studies have shown an increase in reliability with increasing relationships between reference and test bulls (Clark et al., Reference Clark, Hickey, Daetwyler and van der Werf2012; Wu et al., Reference Wu, Lund, Sun, Zhang and Su2015). For the genetic relatedness between cows in reference population and bulls in test population, Wiggans et al. (Reference Wiggans, Cooper, VanRaden and Cole2011a) showed that the inclusion of cows could decrease the reliability. This is because cows selected for genotyping could have potential for a high genetic evaluation, and thus, potential dams of test bulls have been selected for genotyping. In our study, no difference in the reliability and prediction bias between dams and non-dams of test bulls was found. The small number of test bulls’ dams available in this study could not explain the significant effect of the genetic relationship between cows and test bulls, and a larger sample size of test bulls’ dams was needed to evaluate their effect.
In this study, we defined two bull groups (sires and non-sires of reference cows) to evaluate the effect of genetic relationships between cows and bulls in the reference population. The number of bulls that were sires of reference cows was 335 for the relatedness (A1), and 951 cows in the reference population (1039 cows) were their daughters. The results showed that using sires of reference cows as the reference led to higher reliability but higher prediction bias than when using non-sires’ bulls as the reference in our population. The effect of genetic relatedness among bulls in the reference population was evaluated to determine the reason for this result. In our population, most of the reference cows’ sires were relatively young bulls in the reference population, because all genotyped cows were born after 2000 (see Figure 1). Therefore, we defined three reference populations (OLD, YOUNG and UNRELATED). Our results revealed lower reliability and higher prediction bias for OLD than for YOUNG, and a higher prediction bias for YOUNG was shown over UNRELATED. The sires of reference cows were relatively younger than non-sires’ bulls, and thus a higher reliability was obtained. Conversely, most of the reference cows’ sires were born in specific years; therefore, there was a closer relatedness among the reference cows’ sires than among non-sires’ bulls. Therefore, higher prediction bias for sires of reference cows was shown in our population. Wu et al. (Reference Wu, Lund, Sun, Zhang and Su2015) studied the effect of genetic relatedness among bulls in the reference population, and reported that a close relationship among animals within the reference population is unfavorable for reliability. Our results followed a similar trend, and higher reliability and lower prediction bias of GEBV were obtained when unrelated bulls were selected within the reference population. In this study, the realized reliability of scenario S1 was higher than scenario S4 and UNRELATED, which had the same number of reference bulls. In scenario S1, some of bulls were sires of reference cows and relatively younger than non-sires’ bulls. In addition, the other reference bulls were randomly selected from non-sires of reference cows. Therefore, our results indicated that it would be better to choose younger bulls which are unrelated among bulls in reference population in the design of genomic evaluation.
In our study of milk yield using the single-step method, the realized reliability and the regression coefficient using 2000 UNRELATED bulls in the reference population were 0.31 and 0.82, respectively (see Figure 4). On the other hand, the realized reliability and regression coefficient using all 3068 bulls in the reference population were 0.36 and 0.79, respectively (see Table 4). In our population, the reliability increased as the size of the reference population increased. However, the prediction bias did not follow this trend, and unrelated animals in the reference population would be preferable to obtain a lower prediction bias of GEBV. Official implementation of genomic evaluation in Japan usually utilizes all genotyped animals as the reference population to obtain higher reliability of GEBV. Thus, it is difficult to select animals to account for the genetic relationship in the reference population. Therefore, further work is needed to develop a new prediction method to obtain both higher reliability and lower prediction bias of GEBV.
Conclusions
In the present study, we evaluated the effect of genotyped cows within the reference population on genomic evaluation in order to maximize the prediction accuracy. The use of GEBV by the single-step method would be preferable as a predictor in genomic evaluation when genotyped cows are included in the reference population. In terms of the contribution of bulls and cows to the prediction accuracy, the inclusion of bulls in the reference population provided a larger benefit to the prediction accuracy than did the inclusion cows in our population if the size of the reference population is relatively small. An effect of genetic relationship between reference cows and test bulls was not shown in our study. However, it is important to account for relatedness among bulls in the reference population in genomic evaluation. This information could be useful for including cows in the reference population.
Acknowledgements
The cooperation of the Holstein Cattle Association of Japan and the Livestock Improvement Association of Japan in supplying pedigree, phenotypic data and genotypic data is acknowledged.
Supplementary Material
To view supplementary material for this article, please visit http://dx.doi.org/10.1017/S1751731116001762