


1. Introduction
A series of atmospheric thermonuclear tests during the period 1953–80, mostly in the Northern Hemisphere, has injected large quantities of artificial radionuclides into the upper atmosphere and stratosphere. These radionuclides have been transported from their sources over Antarctica. During their transport, they are subject to usual removal processes. Because of the well-known arrival dates, they serve as characteristic reference levels in snow and are currently used in glaciological studies to determine the average rate of snow accumulation over the last 40 years. The artificial and natural radionuclides present in the ice sheets of the polar regions have also been widely used as atmospheric tracers to understand the transport and circulation of continental, tropospheric and stratospheric air masses (Reference Wilgain,, Picciotio, and Breuck.Wilgain and others, 1965; Reference Feely,, Seitz,, Lagomarsino, and Biscaye,Feely and others, 1966).
The behavior of fission products depends upon the latitude, the altitude and the season when they were released. Fission products introduced into the equatorial stratosphere spread rapidly in their latitudinal band of injection but migrate slowly towards the pole (Reference Picciotto, and Wilgain,Picciotto and Wilgain, 1963).
The concentration of these artificially produced radionuclides in Antarctic and sub-Antarctic areas is controlled by their long-range transport from mid-latitudes. For tropospheric transport, a 30 day transit time of the air masses from distant continental regions to the South Pole has been suggested by Reference Maenhaut,, Zoller, and Coles,Maenhaut and others (1979).
Thus, the use of airborne radionuclides as atmospheric tracers had been demonstrated (Reference Junge,Junge, 1963; Reference Rama.Rama, 1963; Reference Lambert,, Ardouin,, Nezami, and Polian,Lambert and others, 1966, Reference Lambert,, Ardouin, Mesbah-Bendezu, Pruppacher,, Semonin, and Slinn,1983; Reference Kolb,Kolb, 1970; Reference Luyanas,, Yasyulyonis,, Shopauskiene, and Styra,Luyanas and others, 1970; Reference Poet,, Moore, and Martell,Poet and others, 1972; Reference Telegadas,Telegadas, 1972; Reference Moore,, Poet, and Mattell,Moore and others, 1973; Reference Reiter,Reiter, 1978; Reference Maenhaut,, Zoller, and Coles,Maenhaut and others, 1979). However, after reaching Antarctica, the process of deposition or fall-out of these radionuclides is not uniform and the factors controlling their deposition or spatial distribution and the roles of accumulation, wind and local topographic conditions are not completely understood.
In recent years, studies have been made to elucidate the spatial and temporal variation of snow accumulation and their dependence on temperature, altitude, distance to the coast (Reference Young,, Pourchet,, Kotlyakov,, korolev and Dyurgerov,Young and others, 1982; Reference Pettre,, Pinglot,, Pourchet, and Reynaud,Pettre and others, 1986; Reference Giovinetto,, Waters, and Bentley,Giovinetto and others, 1990; Reference Goodwin,Goodwin, 1991) as well as the effect of katabatic wind and cyclonic activity on snow accumulation (Reference Goodwin,Goodwin, 1990; Reference Morgan,, Goodwin,, Etheridge, and Wookey,Morgan and others, 1991). The sparse data for specific radionuclides have restricted studies to determine their detailed spatial variations and to examine factors responsible for these v ariations such as processes of deposition (dry or wet). Existing mapping of radionuclide fall-out over Antarctica and studies related to spatial correlations can still be considered as preliminary. The present paper aims to give a comprehensive view of the distribution pattern for natural and artificial radionuclides over Antarctica. An attempt has also been made to compute the total budget of 137Cs fall-out, from 1955 to 1980.
2. Material and Methods
After melting and filtration (Reference Delmas, and Pourchet,Delmas and Pourchet, 1977), snow samples obtained from different stations in Antarctica (Fig. 1) have been analysed for total beta activity over several years using low-level counting equipment (Reference Pinglot, and Pourchet,Pinglot and Pourchet, 1979). The filters were later combined together for each station. They were then analysed by gamma spectrometry using a specially designed low-background scintillation detector (Reference Pinglot, and Pourchet,Pinglot and Pourchet, 1994) in order to identify, for each site, the total content of caesium and other radio-isotopes from the nuclear bomb tests, together with the natural radioactivity. The available data of total fall-out of l37Cs, 90Sr, 3H and other radionuclides and fluxes of 210Pb, which have been compiled (from Reference Lambert,, Ardouin, Mesbah-Bendezu, Pruppacher,, Semonin, and Slinn,Lambert and others, 1983; Reference Sanak,Sanak, 1983; Reference Bendezu,Bendezu, 1978; Reference Jouzel,, Pourchet,, Lorius, and Merlivat,Jouzel and others, 1979; Reference Koide,, Michel,, Goldberg,, Herron, and Langway,Koide and others, 1979, Reference Koide, and Goldberg,1981; Reference Raisbeck,Raisbeck and others, 1981, Reference Raisbeck,, Yiou,, Bourles,, Lorius,, Jouzel, and Barkov,1987, Reference Raisbeck,, Yiou,, Jouzel, and Petit,1990, and various other sources or generated by us, are given (Table 1a and b). The specific activities have been corrected for decay to the deposition time. The precision of our measurement is about 20% for 137Cs, 210Pb and about 100% for 41Am, 226Ra and 234Th.
Map of Antarctica showing locations of ice-boring stations

In Antarctica, the physical variables, accumulation, temperature, altitude and distance to the coast are strongly linked (Reference Young,, Pourchet,, Kotlyakov,, korolev and Dyurgerov,Young and Others, 1982; Reference Pettre,, Pinglot,, Pourchet, and Reynaud,Pettre and others, 1986). We have first correlated the radionuclides distribution with the accumulation, because it was anticipated that the wet deposition, directly related to the accumulation, has a strong influence on the radioactive fall-out. To complement this approach, spatial geostatistical investigations have been performed on the set of radionuclides data applying different methods used for measuring the spatial correlation. Mainly variograms, which represent the half mean-square differences of grades (Equation (1) in which x is the spatial coordinate) and correlograms, i.e. the correlation coefficient between measurements for each lag h (Equation (2)), were for a variable T, established:


As a verification process, we note that the variographic analysis of altitudes, in using the same location as the stations with radionuclide measurements, shows no nugget effect (this means exact measurements without variability at very small distances), and that it is easy to fit experimental variograms. The adjustments to Gaussian models show the long-distance drift in directions 45°, 75° and allow adjustments in directions 45° and 135° for distances, respectively, up to 1600 and 970 km. This is, of course, related to the altitudes as indicated only for the 78 samples and cannot be generalized for the whole elevation map. Since the mountain ranges arc structures which extend over large distances and almost always show spatial correlations (clustering of high peaks, no systematic alternation of one high summit and one low summit), the well-shaped variograms for the elevation gives confidence to the quality of the measurements. Moreover, the presence of a nugget effect (non-zero variance for very small distances) would have revealed possible errors of measurements; this is not the case.
The variographic analysis of temperatures shows the same anisotropy as for altitudes. All variograms show no nugget effect, which indicates a high degree of accuracy of the measurements and no variation at small distances.
The spatial correlation of accumulation shows an important anisotropy in the direction NNE75 and SSW165, which can be interpreted as directly related to the elevation edge with the same orientation. To underline that the mountain range brings a rather sudden increase of elevation, we here extend the term of “scarp edge” to “elevation edge” in order to characterize the influence of the accumulation (i.e. long-range correlation along the mountain range and short-range correlation across the mountain range). This physical variable shows some nugget effect in some directions like direction 075°, thus indicating a residual variability at a small scale but not in the direction 165°.
3. Results
The fluxes of radionuclides, at a given location in Antarctica, depend on the concentration in the atmosphere, the source region, stratosphere-troposphere exchanges, transport and deposition processes (i.e. either wet or dry deposition) and post-depositional changes. Recent snow cover (less than 50years) is currently dated by the total beta radioactivity. The first significant increase of radionuclide content was observed in January 1955 (Reference Picciotto, and Wilgain,Picciotto and Wilgain, 1963) and corresponds to the arrival of the Yvу and Castle series tests conducted in 1953. This increase in total beta activity due to artificial radionuclides, mainly l37Cs and 90Sr, is about 20 times higher than the natural activity level, mainly due to 210Pb. The highest recorded activity was in 1965 and must have resulted from the stratospheric transfer of debris from the Dominic and U.S.S.R. test series. The short-term temporal variations in fall-out of radionuclides have been discussed by many workers (Reference Wilgain,, Picciotio, and Breuck.Wilgain and others, 1965; Reference Lambert,, Ardouin,, sanak,, Lorius, and Pourchet,Lambert and others, 1977, Reference Lambert,, Ardouin and Sanak,1990; Reference Merlivat,, Jouzel,, Robert, and Lorius,Merlivat and others, 1977; Reference Jouzel,, Merlivat,, Pourchet, and Lorius,Jouzel and others, 1979b; Reference Koide,, Michel,, Goldberg,, Herron, and Langway,Koide and others, 1979; Reference Maenhaut,, Zoller, and Coles,Maenhaut and others, 1979). Here, we will therefore discuss spatial distributions of total fall-out of artificial radionuclides covering the total duration of atmospheric nuclear tests and fluxes of natural radionuclides.
Table 1 shows significant variation in the rate of accumulation, temperature, altitude and fall-out of radionuclides. For example, while the rate of accumulation varies by a factor of 30, the fall-out of 137Cs (between 1955 and 1980) varies by a factor of no more than 17, and the 210Pb fluxes by a factor of six which suggests a significant influence of depositional processes on radionuclide fluxes.
Major radionuclide fall-out or flux, geographical and meteorological parameters for coring stations

Minor radionuclide fall-out or flux. Source оf data: present study for data without brackets, otherwise 1 Reference Koide,, Michel,, Goldberg,, Herron, and Langway,Koide and others, 1979; 2 Reference Jouzel,, Pourchet,, Lorius, and Merlivat,Jouzel and others, 1979a; 3 Reference Lambert,, Ardouin, Mesbah-Bendezu, Pruppacher,, Semonin, and Slinn,Lambert and others, 1983; 4 Reference Crozaz,Crozaz, 1967, Reference Crozaz,1969; 5 Reference Sanak,Sanak, 1983; 6 Reference Bendezu,Bendezu, 1978; 7 Reference Raisbeck,, Yiou,, Bourles,, Lorius,, Jouzel, and Barkov,Raisbeck and others, 1987; 8 Reference Raisbeck,Raisbeck and others, 1981; 9 Reference Raisbeck,, Yiou,, Jouzel, and Petit,Raisbeck and others, 1990; 10 Reference Koide, and Goldberg,Koide and others, 1981; 11 Reference Cutter,, Bruland, and Risebrough,Cutter and others, 1979; 12 Reference Graf,Graf and others, 1994

The characteristics of radioactive fall-outs are not examined for the various radionuclides.
a. 137Cs
Over all of Antarctica the total fall-out of 137Cs for the whole deposition time (1955–80) varies from 17 B q m−2 (Ross Ice Shelf, station F 9) to 174 B q m−2 (DB). It follows a log-normal distribution, with a tail for high values above 120 B q m −2. The median of 54 B q m−2 lies 10% below the mean value of 60.2 B q m−2 revealing an asymmetry in the distribution. The three highest values, largely above the other samples, are located at D 53, K 105 and DB and appear as outliers. The data fit well on a half-normal probability plot. Mean values obtained from diverse geographical areas are not significantly different.

Along the Dumont d’Urville—Dome C (DDu-DC) axis, which possesses the highest number of values, the total fall-out is linked with the accumulation by relation (3), which is significant at the 99% confidence level (ρ = 0.65):

The extrapolation for null accumulation gives an estimate of 137Cs “dry deposition” of 35.5 B q m−2. In this region, the dry deposition would thus represent 56% of the total deposition of 137Cs. The linear regression of 137Cs vs accumulation for all samples yields a constant value (interpreted as dry deposition) of 49 B q m−2 and a regression соеfficient of 0.0649 137Cs per unit of accumulation (ρ = 0.34). The mean value of dry deposition represents for all samples 82% of the total deposition. The relatively low correlation may be due to:
-
(i) This dispersion of the data values. The dispersion of these values is caused by the fact that the meteorological regimes differ from place-to-place.
-
(ii) The accuracy of accumulation and deposition measurements. The uncertainty in the accumulation measurement can be generally neglected compared to the uncertainly of 137Cs measurements.
-
(iii) The sampling representation, because the sampling corresponds, both for ice cores and pits, to a small section and the representation strongly depends upon the local relief (sastrugi, dunes) and the drift redistribution. At two stations, South Pole (SP) and Dome C (DC), the magnitude of effects (ii) and (iii) has been estimated. For these two stations with 13 and six sampling sites, respectively, the standard deviation is around 30% (34% and 23%, respectively).
Using different complementary methods, we now examine the statistical properties of the 137Cs distribution.
No global correlation appears on the scatter plot of 137Cs vs temperature, with the exception that two sets are totally separated: temperatures less than −50° C and temperatures over −35° C with seven samples between these two sets. These two sets, and the intermediate group of seven samples appear also separated on the scatter plot of 137Cs vs accumulation with a global linear correlation of 0.34.
The scatter plots of 137Cs vs accumulation, conditioned by temperature, reveal the correlation coefficients and the regressions for the different sub-populations. The conditioning yields increasing correlation coefficients for 137Cs vs accumulation with a three-fold filtering of temperature (Fig. 2): 0.48 for temperatures below −38.3° C:, 0.58 for temperatures between −38.3° and −26° C and 0.86 for temperatures above −21° C. This is confirmed by another filtering according to five values of temperatures with tentatively equal frequencies:
Bivariate graphs of 137Cs vs accumulation, conditioned (filtered) by temperature. The first scatter plot is Nrep (i.e. not-represented) for observations where no temperature data are available. The other graphs show the behaviour of 137Cs (vertical) vs accumulation (horizontal). The correlation coefficient is indicated in the bottom-right corner. These graphs were obtained for iso-amplitude and for iso-frequency conditioning.


Two strictly different populations appear when conditioning the relationship of 137Cs and accumulation by temperature. For temperatures below −50.7° C, no significant correlation can be obtained, whereas for temperatures above −50.7° C linear behaviours are obvious. Thus, the regression coefficients diminish when temperature increases.
The statistics of 137Cs vs classes of accumulation show an increase of grade without the assumption of linearity expressed by correlation:

A trivariate graphical representation of 137Cs vs temperature and accumulation shows, in three dimensions, the piecewise linear behaviour found in the categorized analysis (Fig.3).
Quadratic surface for temperature vs accumulation and 137Cs.

A principal-component analysis performed considering the temperature, accumulation and 137Cs (Fig. 4) extracts 66% of the total variance on the first inertia axis and 95% on the plane 1–2. The observations are clearly split in a com pact group, with low temperature and low accumulation, and a scattered group correlated positively with the temperature and the accumulation (with the exception of samples D55, F9, GC38, GC6 and PS20). These groups are not separated when projected on to the 137Cs vector. The principal-component analysis repeated with the addition of variable altitude confirms the same splitting into two groups.
Principal component analysis (PCA) on the variables of temperature, accumulation and 137Cs.

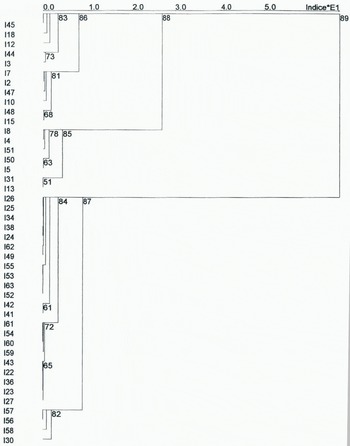
The hierarchical ascending classification (Fig. 5) clarifies the split obtained by the factorial analyses. Two groups, A and B, are obtained which are specifically related to the localization and the snow accumulation. A first group shows the sampling points in the vicinity of Dumont d’Urville and from there on a line parallel to the eastern coast. The second group includes the sampling sites on the polar plateau.
Hierarchical ascending classifications on three variables: accumulation, temperature and 137Cs. The classification of observations and their relevant clustering is shown in sub-groups. The height of the dendogram is the measure of the “classification distance” among the elements. IXX designates I for individual, with XX being the row numbers, as shown in Table 1 with the raw data.
The correlation matrices show inversion of correlation coefficients for 137Cs for these two groups:

The relationship of 137Cs vs altitude and temperature inverts between the two groups and the correlation vs accumulation drops drastically from the coast to the plateau locations. The regression lines are different from group A (coastal, Equation (4)) and B (plateau, Equation (5)):


Within group B, the average 137Cs is 45.4 B qm−2 for accumulation below 50 kg m−2a−1 which is consistent with the previous estimation of “dry deposition”.
The omnidirectional variogram (Fig. 6a) is consistent with a spherical model with a 150 km range. In directions NW150 and NE45, directional variograms can be fitted with exponential models with ranges of 850 and 575 km.
Omnidirectional variograms for 137Cs (a) and 137Pb (b). The variogram depicts the correlation as a function of distance. On a variogram, one can read the global fit of a model (curve) to line experimental values for given distances (the straight lines). The horizontal line is the statistical variance, i.e. the variance without spatial correlation. It is reached for a distance called the “range”, which is a measure of the zone if influence. Beyond this range, data measurements are spatially independent. The intersection of the model curve with the vertical axis represents the residual variance between measurements for a very small distance. It is called the “nugget effect” and represents the residual variability of the data which cannot be removed even with sampling on a very dense grid.

The isoline maps of radionuclides show large-scale structures which must not be interpreted as smooth as it may appear as this is due to the limited number of samples available. The 137Cs map, established on the basis of square blocks 250 km × 250 km (Fig. 7), shows a significant increase on the eastern border, reaching 100 B q m−2 and a peak for DC. In this quadrant, the 137Cs map is somewhat similar to a rough map of the elevation gradient. The 137Cs fall-out is above 90 B q m−2 fоr 14 squares, or 875000 km . Fourteen squares on the plateau (875 000 km2) have a value lower than 50 B q km−2; 44 blocks, i.e. 2750000 km2, have estimated values of 137Cs between 60 and 80 B q m−2.
Antarctic map of distribution of the 137Cs.

b. 90Sr
A zero correlation coefficient of 90Sr vs temperature mainly caused by the lack of a relationship in the case of three samples J9, D50, D72, With low 90Sr (110 B qm−2), masks a linear relation with a correlation coefficient around 0.90 for the six samples which have 90Sr above 140 B q m−2. At two stations (J9 and D80), where we have measurements of both 90Sr and 137Cs, the 90Sr/137Cs ratio is respectively 1.1 and 2.1 (mean values: 1.6). These ratios do not differ from the global atmospheric ratio of 1.6 (Reference Volchok,, Bowen., Folson,, Broecker,, Schwart, and Bien,Volchok and others, 1971; Reference Eisenbud,Eisenbud, 1987) and it is not possible to deduce a possible fractionation between these two radionuclides. Eight stations analysed both for 210Pb and 90Sr show a correlation of 0.89.
c. 210Pb
The atmospheric concentration of 210Pb, a long-lived daughter radionuclide (half-life 22.3 years) of radon, in the atmosphere depends on its rate of production through radon decay and its removal by atmospheric scavenging processes. The lack of radon sources in Antarctica and the time required for air to move from continental areas to this region results in a low radon (and its daughter nuclides) concentration in Antarctica.
The origin of 210Pb over Antarctica has been widely discussed. Reference Lambert,, Ardouin,, Nezami, and Polian,Lambert and others (1966) suggested an essentially stratospheric origin for 210Pb at the South Pole, based on a good correlation between 210Pb and fission products over the South Pacific and Antarctica, but Reference Lambert,, Ardouin, Mesbah-Bendezu, Pruppacher,, Semonin, and Slinn,Lambert and others (1983) stated a stropospheric origin for 210Pb. Based on the correlation between 210Pb and the stratospheric radionuclides 7Be and 137Cs (and a high level of 210Pb at the South Pole compared to Punta Arenas), Reference Maenhaut,, Zoller, and Coles,Maenhaut and others (1979) suggested transport of 210Pb to the interior of Antarctica through the lower stratosphere and (or) upper troposphere during the austral summer. The almost equal residence time of 5.5 days of 210Pb and 222Rn over the sub-Antarctic ocean, for the whole troposphere, suggests rapid transport of these radionuclides from their remote continental source; this transport of nuclides from mid latitudes towards Antarctica is not through the lower troposphere (Reference Lambert,, Ardouin and Sanak,Lambert and others, 1990).
In firn, the total of amount of 210Pb (A) is the result of equilibrium between atmospheric flux (Φ) and radioactive decay after deposition. With a constant atmospheric flux, we have relation (6)

where λ is the radioactive constant of 210Pb.
The fluxes are calculated from the continuous vertical profiles of 210Pb concentration. The quantities measured in each of the samples along the profile are summed and relation (6) is used to convert the deposition in flux. Another method of determining fluxes would involve extrapolation of the different values measured in the profile to the surface. In order to deduce a mean concentration, C at the snow surface is linked to the flux by relation (7)

where P represents the mean net accumulation on the site. The observed fluxes vary from 0.9 at 8.2 B q m−2a−1, a value quite comparable to those obtained by Reference Roos,, Holm,, Persson,, Aarkrog, and Nielsen,Roos and others (1994) from lichens, mosses, grass, soil and lake sediments collected on the South Shetland Islands (3.8–17.5 B q m−2 a−q, with a mean of 8.6 B q m−2 a−1). These fluxes are strongly correlated with the accumulation (relation (8) with ρ = 0.80 (significant at the 99% confidence level).

The active volcano Mount Erebus has been believed to be responsible for the elevated concentrations in McMurdo Sound (Reference Crozaz,, Picciotto and Breuck.Crozaz and others, 1964). The apparently high level at Roi Baudoin Station is due to the elevated snow-accumulation rate at this station.
The correlation coefficient of −0.74 between elevation and 210Pb flux is in fact stronger (−0.80) for the 17 sites above 1000 m where the linear negative behaviour is obvious. The dry fall-outs for 210Pb are lower than those for 137Cs and, for all the stations, represent about 40% of the flux. The dispersion of values is significantly lower than for artificial radionuclides. Artificial radionuclide fluxes are discontinuous, whereas the natural flux from 210Pb is continuous and the concentrations in adjacent samples arc very similar. The measurements are not consistently affected by drift redistribution but in the case of occasional or discontinuous phenomena (nuclear tests, industrial accidents, volcanic events) it would be necessary to ensure representation of the sampling.
The spatial investigations of 210Pb, based on 23 stations, reveals surprisingly well-defined structures on the omnidirectional variogram (Fig. 6b), with a clearly modelled growth up to the sill reached for a distance of 1100 km. The 210Pb stations were clustered either in the line starting at Dumont d’Urville or on the Antarctic Plateau and along the coast. The directional variogram (Fig. 6a) for NNW110 (Dumont d’Urville line) shows a smaller range at 700 km, thus providing better information than the larger grid of the other measures. One hundred and sixty-two blocks of 250 km × 250 km were estimated for 210Pb (Fig. 8). However, the map is purely indicative, due to the limited number of stations available. The second population of blocks above 2.5 B q m−2a−1 is clearly related to the scarp edges at the circumference of the continent. This is consistent with both the correlation coefficient of 210Pb with altitude and the 0.57 correlation coefficient with latitude.
Antarctic map of distribution of the 210Pb.

d. Tritium
The data for tritium fall-out are given as the total amount of tritium deposited between 1955 and 1980 along the DDu-DC axis, South Pole and Ross Ice Shelf (Table la). The tritium is incorporated in water vapour as НТО and most of the tritium present in Antarctica between 1955 and 1980 is due to atmospheric testing of fusion bombs which injected tritium into the stratosphere. The tritium deposition in Antarctica is strongly influenced by seasonal cycles and smoothing of the seasonal variations occurs by diffusion in the vapour phase during firnification (Reference Merlivat,, Jouzel,, Robert, and Lorius,Merlivat and others, 1977; Reference Jouzel,, Pourchet,, Lorius, and Merlivat,Jouzel and others, 1979a). The tritium fall-out over Antarctica varies from 211 to 840 TUm of water (1 TU = 118 B ql−1) and the average is 529 T Um of water. A plot of total tritium content vs rate of accumulation in seven stations along DDu-DC shows a good positive correlation of 0.84, suggesting a regular increase in tritium deposition with the increase in rate of accumulation. Despite the first values for very small lag distances h around 50 km, the four subsequent variogram values for 500, 800 km, etc. are consistent. The variogram with nine stations can surprisingly be modelled.
The station on the Ross Ice Shelf, which is 450 km from the coast but at 50 m elevation, is depleted in tritium compared to other stations. This suggests that moist air might have picked up the tritium from the surface and redistributed it elsewhere by eddy diffusion. The substantially higher tritium content, by a factor of 2, at the South Pole indicates preferential injection directly from the stratosphere (or opening of the stratosphere) by the direct vapour exchange of the tropospheric air mass with the stratospheric mass. However, for the preferential tritium fall-out at the South Pole, Reference Jouzel,, Pourchet,, Lorius, and Merlivat,Jouzel and others (1979a) suggested that, because of the growth of stratospheric clouds and their precipitation in the higher troposphere (Reference Stanford,Stanford, 1973), a significant percentage of tritium-rich stratospheric water could be removed from the stratosphere and accounts for large tritium injections during the Antarctic winter at the South Pole. This stratospheric cloud-formatìon mechanism could have played a particular role during 1973 for which the very high tritium fall-out is not related to the nuclear explosion calendar but is the coldest year at these levels for the 1954–78 period (−84° C) (Reference Jouzel,, Pourchet,, Lorius, and Merlivat,Jouzel and others, 1979a). However, a link with nuclear testing cannot be discarded (the fact that the 1973 French explosions produced a relatively large amount of debris has recently been disclosed).
The deposition of tritium over Antarctica is strongly related to mixing within the stratosphere and the processes of precipitation from the troposphere. The tritium formed at upper levels is brought down from higher stratospheric altitudes within the circumpolar vortex and then is passed into the troposphere by vertical exchange processes over the polar regions during the Antarctic winter when no temperature inversion exists at the South Pole tropopause. When these particular conditions exist, a continuous rapid exchange of air between the lower polar stratosphere and the troposphere possibly occurs (Reference Martell,Martell, 1970). Tritium concentration in the Antarctic precipitation is much higher than in precipitation at temperate southern latitudes. Reference Koide,, Michel,, Goldberg,, Herron, and Langway,Koide and others (1979) suggested this was due to the diluting influence of the ocean at most intermediate latitude stations and that continental effects are very important in understanding tritium deposition.
Finally, we note two interesting features of tritium fall-out. First, the latitudinal and seasonal dependence of this fall-out shows similarities between natural (analysed on snow fallen before the first nuclear testing) and artificial tritium; these similarities show that the same mechanisms govern the deposition of artificial and natural tritium (Reference Jouzel,, Merlivat,, Mazaudier,, Pourchet and Lorius,Jouzel and others, 1982). Secondly, the seasonal patterns of tritium and β fall-out clearly differ, with the maxima occurring respectively during the Antarctic winter and Antarctic summer. According to Reference Taylor,Taylor (1968), this is due to the different transfer mechanisms involved, β products arc transported with particular material in the lower stratosphere and enter the stratosphere at mid latitudes (seasonal fall-out variation characterized by a summer maximum), whereas tritium, formed at higher levels, is brought down from higher stratospheric altitudes within the circumpolar vortex and is then passed into the troposphere over the polar regions during the Antarctic winter.
e. Other radionuclides
The inventories of 241Pu and 239–240Pu are roughly similar for DC and station J9 on the Ross Ice Shelf (Table lb). The 238Pu/239–240Pu ratio is in good agreement with the values obtained from lichens, mosses, grass and soil collected on the South Shetland Islands (Reference Roos,, Holm,, Persson,, Aarkrog, and Nielsen,Roos and others, 1994) or in the McMurdo Sound area and around Syowa Station (Reference Hashimoto,, Morimoto,, Ikeuchi,, Yoshimizu,, Torii, and Komura,Hashimoto and others, 1989). 241Am inventory at the South Pole and DC also agrees with the South Shetland Islands inventory but disagrees with 241Pu at DC and the Ross Ice Shelf: at DC, 241Am, a daughter product of 241Pu represents at the date of measurement (1992) less than 3% of 241Pu. Reference Koide,, Michel,, Goldberg,, Herron, and Langway,Koide and others (1979) suggested for 238Pu a major contribution to the SNAP-9A event in 1964 and for 241Pu the reflection of the Mike, Yvy and early American thermonuclear tests, characterized by their very high ratio of 241Pu/239–240Pu : 27 in 1953 compared to a global world ratio of 13 (Reference Roos,, Holm,, Persson,, Aarkrog, and Nielsen,Roos and others, 1994).
The fluxes of cosmogenic-produced 10Be are higher by a factor of about 2 at the South Pole (2.7) compared to DC (1.6). The ratio of 10Be between the South Pole and DC is not similar to the ratio of accumulation for these two stations. This difference may be due to dry fall-out. If we assume the same concentration of 10Be in snowfall at these two stations, dry fall-outs are respectively 30% and 50% at the South Pole and DC.
234Th (0.012 B q m−2a−1) and 226Ra (0.082 B q m−2a−1) flux (decay products of the 238U family) are reported for the first time at DC. 234Th is a short-lived radionuclide (24 days) in secular equilibrium with 238U. The 226Ra flux (the long-lived radionuclide before radon) is about 7% of the total 210Pb flux. After deposition, this 226Ra produces 210Pb in snow, with apparent radioactive decay of 226Ra (~1600 years). In 60 year old snow, the activity of this 210Pb is the same as the remaining activity of 210Pb incorporated in snow by direct atmospheric scavenging (6%). For the last century, snow dating using 210Pb is easy but 210Pb supported by 226Ra should not be neglected.
A comparison between the artificial (137Cs, 90Sr, 3H), terrigenous (210Pb, 234Th, 226Ra) and cosmogenic (10Be) radionuclides indicates that artificial radionuclides constitute more than 90% of the total long-lived radionuclides deposited in Antarctica during the 1955–80 period.
4. Discussion
Most thermonuclear tests increased the radionuclide debris of the Northern Hemisphere’s troposphere and stratosphere. While tropospheric radionuclide debris deposited quickly on the Earth’s surface, the stratospheric debris began to mix. After the initial tropospheric input had been deposited, deposition over Antarctica was primarily from stratospheric input. The Southern Polar troposphere received a much smaller initial artificial radionuclide input from thermonuclear tests. Most of the radionuclides it received came from the stratosphere. This idea can also be substantiated by radio-isotope measurements performed in Antarctica (Reference Picciotto, and Wilgain,Picciotto and Wilgain, 1963; Reference Crozaz,Crozaz, 1969; Reference Taylor,Taylor, 1968) and by the 1.5 years residence time suggested by Reference Pourchet,, Pinglot, and Lorius,Pourchet and others (1983). The arrival of artificial radionuclides is in December and January when opening of the stratosphere takes place. A pronounced maximum deposition in the Antarctic summer has been illustrated for 3H (Reference Jouzel,, Merlivat,, Pourchet, and Lorius,Jouzel and others, 1979b) and 137Cs (Reference Lockhart,, Patterson, and Saunders,Lockhart and others, 1965), suggesting that the Southern Hemisphere does undergo seasonal variations in stratospheric tropospheric exchange such as observed in the Northern Hemisphere. Reference Jouzel,, Pourchet,, Lorius, and Merlivat,Jouzel and others (1979a) suggested a 2 year delay for the arrival of tritium at the South Pole after its production in the Northern Hemisphere and noted the existence of high values in South Polar snow.
The estimated dry fall-out is 82, 60 and 40% for 137Cs, 90Sr and 210Pb, respectively. These dispersed values can be explained by the geographical heterogeneity of the sampling and by the low number of common measurements. The similar origin for 137Cs and 90Sr should result in the same percentage of dry fall-out for these two radionuclides. We therefore attribute the observed differences to the uncertainty of the determinations. For 210Pb, the smaller value may reflect the arrival, from the surrounding continents, of a tropospheric fraction directly incorporated in the clouds. The tritium case is also different and the explanation for 70% of the apparent dry fall-out may be the effect of the direct molecular vapour exchange of atmospheric air masses with stratospheric masses. The observed difference between radionuclides should be applied for a classification of transport processes concerning stable species.
The omnidirectional variograms for 137Cs show “noise”, (nugget effect ) equivalent to half of the statistical variance. This noise is due to the low representativeness of a snow core in the estimation of discontinuous flux. This will result in an inaccurate estimation and mapping of 137Cs. Unlike 137Cs, the 210Pb deposition flux fluctuates little or none and the “nugget effect” associated with this radionuclide is smaller than for 137Cs (6%). A local variation in transport, accumulation and dry fall-out at high-altitude inland stations, such as DC, DB and Vostok, or preferential injection directly from the stratosphere at the South Pole (for tritium) are the most probable causes for variation in the distribution of radionuclides (137Cs and 90Sr) at these stations.
Acknowledgements
Financial assistance to S. K. B., provided by the Department of Science and Technology, Government of India, under the BOYSCAST fellowship, accorded to S. K. Bartarya, is gratefully acknowledged. Investigations at Livingston Island were made possible by Proyecto CICYTANT 93.



