Introduction
The Sahiwal was first introduced into Kenya in the first half of the twentieth century to improve the performance of the local Zebu cattle for milk production and growth. The original population was composed of 60 bulls and 20 cows, which were put in Livestock Improvement Centres (LICs) in different parts of the country following the recommendation of Meyn and Wilkins (Reference Meyn and Wilkins1974). Since then breeding in this herd has been a closed nucleus with external germplasm in form of semen from Pakistan being introduced in 1992. In 1963, after some basic performance evaluations, superior individuals were selected and used to start a breeding herd in Naivasha, Kenya, referred to as the national Sahiwal Stud (NSS). Since then the Sahiwal has been bred under a closed nucleus.
Closed nucleus breeding programmes are popular in developing countries because they are cheaper to implement and run in terms of logistics, financing and expertise required (Kahi, Nitter and Gall, Reference Kahi, Nitter and Gall2004). The nucleus is usually composed of high performing animals (Schierenbeck et al., Reference Schierenbeck, Reinhardt, Reentes, Simianer and König2011), recording of performance traits is thorough. Best Linear Unbiased Prediction (BLUP) based genetic evaluations and reproductive technologies such as artificial insemination (AI) lead to faster genetic gains by increasing the selection intensity due to use of only a few superior individuals in an entire population. Availability and use of semen from these superior individuals can lead to reduction of genetic variability due to increasing inbreeding levels in livestock herds (Weigel and Lin, Reference Weigel and Lin2002). This is more likely to occur in closed nucleus breeding programmes, precipitating erosion of genetic diversity.
Inbreeding level of the Kenyan Sahiwal breed is reported to be above 2 percent and increasing in recent years (Muasya, Kariuki and Muia, Reference Muasya, Kariuki and Muia2011; Kamiti, Reference Kamiti2014). Effective population size (Ne) was reported to be between 102 and 247 based on complete pedigree information (Muasya, Kariuki and Muia, Reference Muasya, Kariuki and Muia2011; Kamiti, Reference Kamiti2014). Whereas the Ne is within recommended levels required for a population to maintain its evolutionary potential (FAO, 1998), the estimates are below the threshold of 500 for any breeding population to maintain its genetic variability in the long term (Franklin and Frankham, Reference Franklin and Frankham1998). If unchecked, continued reduction in genetic variability will lead to unfavourable effects such as inbreeding depression, emergence of lethal recessive alleles when in homozygous form and increased variance of genetic progress due to chance (Falconer and Mackay, Reference Falconer and Mackay1996).
Measures of inbreeding and effective population size are useful for long term management of genetic variability and can be used to monitor its trends in cattle breeding programmes. However, these parameters can be over- or underestimated depending on pedigree completeness (Muasya, Peters and Kahi, Reference Muasya, Peters and Kahi2013; Faria, Madalena and Josahkian, Reference Faria, Madalena and Josahkian2009). Alternative measures of genetic variability which are less sensitive to pedigree completeness are gene origin statistics (Boichard, Maignel and Verrier, Reference Boichard, Maignel and Verrier1997). These parameters are therefore more informative than Ne in describing short-term effects on genetic variability of populations (Boichard, Maignel and Verrier, Reference Boichard, Maignel and Verrier1997). They provide a better understanding of a breed's history and inform future actions in order to achieve greater genetic gains without loss in genetic diversity Carneiro et al. (Reference Carneiro, Malhado, Euclides, Torres, Lopes, Carneiro and Cunha2006) by monitoring and controlling rates of inbreeding (Fernandez et al., Reference Fernandez, Meuwissen, Toro and Maki-Tanila2011). Loss of genetic diversity can occur due to heavy use of some AI sires (Muasya, Peters and Kahi, Reference Muasya, Peters and Kahi2013; Hammami et al., Reference Hammami, Croquet, Stoll, Rekik and Gengler2007), periodic reductions in population size, unequal contributions of ancestors and changes in the number of contributing males (Boichard, Maignel and Verrier, Reference Boichard, Maignel and Verrier1997). This has been shown to contribute to increase of family variance (Faria, Madalena and Josahkian, Reference Faria, Madalena and Josahkian2009), and make it difficult to interpret estimates of inbreeding and Ne (Boichard, Maignel and Verrier, Reference Boichard, Maignel and Verrier1997). The objective of this study was to assess the genetic variability Sahiwal cattle in Kenya through pedigree analysis.
Material and methods
Materials
Data on pedigree of the Sahiwal cattle in Kenya were obtained from animals born in the National Sahiwal Stud at Kenya Agricultural and Livestock Research Organisation (KALRO) Naivasha and consisted of animals born between 1949 and 2008. Information on these animals included dates of birth and sex of each animal. The genealogy of each animal was traced individually as far back as possible in the birth record book database in order to include all known ancestors and relatives of each individual leading to the creation of a database of 18 315 animals.
Methods
Generation intervals
Generation intervals, or the age of parents when their progeny are born (Falconer and Mackay, Reference Falconer and Mackay1996) were calculated for the sire–son, sire–daughter, dam–son and dam–daughter pathways.
Pedigree completeness
Parameters estimated to quantify pedigree quality included pedigree completeness index, number of maximum traced, number of complete generations and number complete generation equivalent. The parameters were estimated as follows:
Number of maximum traced generations
Number of generations was calculated as the number of generations separating the offspring from its furthest known ancestor in each path. Ancestors with unknown parents were considered as founders and assigned to generation 0.
Number of complete generations
Number of equivalent generations is the number of generations, n separating the individual from the furthest generation where both generation ancestors of the individual are known. This was computed as:
 $${\rm GE} = \sum\limits_{i = 1}^n {\left( {\displaystyle{1 \over 2}} \right)} ^n,$$
where n is the number of generations separating the individual to each known ancestor, where both generation ancestors are known.
Number of complete generations equivalents
Complete generation equivalent was computed as the farthest generation for which all ancestors are known. For an individual j, the number of complete generation equivalents, CGE, was calculated as:
 $${\rm CGE} = \sum\limits_{i - {\rm 1}}^{n_{\rm j}} {\displaystyle{{\rm 1} \over {{\rm 2}^{g^{{\rm ij}}}}}}, $$
where n j is the number of ancestors for animal j; g ij is the number of generations separating individual j and its ancestor i (Sölkner, Filipcic and Hampshire, Reference Sölkner, Filipcic and Hampshire1998).
Increase in inbreeding per generation
Increase in inbreeding per generation was also calculated based on regression (b) of individual increase in inbreeding over equivalent generations as:
 $$\Delta F = \displaystyle{{F_t - F_{t - 1}} \over {1 - F_{t - 1}}},$$
where F t and F t−1 are the average inbreeding of the ith generation.
Individual increase in inbreeding
Individual increase in inbreeding ΔF i was calculated as (Gutierrez, Cervantes and Goyache, Reference Gutierrez, Cervantes and Goyache2009):
 $$\Delta F_i = 1 - \root {{\rm CGE} - 1} \of {1 - F_i}, $$
where F i is the individual coefficient of inbreeding and CGE is the complete generation equivalent (Maignel, Boichard and Verrier, Reference Maignel, Boichard and Verrier1996).
Effective population size
Effective population size, Ne is defined as the number of breeding animals expected to cause the actual increase in inbreeding if they contributed equally to the next generation (Falconer and Mackay, Reference Falconer and Mackay1996). Effective population size, Ne for each generation was calculated based on ΔF as:
 $$N_{\rm e} = \displaystyle{1 \over {2\Delta F}},$$
as long as F t > F t−1 to allow for characterise the effect of remote and close inbreeding. For small populations and or with shallow pedigrees, Ne is usually overestimated (Goyache et al., Reference Goyache, Gutiérrez, Fernandez, Gomez, Alvarez, D?az and Royo2003). Additional values of Ne were estimated as the coefficient of regressing individual inbreeding coefficient on number of (i) full generations, (ii) maximum and equivalent generations traced and (iii) complete generation equivalents. The corresponding coefficient of regression represented the increase in inbreeding between any two consecutive generations (F t − F t−1 = b), such that N e = 1/2b. Estimates of Ne calculated using full, maximum and equivalent generation are useful informing lower, upper and real limits of Ne for the population under study.
Probability of gene origin statistics
Number of founders (N f) was computed as all individuals in the population with unknown parents and were non-inbred. Also any individual with either parent unknown, that parent was taken as a founder.
Effective number of founders (f e), defined as the number of equally contributing founders expected to produce the same diversity as observed in the reference population (Lacy, Reference Lacy1989) was estimated as:
 $$f_{\rm e} = \displaystyle{1 \over {\sum\nolimits_{k = 1}^f {q_k^2}}}, $$
where q k is the probability of a gene origin of the kth founder.
Effective number of ancestors (f a) is defined as the minimum number of ancestors required to explain the complete genetic diversity in a population (Boichard, Maignel and Verrier, Reference Boichard, Maignel and Verrier1997). This parameter was computed as:
 $$f_{\rm a} = \displaystyle{1 \over {\sum\nolimits_j^{\rm a} {q_j^{\rm 2}}}}, $$
where q j is the marginal contribution of an ancestor j, which is not explained by other ancestors chosen before it. Effective number of ancestors accounts for recent bottlenecks occurring in a population and therefore partially accounts for loss of allelic diversity in descendant population (Boichard, Maignel and Verrier, Reference Boichard, Maignel and Verrier1997).
Effective number of founder genomes (f g) is the number of founders that would give the same level of genetic variability in the population under study with equal representation of founders and no loss of alleles (Ballou and Lacy, Reference Ballou, Lacy, Ballou, Gilpin and Foose1995; Lacy, Reference Lacy1989, Reference Lacy1995). This parameter was computed as twice the average coancestry of the individuals in the reference population.
Mean number of progeny per sire, number of generations, inbreeding coefficient, average relatedness (AR) coefficient, individual increase in inbreeding and average offspring size and probability of gene origin in the Kenyan Sahiwal population were computed for 5 10-year groups as follows: 1(1961–1969); 2(1970–1979); 3(1980–1989); 4(1990–1999) and 5(2000–2008). All parameters were calculated using ENDOG software (Gutiérrez and Goyache, Reference Gutiérrez and Goyache2005).
Results
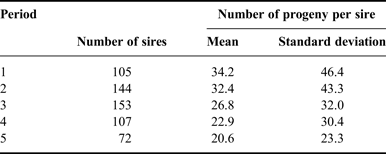
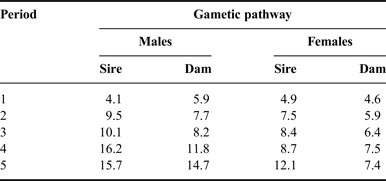
Registered sires and the average progeny per sire and their respective standard deviations are given in Table 1. Average number of progeny per sire and the respective standard deviation decreased over the years by about 50 and 60 percent, respectively, from the first to the last year period (Table 1) partly due to a decline in population size over the years (Table 4). The coefficient of variation was well over 100 percent (119 to 136 percent). Generation intervals for sire pathways were longer than dam pathways and increased over year periods, and ranged from about 4–16 years (Table 2). The long generation interval along the sire pathway was due to use of old sires because progeny testing at the National Sahiwal Stud had ceased since the year 2000. Since breeding at the National Sahiwal Stud in Kenya solely uses AI, only old progeny tested bulls had their semen available. Also as a policy of the stud, progeny tested bulls were mated to elite usually old cows to produce young bulls for progeny testing Muhuyi, Lokwaleput and Sinkeet (Reference Muhuyi, Lokwaleput and Sinkeet1999), partly explaining why the generation intervals were increasing over the year groups.
Mean number of progeny per sire and standard deviation in the five year periods in the Sahiwal cattle in Kenya.

Generation intervals of the four gametic pathways in the 5-year periods the for the Kenyan Sahiwal population.

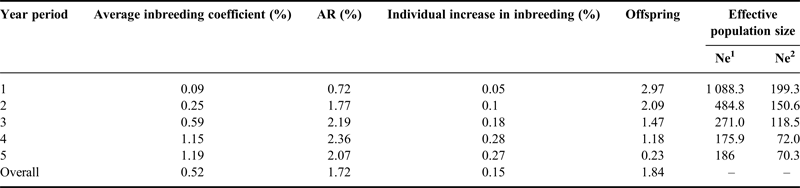
Individual inbreeding coefficient, individual AR coefficient, individual increase in inbreeding and average offspring size are given in Table 3. Individual inbreeding level and AR among individuals in the population increased over time from 0.09 and 0.7 percent to 1.2 and 2.1 percent, respectively. Values of effective population size computed by regressing individual inbreeding coefficient over number of full generations, maximum number of generations traced and complete equivalent generations were 102.4, 265.1 and 125.2, respectively.
Number of generations, inbreeding coefficient, average relatedness (AR) coefficient, individual increase in inbreeding and average offspring size for the Kenyan Sahiwal population.

Ne1 and Ne2 represent effective population size computed through regression on individual increase in inbreeding and regression on complete equivalent generations, respectively.
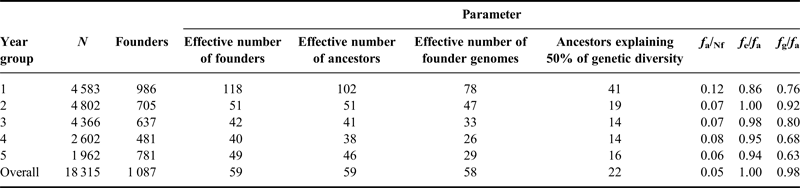
Probability of gene origin statistics, their ratios and number of ancestors explaining 50 percent of total variations in each year period are shown in Table 4. Number of founders, effective numbers of founders, ancestors and founder genomes decreased over the years but increased slightly in the last year group, indicating that loss in genetic variability occurred in the Sahiwal breed. The increase in the last year group could be due to the use of old sires due to cessation of progeny testing at the NSS because of logistical reasons. The effective numbers of founders were much smaller compared with the number of founders. The marginal genetic contribution of the most important ancestor increased, while the number of ancestors required for explaining half of the total variation observed in the Kenyan Sahiwal breed decreased over time.
Characteristics based on probability of gene origin in the Kenyan Sahiwal population.

Discussion
Generation intervals for the sire pathways were very long compared with other European breeds, even though zebu cattle generally have delayed age at first calving. This was partly due to use of old sires, born before the year 2000 following the cessation of progeny testing at the NSS. Apart from lengthening generation intervals in the sire pathways, use of few old sires led would lead to reduction in genetic variation and limited or no genetic progress. This was confirmed by Ilatsia et al. (Reference Ilatsia, Muasya, Muhuyi and Kahi2007) who reported lack of genetic progress in milk production and fertility traits for the Kenyan Sahiwal. Other studies which reported long generation intervals for the sire pathways include Faria, Madalena and Josahkian (Reference Faria, Madalena and Josahkian2009) and Filho et al. (Reference Filho, Lopes, Verneque, Torres, Teodoro and Carneiro2010) for Brazilian zebu breeds. However, in experimental herds of some Zebu breeds, shorter generation intervals of 3.7 years in both pathways have been reported (Razook et al., Reference Razook, Figueiredo, Bonilha Neto, Trovo, Packer, Pacola and Cândido1993). Generation equivalents of the Sahiwal population in the current study were lower than those reported for Brazilian Zebu breeds (Faria, Madalena and Josahkian, Reference Faria, Madalena and Josahkian2009). Elsewhere, Italian beef breeds were reported to have generation equivalents of about 5 (Bozzi et al., Reference Bozzi, Franci, Forabosco, Pugliese, Crovetti and Filippini2006).
Inbreeding coefficient of the Sahiwal cattle breed was about 1.2 percent in the last year period studied with a general increase over the years. This could be attributed to large-scale utilization of few superior sires and use of old bulls from before the year 2000 due to cessation of progeny testing, which also led to an increase in the generation interval and the family size variance (Falconer and Mackay, Reference Falconer and Mackay1996) and limited effective population size. In the current study, effective population size decreased as inbreeding level increased across the year periods studied (Table 3). A similar trend was reported among the Gyr, Nerole and Guzerat Zebu breed in Brazil (Faria, Madalena and Josahkian, Reference Faria, Madalena and Josahkian2009). Average inbreeding coefficients of 0.5 and 1.2 percent for the entire population and the reference population, respectively were lower than corresponding values of 7.8 and 10.8 percent for the Lidia breed in Spain (Cortés et al., Reference Cortés, Sevane, Baro and Cañón2014), 4.81 percent for Burlina breed in Italy (Battagin et al., Reference Battagin, Penasa, Pretto and Cassandro2010) and 2.82 percent for Gyr dairy cattle in Brazil (Filho et al., Reference Filho, Lopes, Verneque, Torres, Teodoro and Carneiro2010). Even higher inbreeding coefficients have been reported in other cattle breeds (Danchin-Burge et al., Reference Danchin-Burge, Leroy, Brochard, Moureaux and Terrier2012; Bouquet et al., Reference Bouquet, Venot, Laloë, Forabosco, Fogh, Pabiou, Moore, Eriksson, Renand and Phocas2011; McParland et al., Reference McParland, Kearney, Rath and Berry2007).
Estimates of inbreeding levels and effective population size are closely related to the quality of pedigree (Gutiérrez et al., Reference Gutiérrez, Altarriba, Diaz, Quintanilla, Cânon and Piedrafita2003; Muasya, Peters and Kahi, Reference Muasya, Peters and Kahi2013). Further evidence is provided by the values of 102.4, 125.2 and 265.1, obtained based on complete, full and complete equivalent generations. According to Goyache et al. (Reference Goyache, Gutiérrez, Fernandez, Gomez, Alvarez, D?az and Royo2003) these estimates are useful for providing lower, real and upper limits of Ne, respectively, for the population under study since for small populations and or with shallow pedigrees, Ne is usually overestimated. In other Zebu breeds, Ne estimates ranging from 124 in polled Nelore breeds to nine in Sindi breed have been reported (Faria et al., Reference Faria, Vercesi Filho, Madalena and Josahkian2002). Verneque et al. (Reference Verneque, Reis Filho, Martinez, Lopes, Teodoro, Torres, Machado and Peixoto2006) reported Ne ranging from 16 to 125 for the Dairy Gir, with more recent generations being more inbred, similar to the present study. Muasya, Peters and Kahi (Reference Muasya, Peters and Kahi2013) found Ne ranging from 454 to 263 in Kenyan Holstein–Friesian. Cortés et al. (Reference Cortés, Sevane, Baro and Cañón2014) reported an Ne of 37.5 for the Lidia breed of Spain. The decline in Ne can be attributed to increase in inbreeding coefficient in the population due intense use of few superior sires (Nomura, Honda and Mukai, Reference Nomura, Honda and Mukai2001).
Management of genetic variation in selection programmes is important for conservation purposes and short and long-term selection responses (Hill, Reference Hill2000). Effective population size is an important parameter to monitor when managing genetic diversity in breeding programmes because it reduces genetic variability and depresses performance. An effective population size of 31–250 has been recommended to prevent decline in fitness of a population due to inbreeding depression (FAO, 1998; Meuwissen and Woolliams, Reference Meuwissen and Woolliams1994) and to maintain mid-term genetic variability. This can be achieved by ensuring that the rate of inbreeding per generation does not exceed 1 percent beyond which a population begins to lose its fitness (Franklin and Frankham, Reference Franklin and Frankham1998). However, since in most breeding programmes the aim is to maintain genetic variability in the long-term, a Ne of at least 500 should be targeted (Franklin and Frankham, Reference Franklin and Frankham1998). In the present study Ne in the most recent year group was within the range of 31–250 required for a population to maintain its fitness (FAO, 1998) but below the recommended levels of 500 for maintenance of genetic variability in the long term (Franklin and Frankham, Reference Franklin and Frankham1998). Therefore strategies should be put in place to control future rates of inbreeding while achieving genetic progress for traits of economic importance in the Kenyan Sahiwal breed. Nevertheless, controlling future rates of inbreeding by constraining the degree of relatedness of mates is only effective for a few generations (Fernandez et al., Reference Fernandez, Meuwissen, Toro and Maki-Tanila2011). Incorporation of genomic selection in breeding programmes, which is capable of minimising Mendelian sampling allows for increasing effective population size (Daetwyler et al., Reference Daetwyler, Villanueva, Bijma and Woolliams2007) should be considered.
Effective population size is normally overestimated after a number of generations with incomplete pedigree information, becoming worse as number of generations increase. On the other hand, gene origin statistics are less sensitive to pedigree completeness and are therefore more informative than Ne for describing short term effects on genetic variability of populations (Boichard, Maignel and Verrier, Reference Boichard, Maignel and Verrier1997). In the present study, the number of founders (animals without parent information) was high compared to the total population size studied, indicating that current Ne value could be an overestimation. This is seen in the change in Ne from 265.1 to 102.4 when estimated based on full and complete generations traced, respectively.
Gene origin parameters also indicate the loss of genetic variability in the Sahiwal breed. Effective number of founders reported in the current study of 49 in the most recent year group was higher than that of 38 for the Nelore of Brazil (Faria, Madalena and Josahkian, Reference Faria, Madalena and Josahkian2009) and 27.8 for Lidia breed in Spain (Cortés et al., Reference Cortés, Sevane, Baro and Cañón2014) but smaller than 284 for the Gir and 247 for Guzerat cattle breeds (Faria, Madalena and Josahkian, Reference Faria, Madalena and Josahkian2009). The effective number of ancestors of 46 found in the current study was lower than 211 and 166 for Gir and Guzerat Zebu breeds (Faria, Madalena and Josahkian, Reference Faria, Madalena and Josahkian2009), but higher than 15.8 for the Lidia breed in Spain (Cortés et al., Reference Cortés, Sevane, Baro and Cañón2014). Other studies which have reported lower estimates include Sorensen, Sorensen and Berg (Reference Sorensen, Sorensen and Berg2005) which found values of 20.6, 23.8 and 34.6, respectively, for Danish Holstein, Jersey and Red breed populations and Bouquet et al. (Reference Bouquet, Venot, Laloë, Forabosco, Fogh, Pabiou, Moore, Eriksson, Renand and Phocas2011), Danchin-Burge et al. (Reference Danchin-Burge, Leroy, Brochard, Moureaux and Terrier2012) and Melka et al. (Reference Melka, Stachowicz, Miglior and Schenkel2013). Effective number of founder genomes of 29 was higher than 12.3 reported for the Lidia breed of Spain (Cortés et al., Reference Cortés, Sevane, Baro and Cañón2014).
Ratios of parameters of gene origin provide information on the historical development of a population since the founder population (Boichard, Maignel and Verrier, Reference Boichard, Maignel and Verrier1997). The ratio of f e/N f describes whether the founders were used in a balanced manner and the extend of pedigree completeness. A low ratio means that the population has gone through bottlenecks and or indicates gaps in pedigree recording. For the most recent year group studied, the ratio of 0.06 was larger than 0.0004 for Nerole but close to 0.5 for both Gir and Guzerat breeds in Brazil (Faria, Madalena and Josahkian, Reference Faria, Madalena and Josahkian2009). This implies an unequal contribution of founders to the reference population. However, from these studies, the rations are somewhat dependent on population size, since the Nelore has a large number of founders (84 452) compared with the Gir (6 081) or Guzerat (4 980) and pedigree completeness such that lower values are reported for large populations with high levels of pedigree completeness.
The ratio of f a/f e is useful when describing the history of a population. The ratio of 0.94 reported in the current study indicates that the Kenyan Sahiwal population has been genetically stable. This ratio is close to 0.89 reported for the Nerole breed but higher than 0.74 and 0.67 for Gir and Guzerat breeds of Brazil (Faria, Madalena and Josahkian, Reference Faria, Madalena and Josahkian2009). Other lower values include 0.15 for Tunisian (Hammami et al., Reference Hammami, Croquet, Stoll, Rekik and Gengler2007) and 0.57 for Spanish Lidia cattle breed (Cortés et al., Reference Cortés, Sevane, Baro and Cañón2014). The ratio reported in the current study implies a balanced contribution of ancestors to the reference population of the Kenyan Sahiwal breed, which could be due to lack of effective selection in this population (Ilatsia et al., Reference Ilatsia, Muasya, Muhuyi and Kahi2007). A ratio of f g/f e of 0.59 found in the current study was within the range of 0.4–0.68 reported for Brazilian Zebu breeds (Faria, Madalena and Josahkian, Reference Faria, Madalena and Josahkian2009; Vozzi et al., Reference Vozzi, Marcondes, Magnabosco, Bezerra and Lôbo2006) and Spanish Lidia breed (Cortés et al., Reference Cortés, Sevane, Baro and Cañón2014), indicating genetic loss of genetic variability occurred through genetic drift in the Kenyan Sahiwal population.
The number of ancestors required to explain 50 percent of the observed variation in the reference population of 16 was lower than 56, 37 and 41, for Nelore, Gir and Guzerat, respectively, (Faria, Madalena and Josahkian, Reference Faria, Madalena and Josahkian2009). In the Kenyan Holstein–Friesian population a value of 89 was reported (Muasya, Peters and Kahi, Reference Muasya, Peters and Kahi2013). For the Lidia cattle breed of Spain, six ancestors were required to explain 50 percent of the total variation (Cortés et al., Reference Cortés, Sevane, Baro and Cañón2014). The small number of ancestors that account for 50 percent of the total variation in the reference population suggests overuse of a small number of some animals as parents over generations, explaining to some extend the loss in diversity in the Sahiwal population in Kenya. Also, the smaller ratio of f g/f e compared with f a/f e, implies loss of genetic variability in the population was more by genetic drift than bottlenecks.
In Kenya, the Sahiwal is bred under a closed nucleus breeding program where performance recording and selection is confined to the nucleus, and the pastoral herds being the main recipients of the resultant genetic superiority (Ilatsia et al., Reference Ilatsia, Roessler, Kahi, Piepho and Zarate2011). Nucleus breeding programmes have been advocated for genetic improvement of cattle in developing countries (Kahi, Nitter and Gall, Reference Kahi, Nitter and Gall2004) due to their ease of implementation as recording is done in the nucleus. However, if the current inbreeding levels continue to increased unchecked and Ne declines the nucleus may experience a reduction of genetic variability and inbreeding depression for traits of economic importance as well as possibility of emergence of lethal recessive alleles in homozygous form and increased sampling variance of breeding programmes (Malhado et al., Reference Malhado, Malhado, Carneiro, Ramos, Ambrosini and Pala2012; Meuwissen and Sonesson, Reference Meuwissen and Sonesson1998). Difficulties in planning mating systems aimed at controlling future rates of inbreeding due to increased AR among individuals may also be experienced (Fernandez et al., Reference Fernandez, Meuwissen, Toro and Maki-Tanila2011). Apart from putting into place strategies to control future rates of inbreeding, new germplasm from other Sahiwal populations such as from India and Pakistan can be introduced in order to widen the population's genetic base.
Conclusions
The Kenyan Sahiwal population is derived from a small founding population and has moderate pedigree completeness. Ratios of gene origin statistics indicate that loss of genetic variability is more through genetic drift than due to inbreeding. Effective population size was low or moderate depending on the method of estimation. Future breeding strategy should aim to control future decline in effective population size. From the perspective of long-term management of genetic variability, rate of increase in coancestry is most crucial since it uses all currently available information to predict future trend in inbreeding. Using few progeny tested sires born before the year 2000 will have consequence of limited genetic progress in the NSS and reduction in genetic variation. Therefore progeny testing should be urgently resumed coupled with a breeding strategy that incorporates tools that balance rate of genetic gain and the future rate of inbreeding.
Acknowledgements
The authors are grateful to the Kenya Agriculture and Livestock Research organisation (KALRO) for availing data, the ILINOVA project for provision of funds and Egerton University, Kenya for provision of computing facilities.
Statement of interest
The authors declare that no conflict of interest, financial or otherwise, exist concerning this research work.