Introduction
Alpine ecosystems are characterized by erratic precipitation, high evaporation, extreme cold, large temperature fluctuations across the freezing point and intense ultraviolet (UV) radiation (Körner, Reference Körner2007; Lu et al., Reference Lu, Fan, Yan and Wang2013). The alpine ecosystems are fragile, sensitive and vulnerable to changes in the climate and human activities in the extremely harsh natural environment (Wischnewski et al., Reference Wischnewski, Kramer, Kong, Mackay, Simpson, Mischke and Herzschuh2011; Pan et al., Reference Pan, Zou, Liu, Wu and He2017). On the Qinghai-Tibetan Plateau of China, alpine meadow is the most extensive pasture type, covering about 0.47 of the total area (Dong et al., Reference Dong, Qia, Zhao and Ma2007). It is a key food resource for a variety of livestock on which local people depend for their sustenance and traditional lifestyle (Gao et al., Reference Gao, Li, Wan, Qin, Jiangcun and Liu2009). Previous studies in the Qinghai-Tibetan Plateau alpine meadows revealed that plant establishment, survival and community stability was influenced greatly by water (Yang et al., Reference Yang, Fang, Fay, Bell and Ji2010), heat (Xu et al., Reference Xu, Gu, Zhao, Xiao, Tang, Fang, Zhang and Jiang2011) and their combined effect (Zhong et al., Reference Zhong, Ma, Salama and Su2010).
The challenge for increasing forage production, seed yield and water productivity in this alpine region is often from low temperature and erratic rainfall (Zhang et al., Reference Zhang, Cao, Bai, Zhou, Ning, Yang and Hu2013). With the increased livestock population in the alpine region, it is crucial to improve the productivity of forage legumes by utilizing well-adapted native plants to offset negative effects resulting from harsh climatic conditions, to satisfy food security and sustainability in the future.
Perennial vetch (Vicia unijuga) is well-adapted to the harsh alpine environment worldwide (China Flora Editorial Board, 2006). It is native to the Qinghai-Tibetan Plateau where it has been used as forage for livestock farming for more than 20 years (Ding, Reference Ding1996). Perennial vetch can produce 1–4 t/ha dry forage matter with a high content of protein (24.0%) and soluble sugar (4.8%) (Mao et al., Reference Mao, Fu, Niu, Nie and Chen2015). Cultivation of legume-cereal mixtures such as perennial vetch and naked barley (Hordeum vulgare L. var. nudum Hook. f.) and oat (Avena sativa L.) could enhance the nutritive value of the herbage for local sheep (Ovis aries L.) and yak (Bos grunniens L.) (Ma and Han, Reference Ma and Han2001). However, on the Qinghai-Tibetan Plateau, previous studies have reported low forage productivity of perennial vetch, with a low plant canopy and above-ground dry matter (Shen, Reference Shen2015). Shen et al. (Reference Shen, Matthew, Nan and Wang2015) also found that even with adequate pollination, there was a fundamental problem of low seed yield of perennial vetch on the Qinghai-Tibetan Plateau. The harsh climatic conditions (e.g. extreme cold and erratic precipitation) had a negative effect on growth and reproduction, thereby limiting utilization of this species for large-scale cultivation.
Soil surface mulching (i.e. plastic film and crop straw) has been widely adopted to modify soil temperature and moisture conditions, thus improving plant growth, reproduction and water productivity (Li et al., Reference Li, Wang, Li, Gao and Tian2013b; Jabran et al., Reference Jabran, Ullah, Hussain, Farooq, Zaman, Yaseen and Chauhan2015; Gu et al., Reference Gu, Li and Du2018). The increased temperature under plastic mulching could promote plant growth and yield, contributing to water productivity improvement of Setaria italica L. (Dong et al., Reference Dong, Liu, Jiang, Shi, Wang, Qiao, Liu, Zhao, Li and Si2014) and Oryza sativa L. (He et al., Reference He, Yang, Wu, Jia and Ma2016). However, other studies have suggested that removing the plastic film mulch during the reproductive stage greatly enhances the beneficial effects of mulching on grain production for Triticum aestivum L. (Li et al., Reference Li, Wang, Xu and Xu2004b) and Zea mays L. (Bu et al., Reference Bu, Zhu, Liu, Luo, Chen and Li2013b) in semi-arid regions, compared to mulching for the entire growing season. Application of straw mulching has been shown to suppress the maximum soil temperature and reduce temperature variation, and so be beneficial for dry matter accumulation and seed production in Brassica napus L. (Su et al., Reference Su, Lu, Wang, Li, Ren and Cong2014), Glycine max L. (Merr.) (Sekhon et al., Reference Sekhon, Hira, Sidhu and Thind2005) and Medicago sativa L. (Fan et al., Reference Fan, Gao, Wang, Malhi and Li2014); however, decreased soil temperature under straw mulching led to a reduction of above-ground biomass and grain yield in T. aestivum in the North China Plain (Chen et al., Reference Chen, Zhang, Pei, Sun and Chen2007). Moreover, soil mulching reduced soil evaporation and increased soil water retention (Baumhardt and Jones, Reference Baumhardt and Jones2002) and transpiration (Molden et al., Reference Molden, Oweis, Steduto, Bindraban, Hanjra and Kijne2010), thereby improving plant growth and development (Fan et al., Reference Fan, Gao, Wang, Malhi and Li2014), crop yield and water productivity (Siczek et al., Reference Siczek, Horn, Lipiec, Usowicz and Łukowski2015; Gu et al., Reference Gu, Li and Du2018). The effectiveness of mulching depends on the climatic zone and the mulching method. Research-based information for mulching effects on the growth, yield and water productivity of perennial vetch in alpine regions is limited, and the contributions of soil temperature and moisture drivers to variation in perennial vetch forage production and seed yield remains unclear. It is, therefore, necessary to assess the productivity of perennial vetch in response to patterns of mulching in alpine regions in order to combat the negative effects derived from the harsh environments (Li et al., Reference Li, Hou, Jia, Han, Ren and Yang2013a).
The objectives of the current research were to (1) examine the effects of plastic and straw mulching on soil temperature and moisture conditions as reflected in growth characteristics, seed yield potential and water productivity of perennial vetch, (2) evaluate possible effects and the relative contributions of soil temperature and water content on variation in productivity traits, (3) provide scientific information for enhancing perennial vetch cultivation and management in the alpine regions.
Materials and methods
Site description
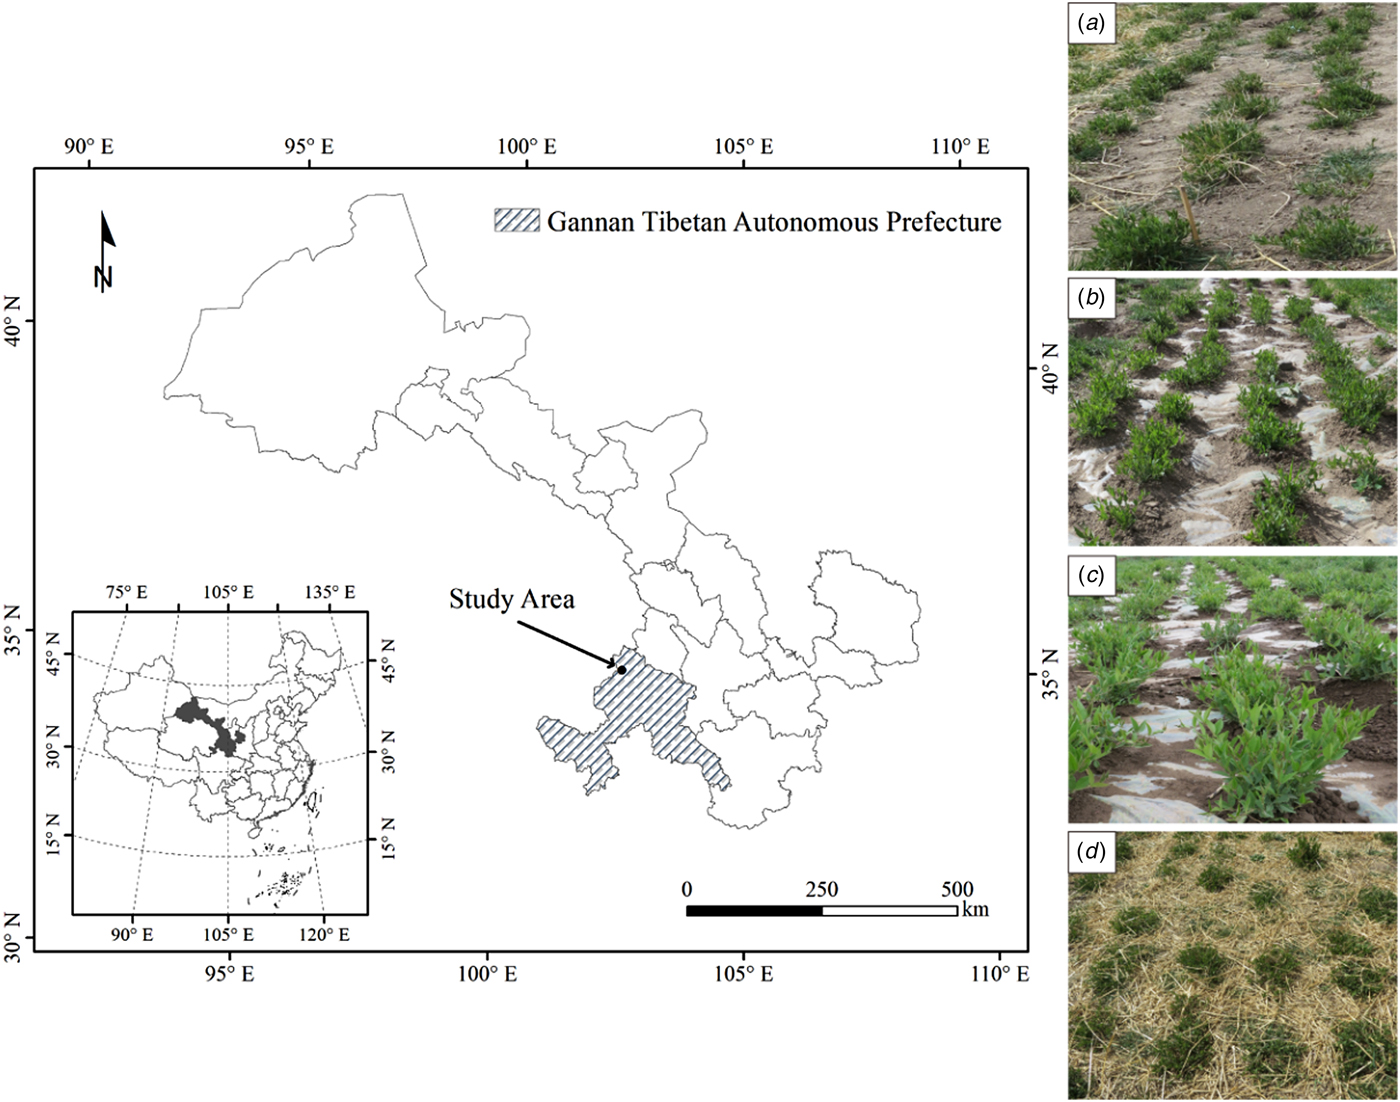
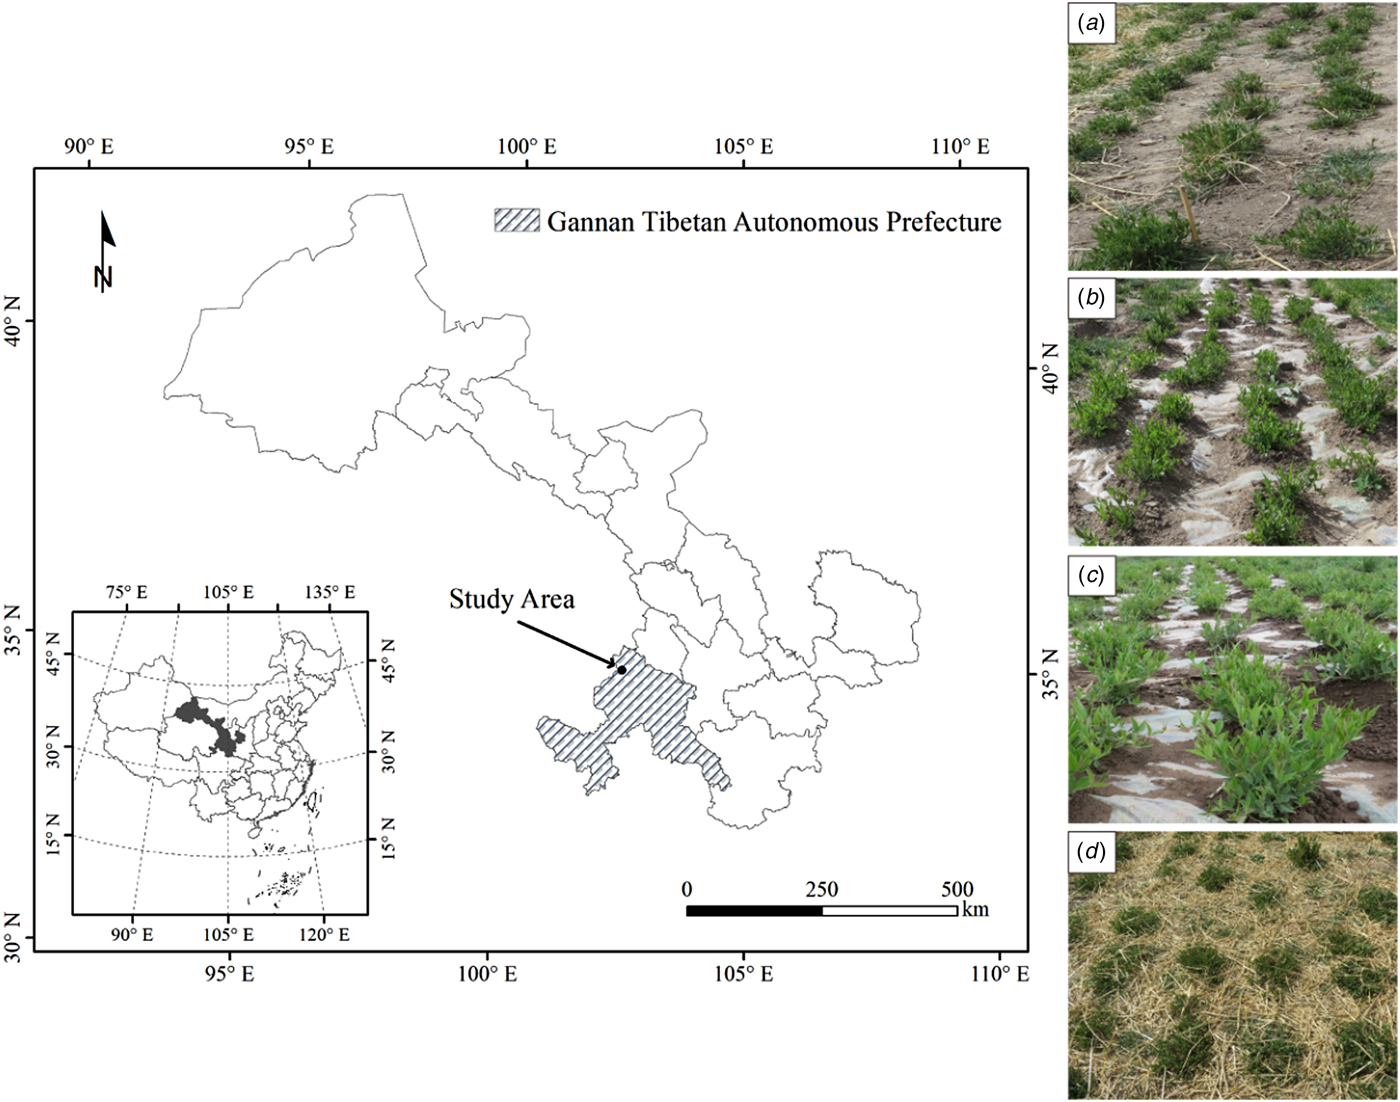
The experiment was conducted during three growing seasons (April–September) 2014–2016 at the Lanzhou University Domestication Research Farm near the township of Xiahe country, located in Gannan Tibetan Autonomous Prefecture, Gansu Province, Qinghai-Tibetan Plateau of China (35°11′N, 102°29′E, 2962 m a.s.l.) (Fig. 1). According to long-term (1984–2013) data from a meteorological station located within 200 m of the experimental site, mean annual rainfall is 451 mm, with over 0.8 of the rain falling during the growing season (April–September). Mean annual air temperature is 3.5 °C, with mean winter (December–February) and summer (June–August) air temperatures of −6.6 and 12.8 °C, respectively. Mean annual potential pan evaporation is 1343 mm, mean annual sunshine is 2425 h and the mean annual frost-free period is 81 days.
Experimental location on the Qinghai-Tibetan Plateau in Xiahe County, Gannan Tibetan Autonomous Prefecture, Gansu Province, China (left); and the different mulching treatments for perennial vetch (right), (a) non-mulched control (Control); (b) plastic film mulching treatment (FM); (c) removal of plastic film mulching at 30% flowering stage treatment (RM); and (d) naked barley straw mulching treatment (SM).
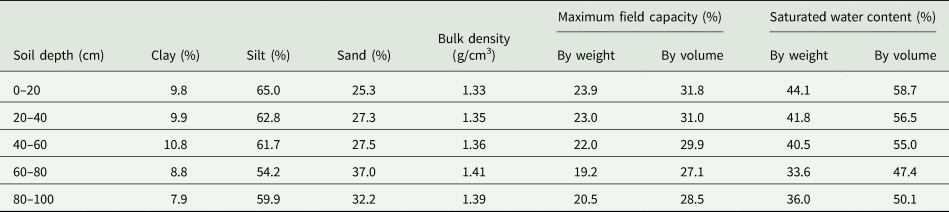
The soil texture is silt loam, according to the United States Department of Agriculture soil textural classification system (Soil Survey Staff, 1998). The top 0–20 cm layer of the soil profile had a pH of 8.2, and the organic carbon (C), total nitrogen (N) and phosphorus (P) were 23.0, 2.0 and 1.5 g/kg, respectively. Available N, P and potassium (K) were 23.2, 23.1 and 305.0 mg/kg, respectively. The data of various soil physic-chemical properties (0–100 cm) are presented in Table 1, such as clay (7.9–10.8%), silt (54.2–65.0%), sand (25.3–37.0%), bulk density (1.33–1.41 g/cm3), maximum field capacity (w/w, 19.2–23.9%; v/v, 27.1–31.8%) and saturated water content (w/w, 33.6–44.1%; v/v, 47.4–58.7%).
Soil properties of the study site

Experimental design and field management
In May 2011, scarified seeds of perennial vetch were sown in the field by hand at a depth of 3–5 cm with an inter- and intra-row plant spacing of 40 and 40 cm, respectively, equivalent to 9 plants/m2. Plants were allowed to grow for 3 years before the experimental work began. The experiment began on 5 April 2014 and concluded on 10 September 2016.
Four treatments were applied to 48 m2 (2.4 × 20 m2) plots arranged in a completely randomized block design with four replications. The control was a flat, non-mulched field (Fig. 1(a)). In the treatments involving plastic film mulch (FM), a plastic film (transparent polyethylene film of width 2.8 m and thickness 0.03 mm) covered the plots for either the entire season (Fig. 1(b)), or until the 30% flowering stage (RM, Fig. 1(c)). Holes (1-cm diameter) were made in the plastic film for precipitation infiltration, with a single hole centred between each pair of plants within a row. When the plants turned green, appropriately placed holes were made in the film to allow the emerged plants to grow unhindered above the mulch. In a fourth treatment, plots were mulched with threshed naked barley straw (600 g/m2) for the entire season (SM, Fig. 1(d)). All plots were separated by a 1-m buffer zone. In each experimental year, new mulching materials were applied in April for all treatments, and mulching materials were removed from the FM and SM treatments after seed harvest. No irrigation or fertilizers were applied and weeds were controlled manually.
Sampling and measurements
Measurement of soil mean temperature and soil water content
On 5 April 2014, a set of mercury-in-glass geothermometers with bent stems (Hongxing Thermal Instruments, China) were embedded in the soil at a depth of 10 cm between plant rows to monitor soil temperature. Daily soil temperature was recorded manually at 8:00–8:30 h, 14:00–14:30 h and 20:00–20:30 h. Mean soil temperature for each day was calculated as the mean of the three daily readings.
In each growing season, soil water content was measured gravimetrically from a core of soil 20 cm deep from each plot at the seven stages of perennial vetch development, beginning when plants turned green and ending at seed maturity. In each plot, five soil cores (4 cm diameter) from 0 to 20 cm soil layer were collected from randomly selected locations. Gaps in soil remaining from soil probing were immediately refilled with soil from the adjacent buffer zone after soil sampling. Gravimetric soil water content was calculated on an oven (105 °C) dry weight basis, then expressed as % soil water content (Liu et al., Reference Liu, Jin, Zhou, Jia, Li, Xiong and Li2009).
Measurement of soil nutrients
In each growing season, soil samples from the top 20 cm were used to measure soil available N (sum of nitrate [NO3−-N] and ammonium [NH4+-N]) and available P at the flower bud formation stage (BBCH scale 51, general), full flowering stage (BBCH scale 65, general) and maturity stage (BBCH scale 89, general) defined in the following sub-section (Lancashire et al., Reference Lancashire, Bleiholder, van den Boom, Langelüddeke, Stauss, Weber and Witzenberger1991). On each sampling occasion, five core samples (depth 20 cm) were taken randomly in each plot using a soil auger and mixed to produce a composite sample. Each soil sample was passed through a 2 mm sieve. The soil samples (approximately 200 g) were air-dried for 7 days in the laboratory before analysing soil available N and P.
Soil available nitrogen (sum of NO3−-N and NH4+-N) was determined using the method of Li et al. (Reference Li, Song, Jjemba and Shi2004a). Soil samples were extracted by shaking with 50 ml 2 mol/l potassium chloride (KCl) solution (1 : 10 soil : solution ratio) for 1 h at 200 rev/min followed by filtration. Extracted samples were analysed for NO3−-N and NH4+-N using an automated flow injection analyser (FIAstar 5000 Analyser, FOSS Analytical Inc., Denmark).
Soil available P was determined using the Olsen method (Olsen et al., Reference Olsen, Cole, Watanabe and Dean1954). Soil samples were extracted by shaking with 50 ml 0.5 mol/l sodium bicarbonate (NaHCO3) at pH 8.5 solution (1 : 20 soil : solution ratio) for 30 min at 200 rev/min followed by filtration. Following extraction, the concentration of available P was determined photometrically in the presence of phosphorus molybdenum blue reagent using a spectrophotometer (UV2550, Shimadzu, Japan) at 660 nm.
Measurement of plant growth stage
The standardized plant development stage system used by Lancashire et al. (Reference Lancashire, Bleiholder, van den Boom, Langelüddeke, Stauss, Weber and Witzenberger1991) and Shen (Reference Shen2015) was used to identify the vegetative and reproductive stages during the entire growing season for perennial vetch. The BBCH-scale is a system using a uniform code for the description of phenologically similar growth stages of all mono- and dicotyledonous plant species. In each growing season, 40 perennial vetch plants in each plot were marked by tying a plastic label to the plant and development monitored. Growth stages were: turning green stage (50% of plants turned green, BBCH scale 09, general), branching stage (50% of plants branching, BBCH scale 21, general), flower bud formation stage (50% of plants with flower buds outside leaves, BBCH scale 51, general), initial flowering stage (30% of plants flowering, BBCH scale 63, general), full flowering stage (50% of plants flowering, BBCH scale 65, general), pod-filling stage (50% of plants with green [young] pods, BBCH scale 75, general), and maturity stage (70% of seed matured, BBCH scale 79, general).
Measurement of net leaf photosynthetic rate
Net leaf photosynthetic rate (P n, μmol/m2/s) was measured for five mature leaves (one leaf per plant) per plot at each development stage. The P n measurements were performed on the third fully expanded mature leaf on a branch, using an LI-6400 portable photosynthesis system (LI-COR Inc., USA). Measurements were made between 09:00 and 11:30 h on sunny days and the photosynthetic photon flux density was adjusted to 1600 to 2000 µmol/m2/s with 10% blue light (LI 6400-02B, light-emitting diode red-blue light source).
Measurement of plant height, leaf area index and above-ground dry matter
At each development stage, ten perennial vetch plants were chosen randomly and marked (by tying a plastic label to the plant) for the measurement of plant height in each plot.
A ceptometer (model AccuPAR LP-80, Decagon Devices, Pullman, USA) was used to measure leaf area index (LAI) of perennial vetch. One reading was taken above the canopy and four below from randomly selected locations in each plot, with orientation and inter-row position of the ceptometer according to the protocol proposed by Francone et al. (Reference Francone, Pagani, Foi, Cappelli and Confalonieri2014).
Above-ground dry matter (above-ground dry matter) of each growth stage was measured from a 1 m2 area in each plot. The above-ground dry matter was heated at 105 °C for 30 min and dried to a constant weight in a fan oven at 75 °C, and then was calculated as kg/ha.
Measurement of shoot biomass, seed yield and yield components
At seed maturity, the shoot biomass and seed yield were measured separately for all plants selected from a 4 m2 sample in each plot. The dry matter of shoot and root samples were heated at 105 °C for 30 min and dried to a constant weight in a fan oven at 75 °C. Seeds were separated from the pods, air-dried for 1 week in the laboratory and weighed. Seed yield was determined at 5.4% moisture content, then expressed as kg/ha. Seed yield components and harvest index were measured on a 1 m2 sample from the 4 m2 samples where seed yield was to be determined in each plot.
Measurement of root biomass
At harvest, the whole root system of six perennial vetch plants was dug up from the 4 m2 sampling area in each plot. The depth of roots depended on the mulching treatments. The range of effective root distribution in the soil was 0–60 cm among the four treatments during the 3 years. Root biomass was determined based on the average of four plot replicates. Root samples were heated at 105 °C for 30 min and then dried to a constant weight in a fan-oven at 75 °C. The root-to-shoot ratio was also calculated.
Measurement of evapotranspiration
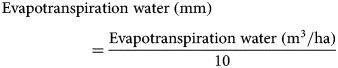
Seasonal evapotranspiration (mm) of perennial vetch was estimated through soil water balance. The water balance can be calculated using Eqn (1) according to Sincik et al. (Reference Sincik, Candogan, Demirtas, Büyükcangaz, Yazgan and Göksoy2008) as follows:

where Pr is total precipitation (mm) and Δsoil water storage is the change in 0–100 cm soil water storage (mm) between the beginning and end of the experiment. Soil sampling was performed twice in each growing season, once at the beginning and again at the end of the experiment (at harvesting), to measure soil water storage (mm) in the 0–100 cm layer. Five samples were taken in each plot at intervals of 20 cm for a profile of 0–100 cm (well below the effective root zone 0–60 cm) and soil water storage was calculated by multiplying the soil volumetric water content by soil profile depth (Wang et al., Reference Wang, Song, Li, Hu, Liu, Zhang, Wang and Davies2015b).
Measurement of water productivity
Crop water productivity refers to the output (e.g. crop yield, economic net benefit) with respect to the total water input in crop production. The output is quantified in terms of physical yield or economic returns, and the water input is the seasonal evapotranspiration water (Ali and Talukder, Reference Ali and Talukder2008; Gu et al., Reference Gu, Li and Du2018). For the perennial vetch crop, water productivity was calculated as the ratio of seed yield per unit of water delivered by seasonal evapotranspiration (Sincik et al., Reference Sincik, Candogan, Demirtas, Büyükcangaz, Yazgan and Göksoy2008; Pereira et al., Reference Pereira, Cordery and Iacovides2012) using Eqns (2) and (3) given below:

Statistical analyses
All data analysis was completed using two-way (year × treatment) analysis of variance (P < 0.05) with the ANOVA packages of SPSS® version 17.0 (IBM Corporation, USA). The homoscedasticity of the variables was determined by the Levene test. Significance was estimated based on the results of F-test and Duncan's new multiple range test using LSD. Multiple linear regression was used to analyse average soil mean temperature at 0–10 cm (mean soil temperature, °C) from the turning green stage to initial flowering and average soil water content at 0–20 cm (w/w, %) of four specific growth stages (the turning green stage, branching, flower bud formation and initial flowering) on the P n (μmol/m2/s) and the above-ground dry matter (kg/ha) at the initial flowering stage in the perennial vetch cultivation across treatments and years. Multiple linear regression was also used to analyse average mean soil temperature (°C) from the turning green stage to maturity and average soil water content (w/w, %) of seven specific growth stages on the P n, above-ground dry matter, seed yield and yield components at the maturity across treatments and years. In the analysis, mean soil temperature and soil water content were independent variables, and P n, above-ground dry matter, seed yield and yield components were dependent variables, respectively. The relative contribution/importance of the mean soil temperature and soil water content variables in contributing to these productivity traits were examined through the separation of the contribution of each explanatory variable towards the R 2 of the model referring to Ye et al. (Reference Ye, Ng and Lian2015).
Results
Weather conditions
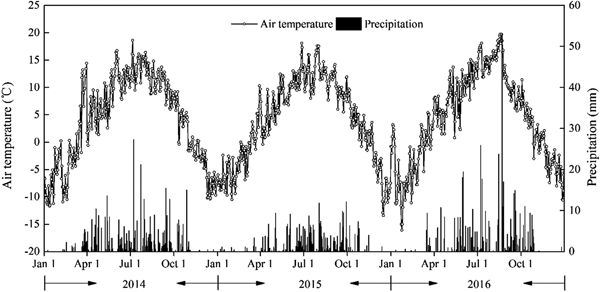
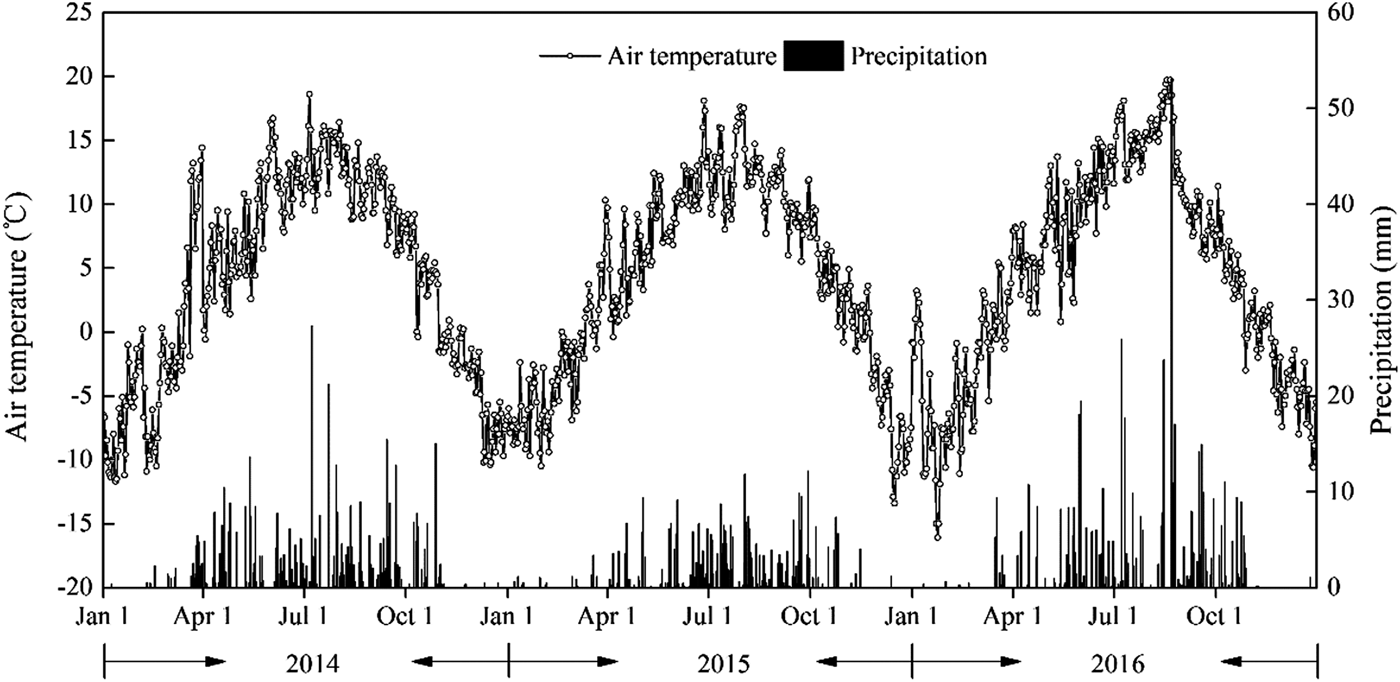
Daily meteorological data during the three experimental seasons are presented in Fig. 2. During the growing period for perennial vetch (April–September) in 2014, 2015 and 2016, precipitation was 382, 314 and 430 mm, respectively. Precipitation in 2015 and 2016 was 21.1% lower and 8.1% higher, respectively, than the average over the last 30 years (397 mm, 1984–2013), while that in 2014 was near to average. Therefore, 2015 was regarded as a dry year and 2016 as a wet year. Mean air temperature over the growing season was 10.1, 9.8 and 11.4 °C in 2014, 2015 and 2016, respectively. Air temperatures varied greatly from 1 month to another. Air temperatures were lower in April and May (4.9 and 8.1 °C, respectively) than in June–August (13.0 °C). The temperatures decreased to 9.5 °C in September.
Daily mean air temperature and precipitation in 2014, 2015, and 2016 at the Xiahe Experiment Station, China.
Soil mean temperature, soil water content and soil nutrient
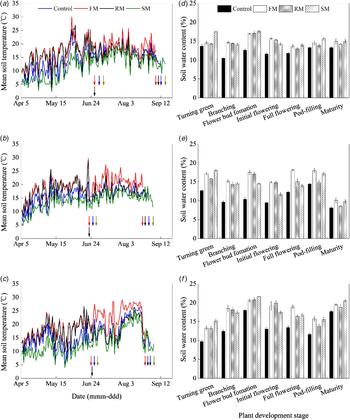
Soil mean temperature in the 0–10 cm depth (mean soil temperature, °C) was affected by year and treatment (P < 0.001) (Figs 3(a)–(c)). Averaged across treatments, mean soil temperature was greater in 2015 and 2016 than in 2014 (P < 0.001). Averaged across years, compared to the control (16.2 °C), the FM treatment increased mean soil temperature by 3.5 °C (P < 0.001) and the SM treatment decreased mean soil temperature by 2.3 °C (P < 0.05), but the RM treatment did not affect mean soil temperature significantly. During the reproductive period (from the initial flowering to maturity), mean soil temperature, as compared to the control (17.9 °C), was 3.3 °C greater (P < 0.05) with the FM treatment, and not significantly different from that with the RM and SM treatments.
Soil mean temperature 0–10 cm (°C) as affected by mulching treatments in (a) 2014, (b) 2015 and (c) 2016, respectively. Arrows indicate dates for the beginning and end of the reproductive stage (initial flowering to maturity, respectively) of perennial vetch. Control, non-mulched control; FM, plastic film mulch for the entire season; RM, plastic film mulch cover until 30% flowering; SM, naked barley straw mulch for the entire season. Soil water content 0–20 cm (w/w, %) as affected by mulching treatments at plant development stages in (d) 2014, (e) 2015 and (f) 2016, respectively. Error bars represent standard errors of the means (n = 4).
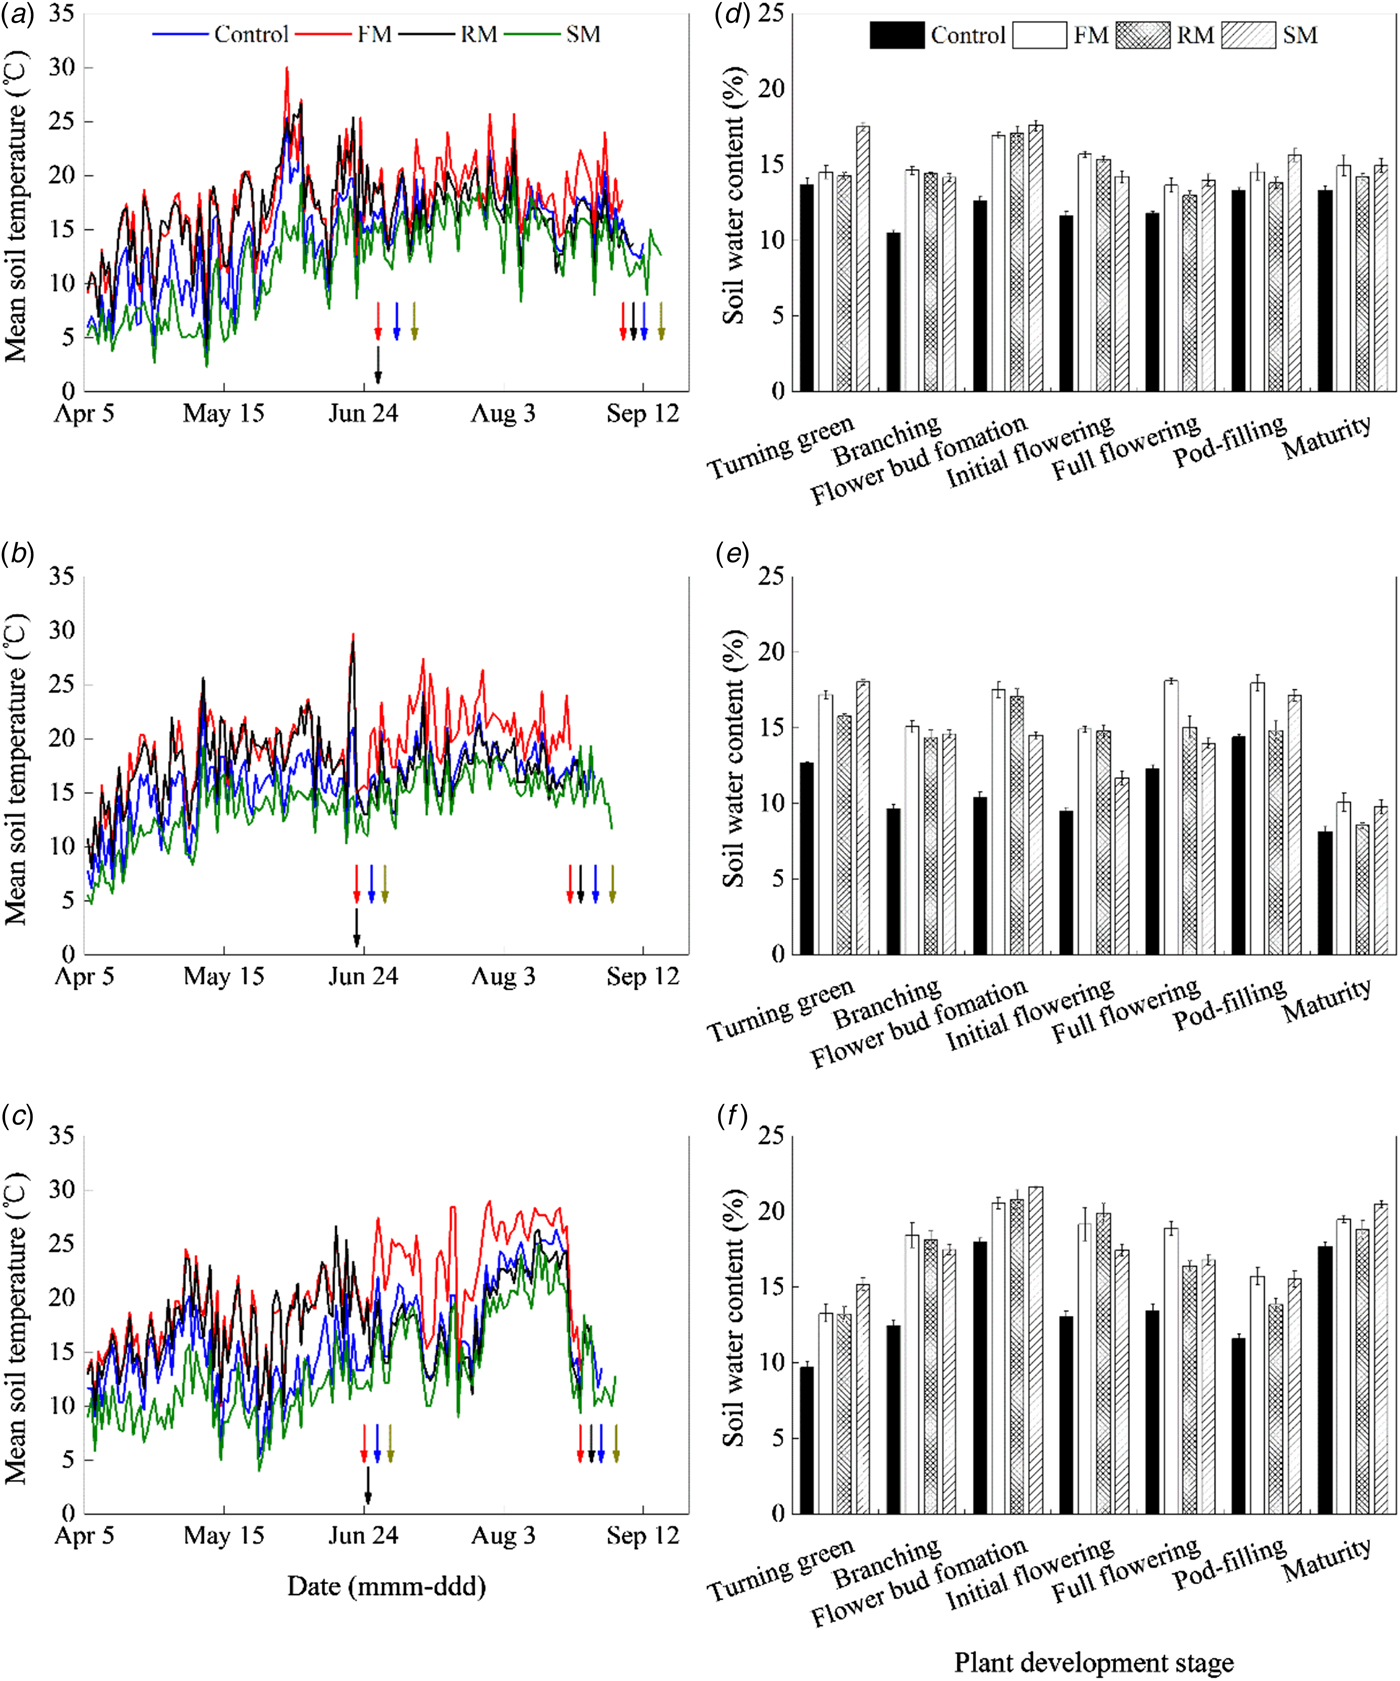
Soil water content in the 0–20 cm depth (soil water content, w/w, %) was affected by treatment, year and their interaction (P < 0.001) (Figs 3(d)–(f)). On average for the three mulching treatments, the greatest soil water content values were obtained in 2016, followed by 2014 and 2015 (P < 0.001). Averaged across years and stages of plant development, soil water content was greater with the FM, SM and RM treatments than the control. The FM treatment had greater soil water content than the RM treatment (P < 0.05). Compared to 2014 and 2016, there was a significant (P < 0.001) decrease in soil water content at the maturity for all mulching treatments in 2015 (dry year). Nevertheless, in 2015 at the maturity, soil water content with the FM and SM treatments was significantly greater than that of the control (P < 0.05), and soil water content with the FM treatment was greater than that of the RM treatment (P < 0.05).
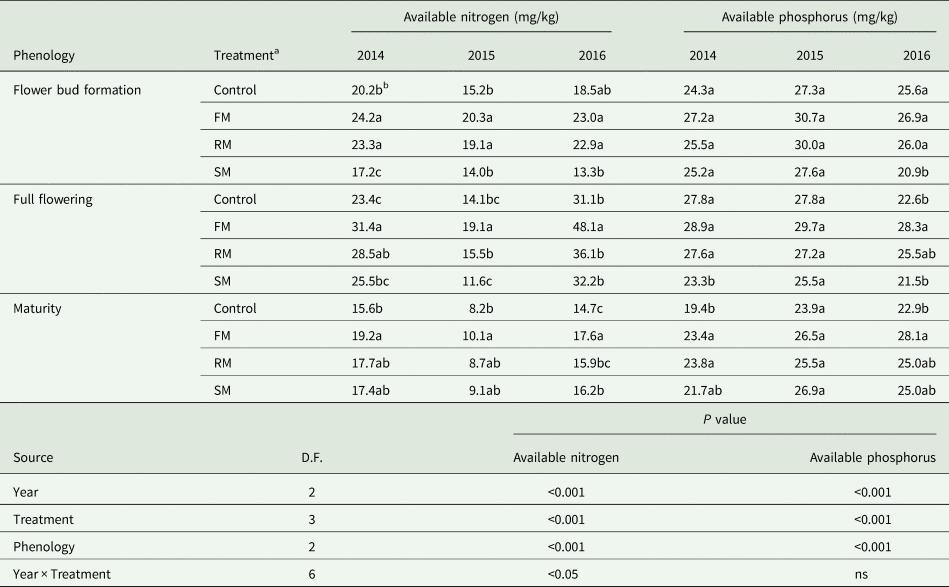
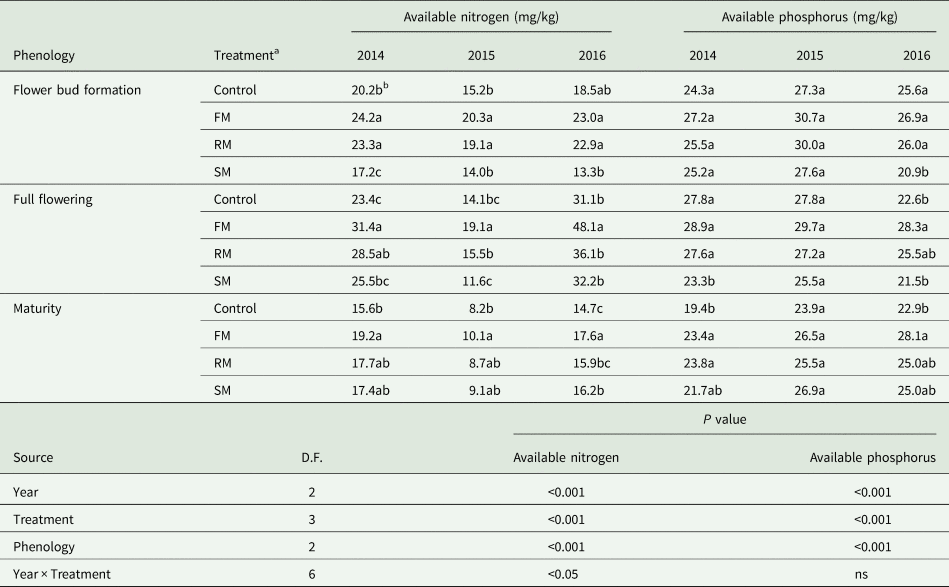
Soil available nitrogen and phosphorous varied among treatments in each year as shown in Table 2. The available nitrogen and available phosphorus were affected significantly (P < 0.001) by the main effects of year, treatment and phenology, while available nitrogen was also significantly (P < 0.05) affected by the year × treatment interaction. The available nitrogen was lower in 2015 than in 2014 (P < 0.001) and 2016 (P < 0.001) but was greater in 2016 than in 2014 (P < 0.001). Averaged across years, the FM and RM treatments had greater (P < 0.001) available nitrogen than the control, increased by 32.2 and 16.6%, respectively. The RM treatment had greater (P < 0.001) available nitrogen than the SM treatment, but the RM treatment had less (P < 0.001) available nitrogen than the FM treatment. In 2016 (wet year), available nitrogen with the FM and RM treatments was not significantly different from the control. There was a greater (P < 0.001) available nitrogen at the full flowering than at the flower bud formation and maturity, and available nitrogen was less (P < 0.001) at maturity than at flower bud formation. The available phosphorus was greater in 2015 than in 2014 (P < 0.001) or 2016 (P < 0.001). Averaged across years, the FM and RM treatments had greater available phosphorus than the control: 12.8% (P < 0.001) and 6.6% (P < 0.05) higher, respectively. The RM treatment had greater (P < 0.01) available phosphorus than the SM treatment, but the RM treatment had less (P < 0.05) available phosphorus than the FM treatment. There was a greater (P < 0.01) available phosphorus at flower bud formation and full flowering than at maturity.
Soil available nitrogen (mg/kg) and available phosphorus (mg/kg) as affected by the control and FM, RM and SM treatments at the stage of flower bud formation, full flowering and maturity in 2014, 2015 and 2016
D.F., degrees of freedom.
P value, significance level; ns, not significant.
a Control, non-mulched control; FM, plastic film mulch for the entire season; RM, plastic film mulch cover until 30% flowering; SM barley straw mulch for the entire season.
b Within a column for each growth stage at each year, values followed by different letters are significantly different according to Duncan's new multiple range test (P < 0.05).
Plant development
Plant growth stages
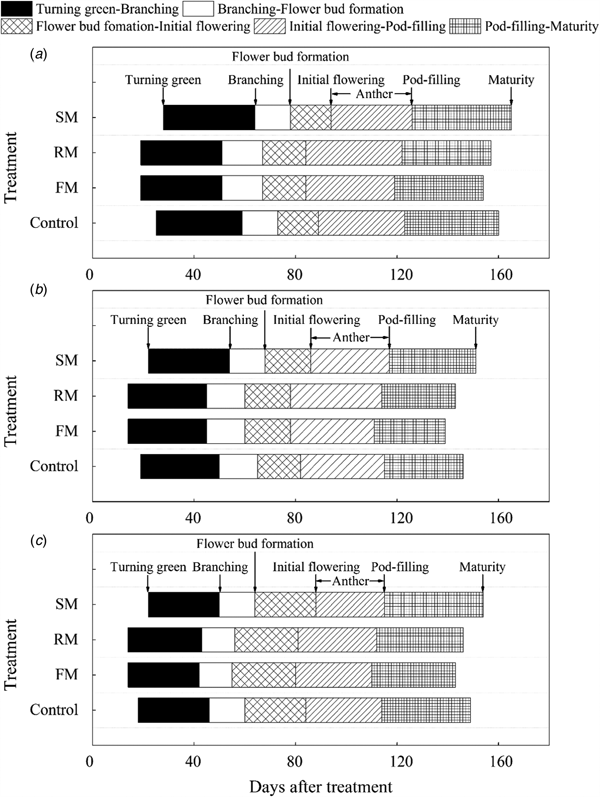
Time and duration of plant development stages differed among treatments and could be due to differences in mean soil temperature and soil water content (Figs 4(a)–(c)). Across the 3 years, average duration from the turning green stage to maturity was 131 days for the control, which was 1.3 days longer than in the FM treatment, and 2 and 1.7 days shorter than in the RM and SM plots, respectively. Plants in the FM and RM plots reached the turning green stage 5 days earlier compared to the control plots, whereas the SM treatment delayed the turning green stage by 3.3 days. Early greenness continued to the later stages. Initial flowering stage in the FM and RM plots was attained 4.3 and 4 days earlier, respectively than in the control plots, whereas it was delayed in the SM plots by 4.3 days. Compared to the control plots, the anther stage (AS) was 0.3 and 2.7 days longer in the FM and RM plots, respectively, but it was 2.3 days shorter in the SM plots. Meanwhile, the corresponding duration of podding-maturation period was 2.3 and 1 day shorter in the FM and RM plots, respectively, compared to the control plots, whereas it was 3 days longer in the SM plots.
Plant growth stages of perennial vetch as affected by mulching treatments in (a) 2014, (b) 2015 and (c) 2016, respectively. Control, non-mulched control; FM, plastic film mulch for the entire season; RM, plastic film mulch cover until 30% flowering; SM, hulless barley straw mulch for the entire season.

Net leaf photosynthetic rate
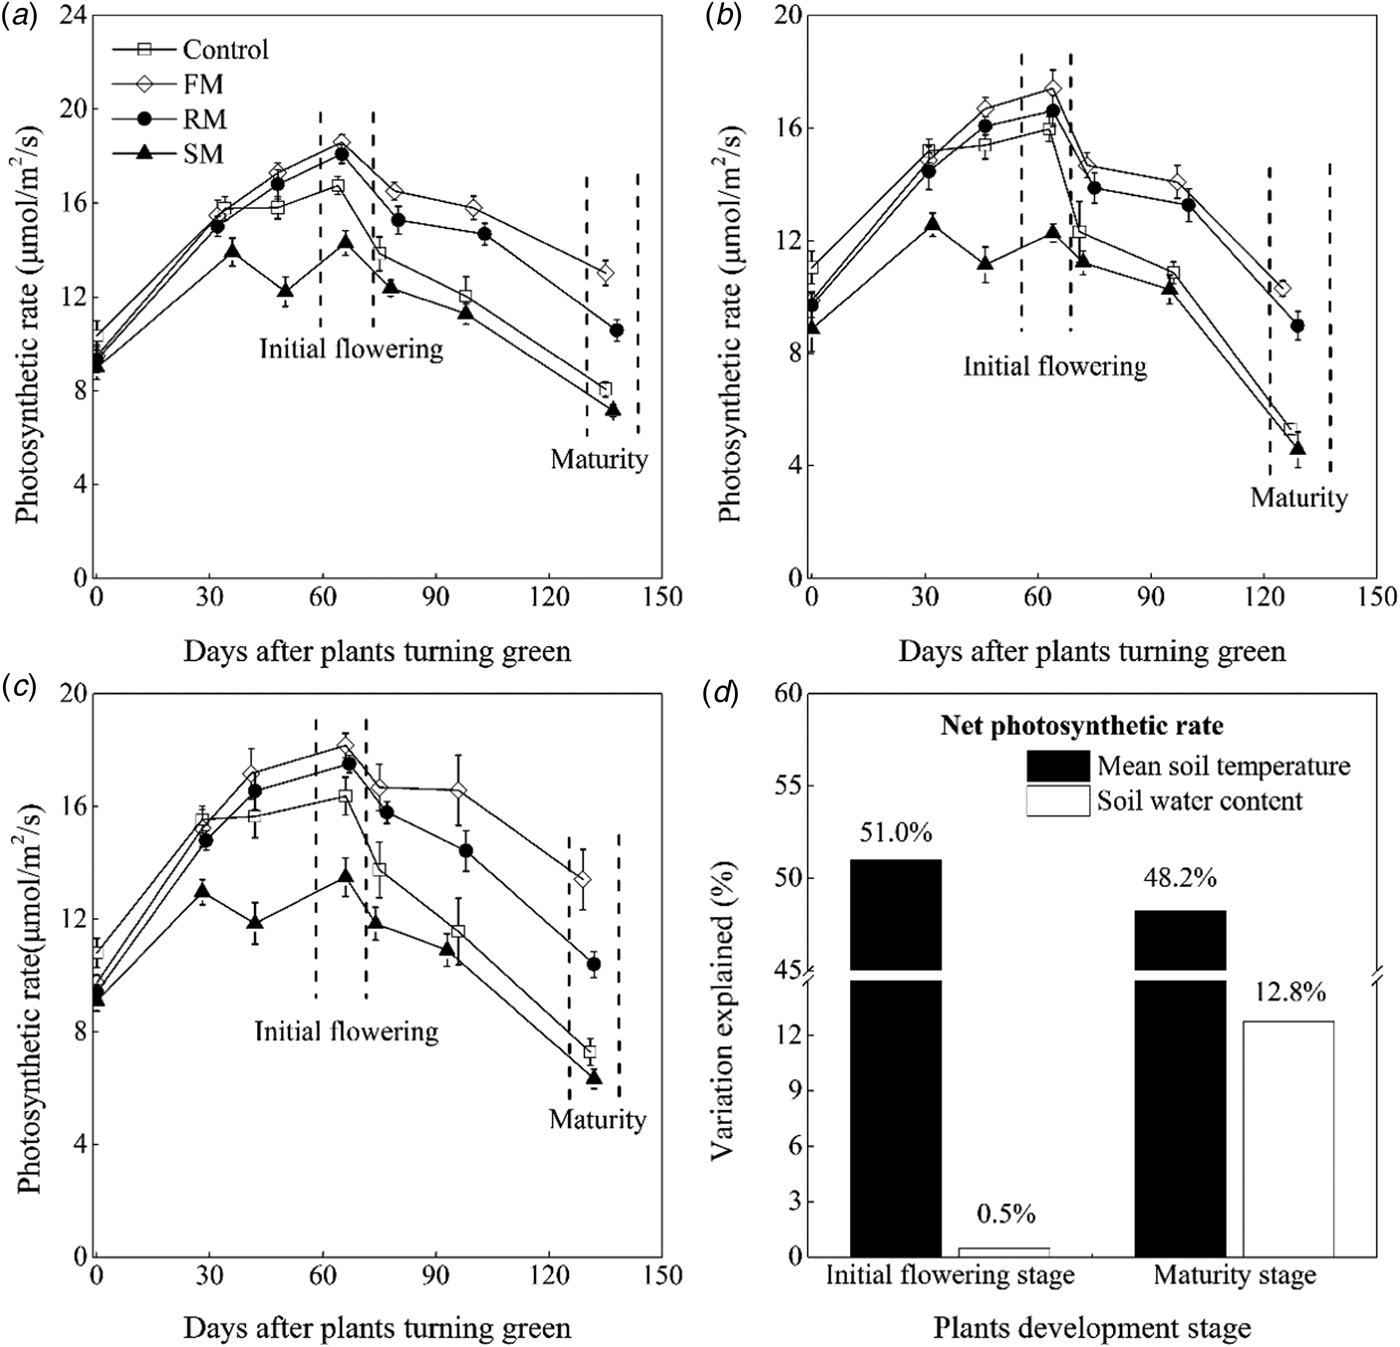
Net leaf photosynthetic rate (P n) of perennial vetch varied among treatments in each year (Figs 5(a)–(c)). The P n was significantly lower (P < 0.05) in 2015 than in 2014 and 2016. Averaged across years, P n of plants in the control was significantly lower (P < 0.05) than the FM and RM treatments, decreased by 15.4 and 8.2%, respectively, whereas the P n of plants in the control was 15.6% higher (P < 0.001) than the SM treatment. The P n of plants peaked at 30% flowering (initial flowering) and then declined over time.
Net photosynthetic rate (μmol/m2/s) of mature leaves of perennial vetch from the turning green stage to the maturity stage as affected by control, and FM, RM and SM treatments in (a) 2014, (b) 2015 and (c) 2016, respectively. Error bars represent standard errors of the means (n = 4). (d) Indicates contributions of the soil mean temperature 0–10 cm (°C) and soil water content 0–20 cm (w/w, %) to photosynthetic rate (μmol/m2/s) variations at the initial flowering stage and maturity stage, respectively.
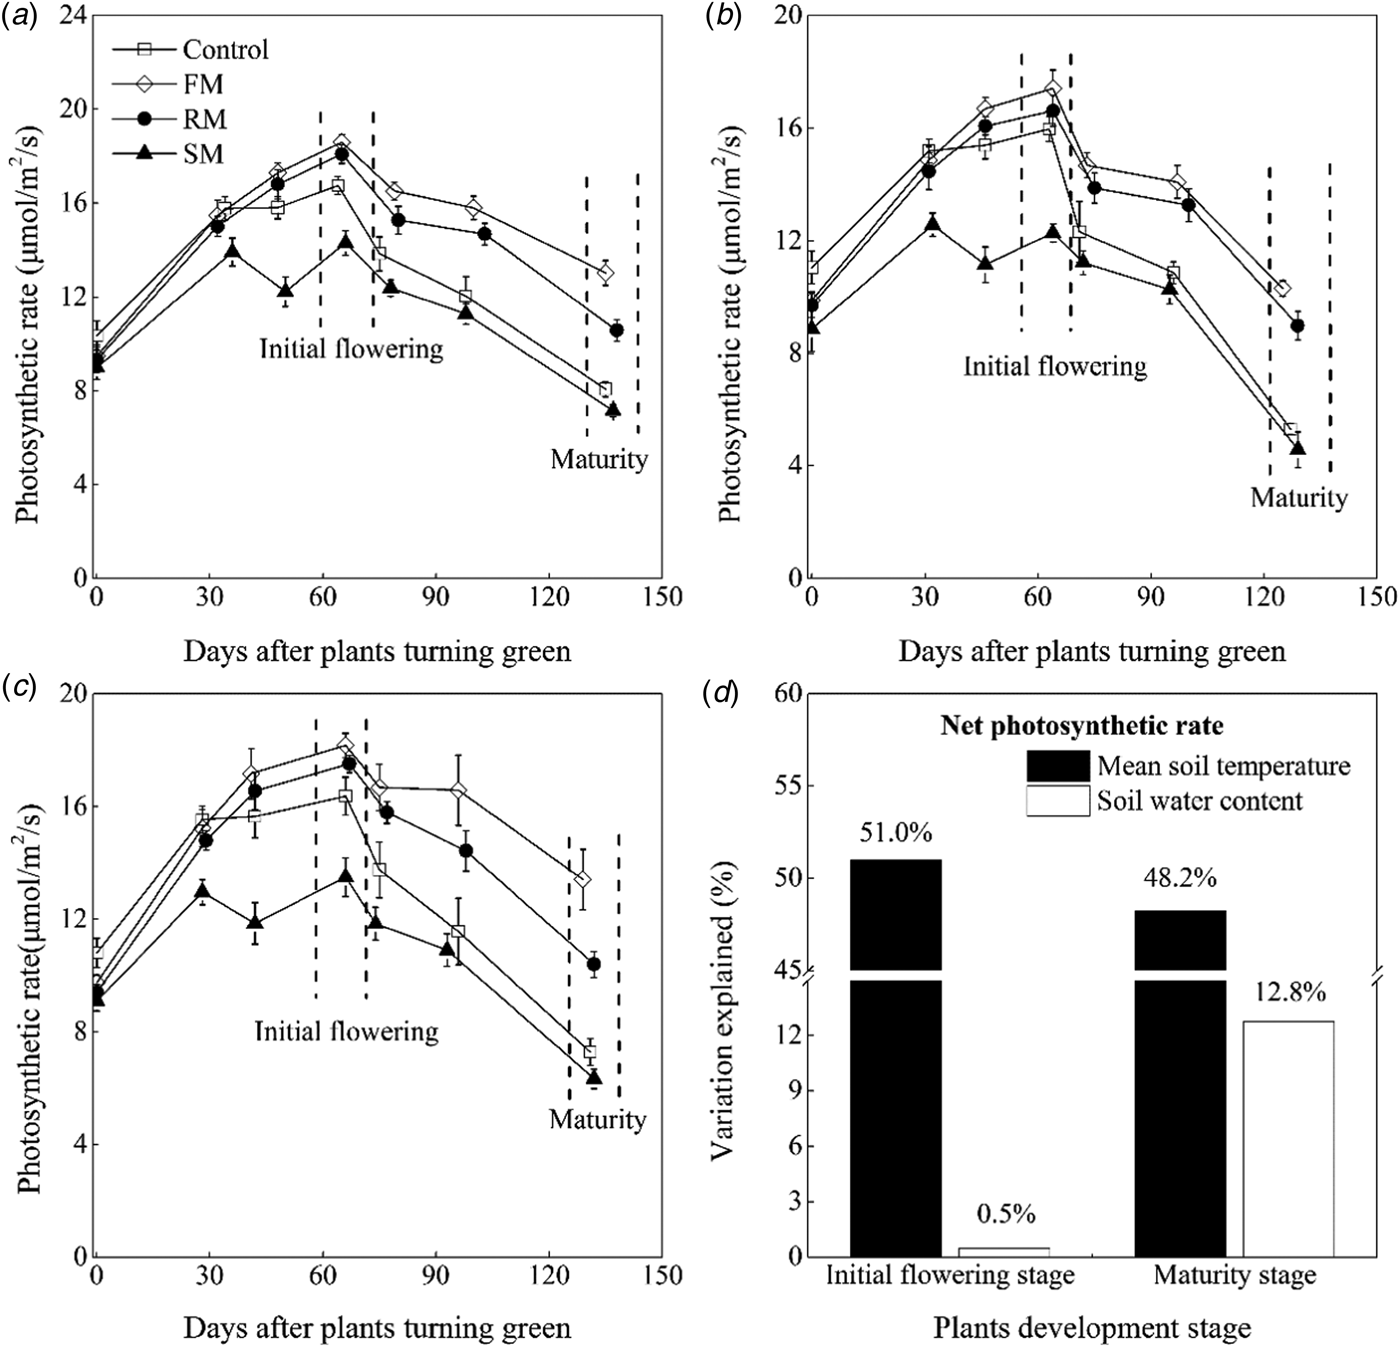
At initial flowering, averaged across years, the plants had 10.4 and 6.4% higher (P < 0.05) P n in the FM and RM treatments, respectively, than the control and there was a significant (P < 0.001) decrease of 18.4% in the SM treatment compared to the control. With leaf senescence, a continuous decline in P n occurred from initial flowering to maturity. At maturity, on average, the FM treatment still maintained the highest P n, followed by the RM treatment. The P n of plants in the FM and RM treatments was 1.8 and 1.5 times higher, respectively (P < 0.001) than that in the control. The P n of plants in the SM treatment was lower than the control, but there was no significant difference between them.
At initial flowering and maturity, multiple regression analysis found that 51.5 and 61.0% of the variations (P < 0.001) in P n, respectively, was explained by the contributions of mean soil temperature (°C) and soil water content (w/w, %). The mean soil temperature was significantly (P < 0.001) and positively correlated to the P n at two stages (relative importance = 51.0 and 48.2%, respectively), but soil water content was only significantly (P < 0.001) and positively correlated to the P n at the maturity (relative importance = 12.8%) (Fig. 5(d), Table 3).
Multiple regression analysis (Y = a 0 + a 1X 1 + a 2X 2) of average soil mean temperature 0–10 cm (°C) from turning green stage to 30% flowering stage (X 1) and average soil water content 0–20 cm (w/w, %) of four specific stages (turning green; branching; flower bud formation; and initial flowering) (X 2) on (A) the photosynthetic rate (μmol/m2/s) at 30% flowering stage (Y) during the 3 years of perennial vetch cultivation in various treatments and of average mean soil temperature (°C) from turning green stage to maturity stage (X 1) and average soil water content (w/w, %) of seven specific stages (turning green; branching; flower bud formation; initial flowering; full flowering; pod-filling and maturity) (X 2) on (B) the photosynthetic rate (μmol/m2/s) at maturity stage (Y) during the 3 years of perennial vetch cultivation in various treatments; The mean soil temperature and soil water content were independent (explanatory) variables, and the photosynthetic rate was dependent (response) variable
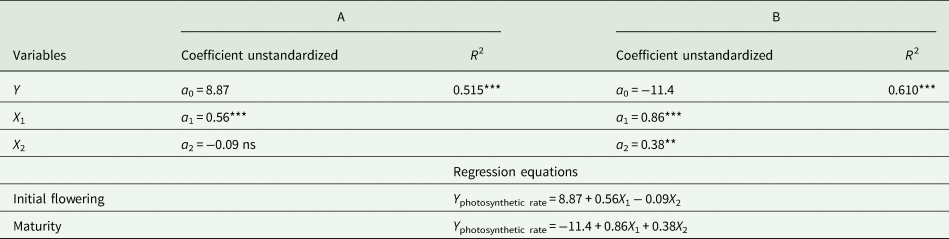
Results are taken from all mulching treatments across three growing seasons. ** and *** mean P < 0.01 and P < 0.001, respectively; ns, not significant. R 2, determination coefficient.
Crop growth
Plant height and leaf area index
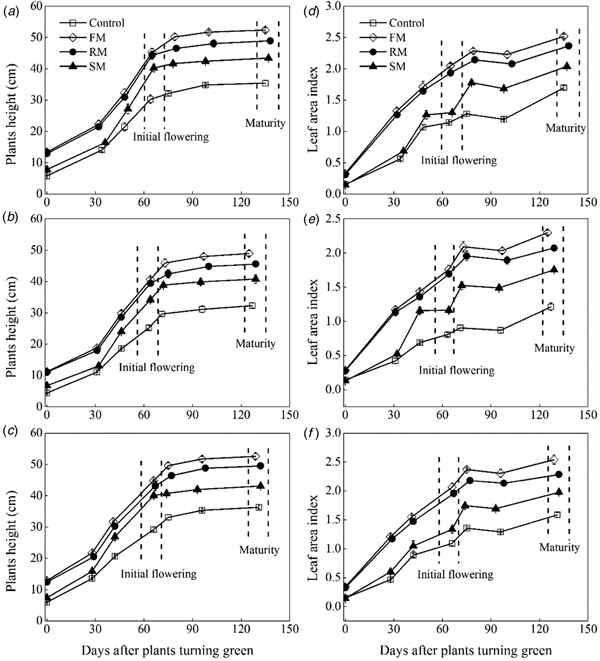
The change of plant height and LAI varied among the mulching treatments in 3 years (P < 0.001). Plant height of perennial vetch increased rapidly from the turning green stage to the initial flowering (Figs 6(a)–(c)). At initial flowering, averaged across years, the greatest plant height was observed in 2014, which was 1.8% (P = 0.761) and 14.7% (P < 0.05) higher than in 2016 and 2015, respectively. Plant height of the FM, RM and SM treatments were significantly higher (P < 0.001) than the control, increasing by 54.8, 49.8 and 35.3%, respectively. Plant height of the SM treatment was lower (P < 0.01) than the FM and RM treatments. Subsequently, a slow increase continued until maturity, with the trend of growth being similar at initial flowering.
Dynamics in plants height (cm) and leaf area index as affected by the control, and FM, RM and SM treatments in 2014 (a, d), 2015 (b, e) and 2016 (c, f), respectively. Error bars represent standard errors of the means (n = 4).
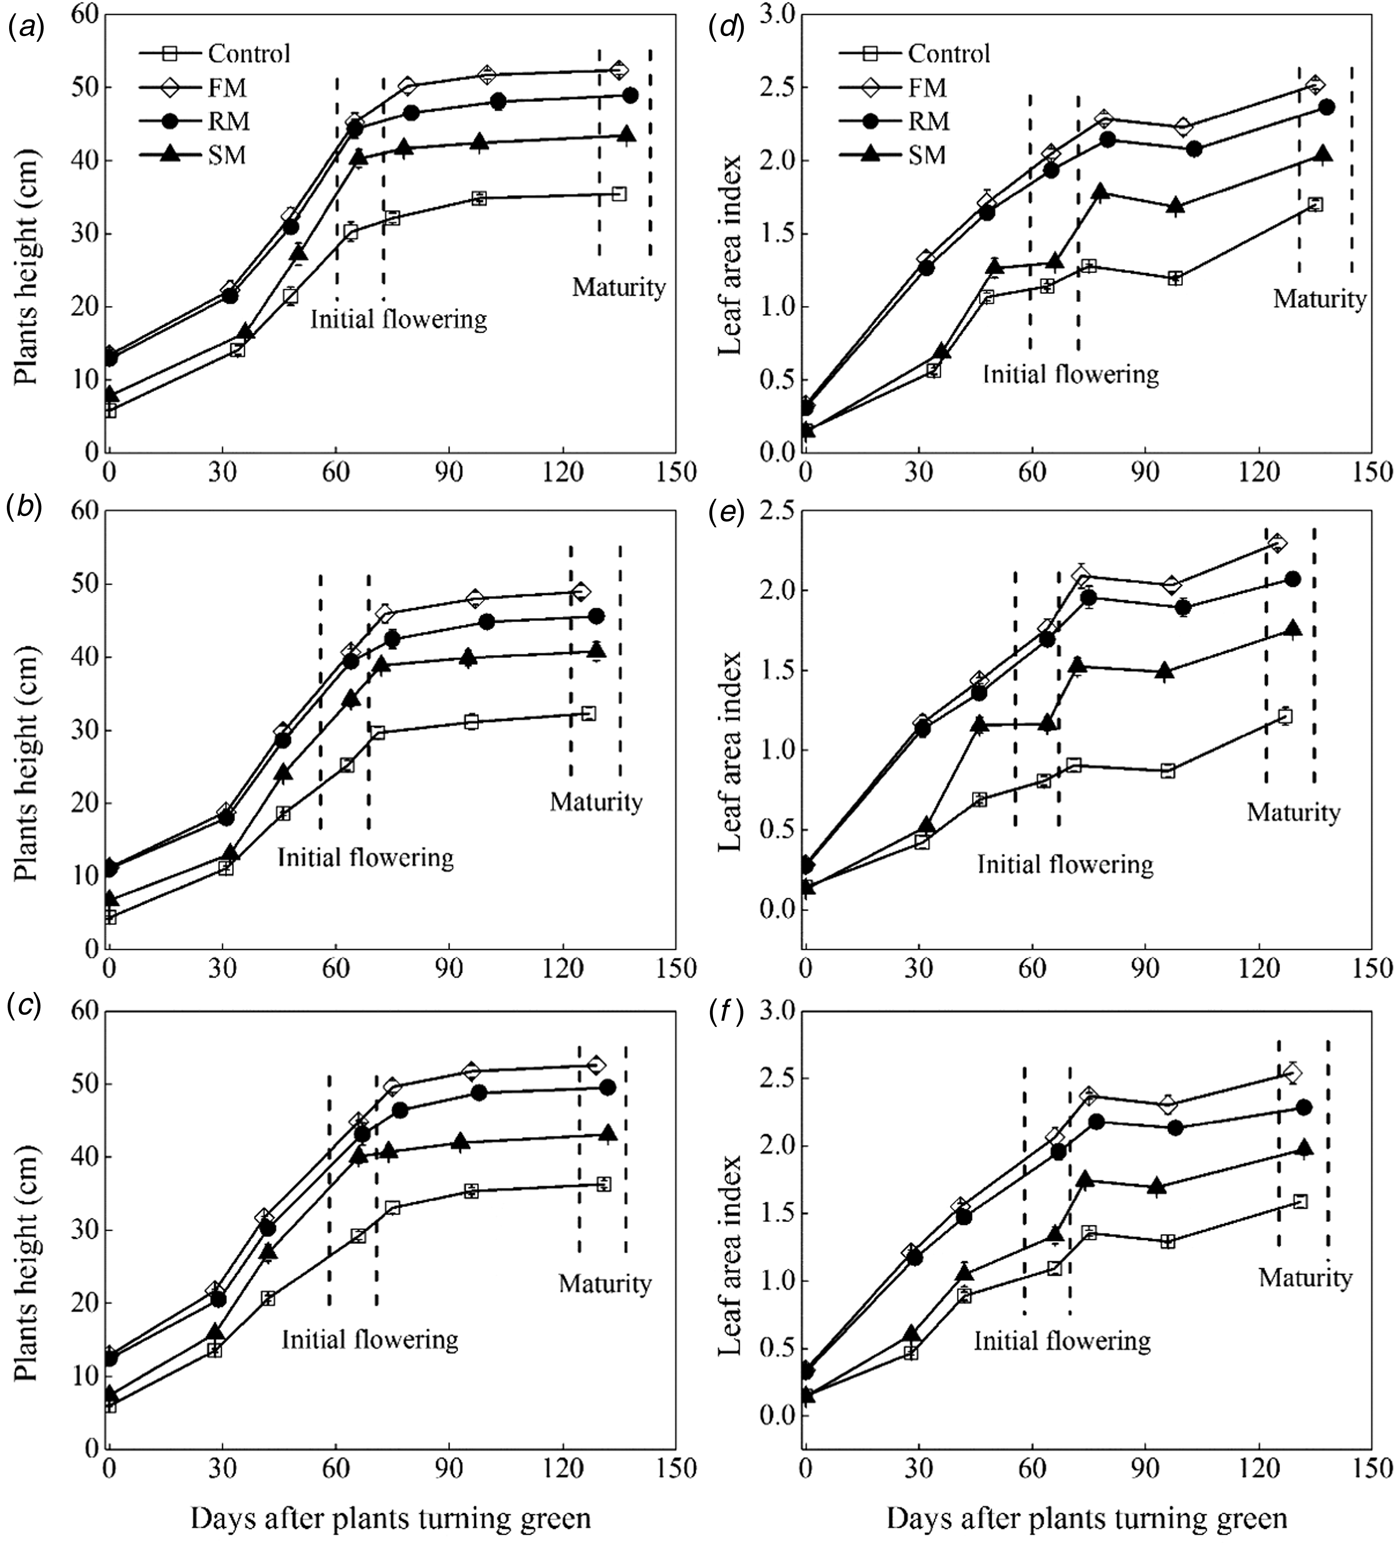
Leaf area index increased with increased plant height (Figs 6(d)–(f)). At initial flowering, averaged across years, the LAI of all mulching treatments were 1.1–2.2 times higher (P < 0.001) than the control. In addition, the LAI of the FM and RM treatments were significantly (P < 0.001) higher than the SM treatment. After the flowers had withered, all treatments showed a slow decline from full flowering to the pod-filling, but still maintained a higher (P < 0.05) level in all the mulching treatments compared with the control. At maturity, averaged across years, the LAI of the control plants was 1.3–1.6 times lower (P < 0.001) than that of all the mulching plots. In addition, the LAI of the RM treatment was significantly lower (P < 0.01) than the FM treatment, but higher (P < 0.001) than the SM treatment.
Above-ground dry matter and dry matter accumulation
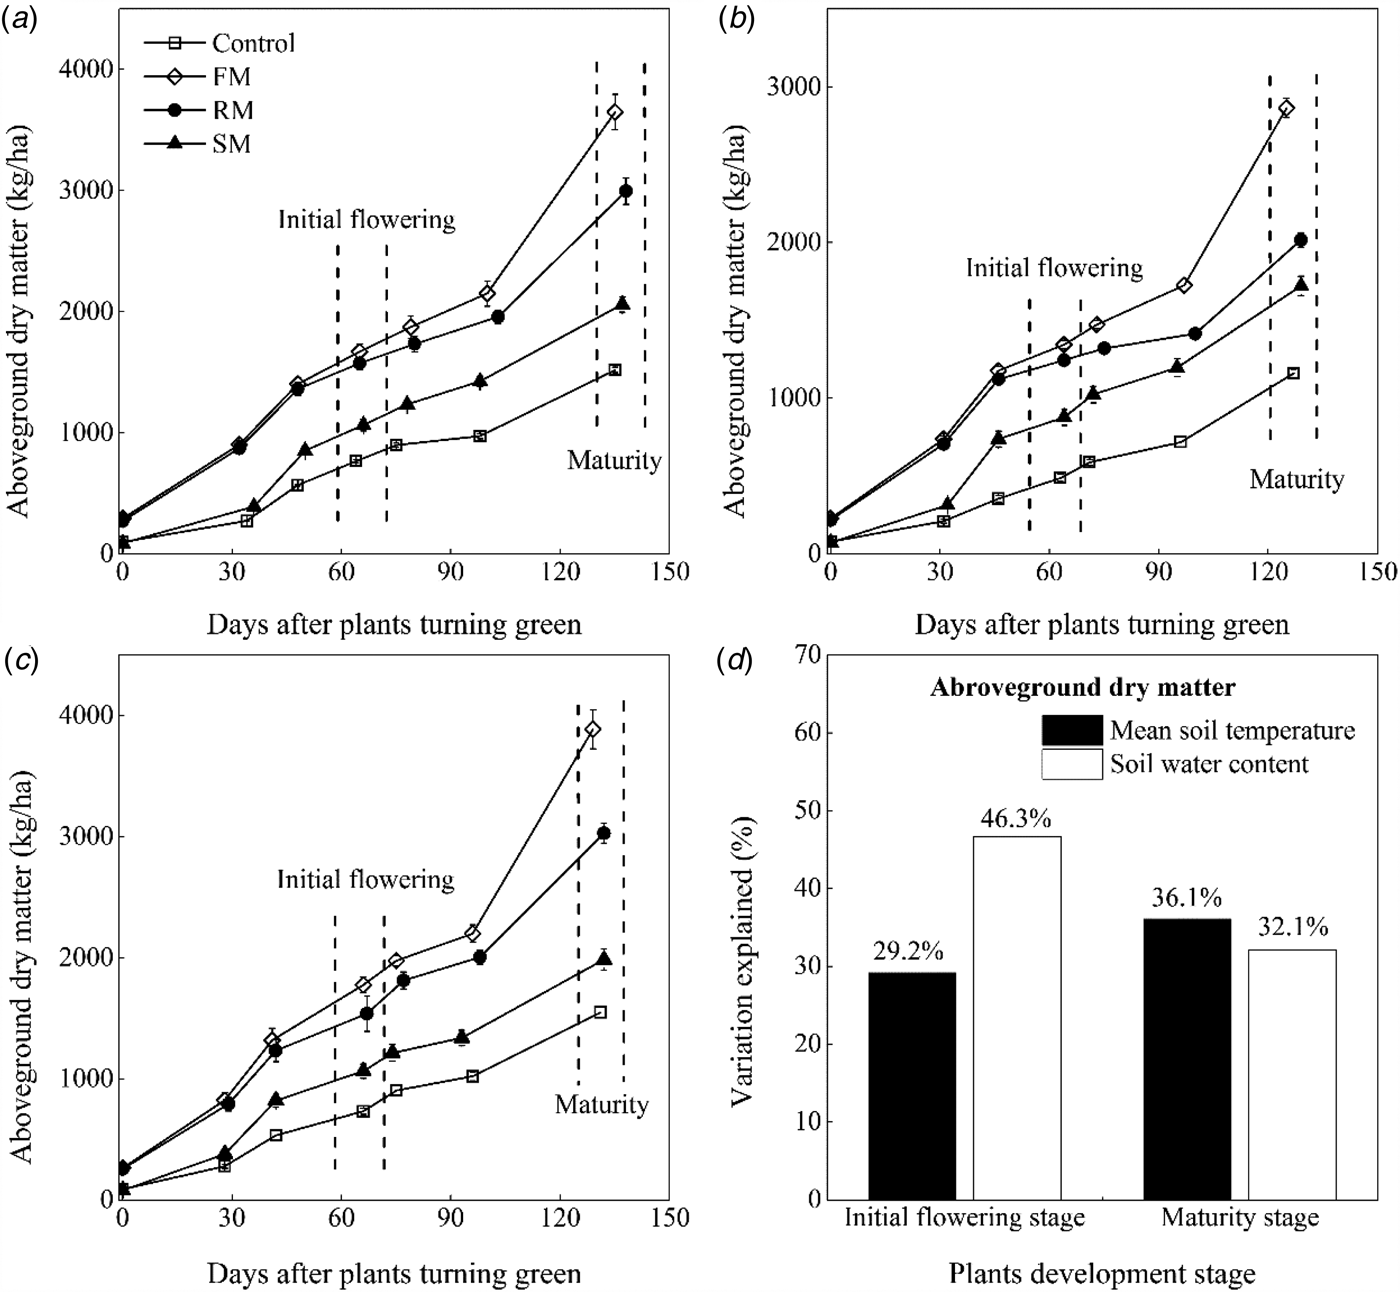
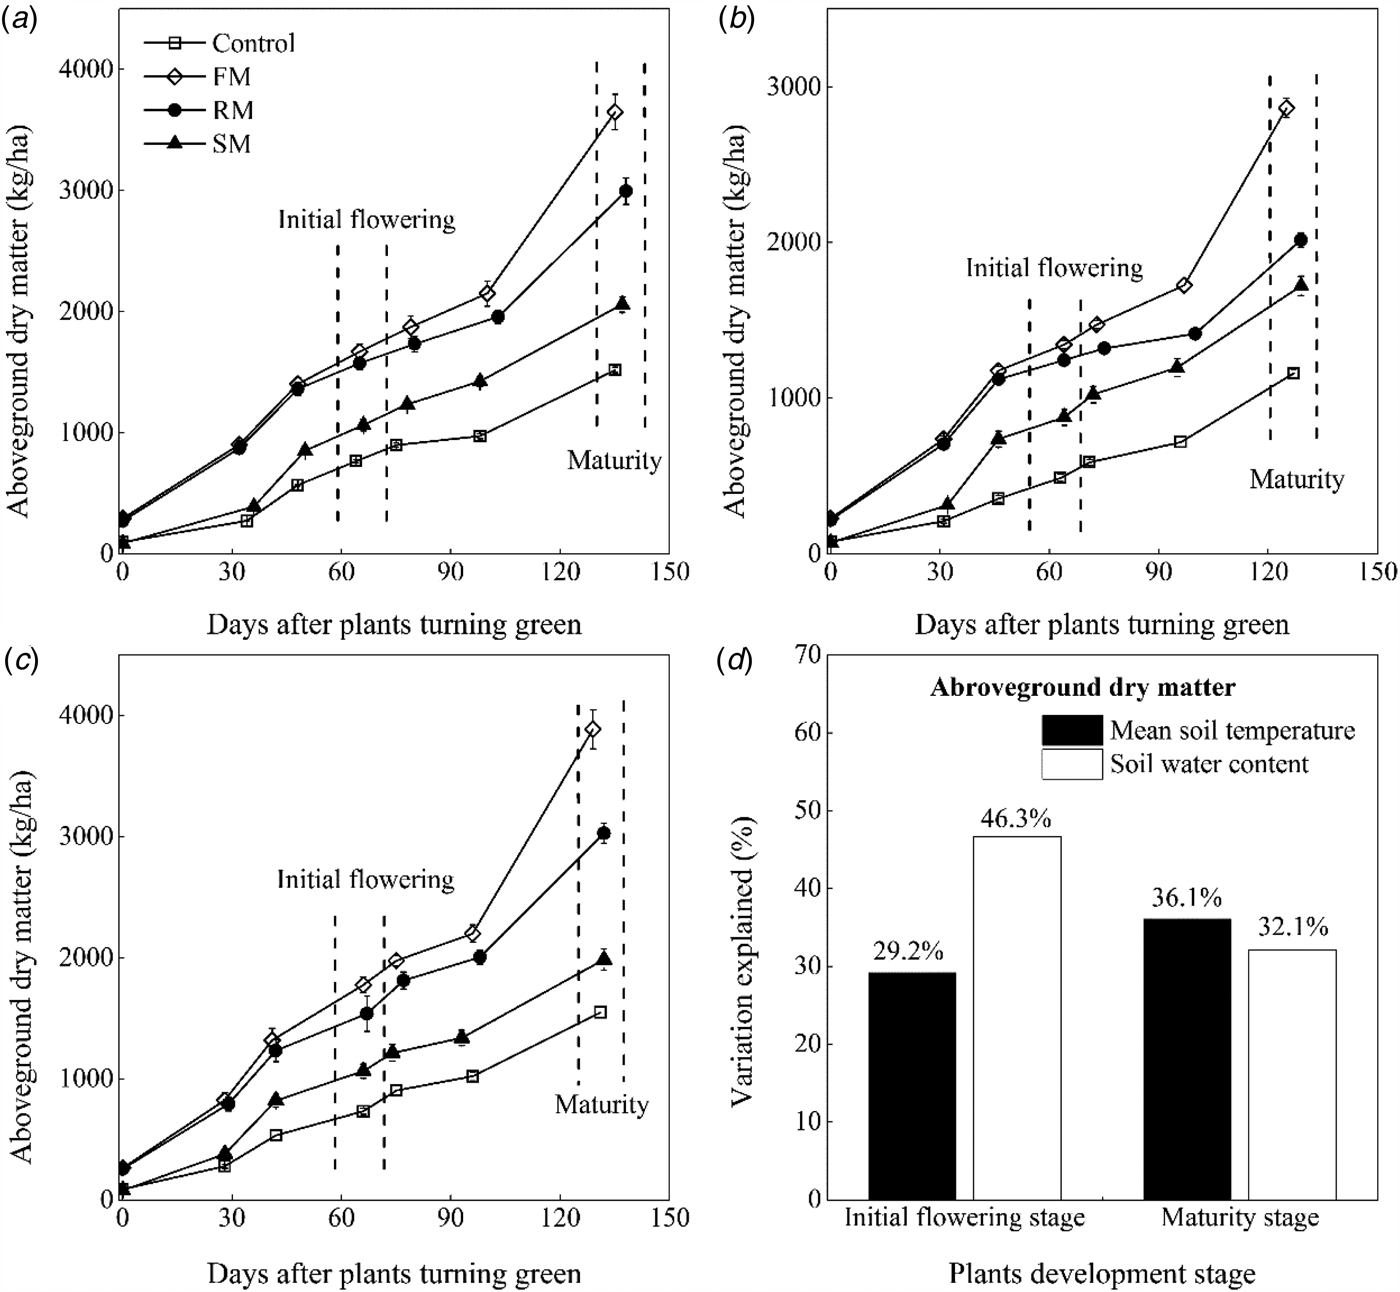
The above-ground dry matter increased with plant growth in the growing season, during which the above-ground dry matter was maintained at a greater (P < 0.05) value in the FM, RM and SM treatments than the control, except that values of the SM treatment were close to those of the control at the turning green stage (Figs 7(a)–(c)). Averaged across years, the above-ground dry matter was significantly greater (P < 0.001) in the FM and RM treatments than the SM treatment. The FM treatment had greater (P < 0.001) above-ground dry matter than the RM treatment from full flowering to maturity. At maturity, the above-ground dry matter was affected by year (P < 0.001) and treatment (P < 0.001). The above-ground dry matter was 31.7% (P < 0.05) and 34.6% (P < 0.05) greater, respectively, in 2014 and 2016 than in 2015. Averaged across years, the above-ground dry matter in the FM, RM and SM treatments was 3467.6, 2681.1 and 1922.6 kg/ha, or 146.0, 90.2 and 36.4% (P < 0.01) greater than that in the control (1490.6 kg/ha). The RM treatment had greater (P < 0.001) above-ground dry matter than the SM treatment, but RM treatment had less (P < 0.001) above-ground dry matter than the FM treatment.
Dynamics of above-ground dry matter (kg/ha) as affected by the control, and FM, RM and SM treatments in (a) 2014, (b) 2015 and (c) 2016, respectively. Error bars represent standard errors of the means (n = 4). (d) Indicates contributions of the soil mean temperature 0–10 cm (°C) and soil water content 0–20 cm (w/w, %) to above-ground dry matter (kg/ha) variations at the initial flowering stage and maturity stage, respectively.
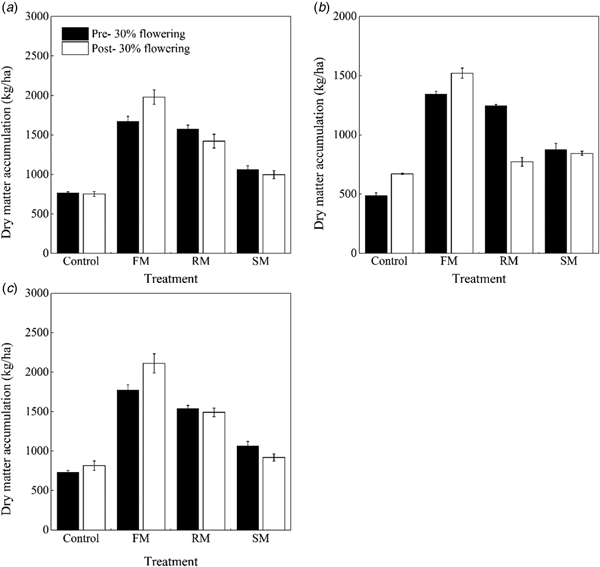
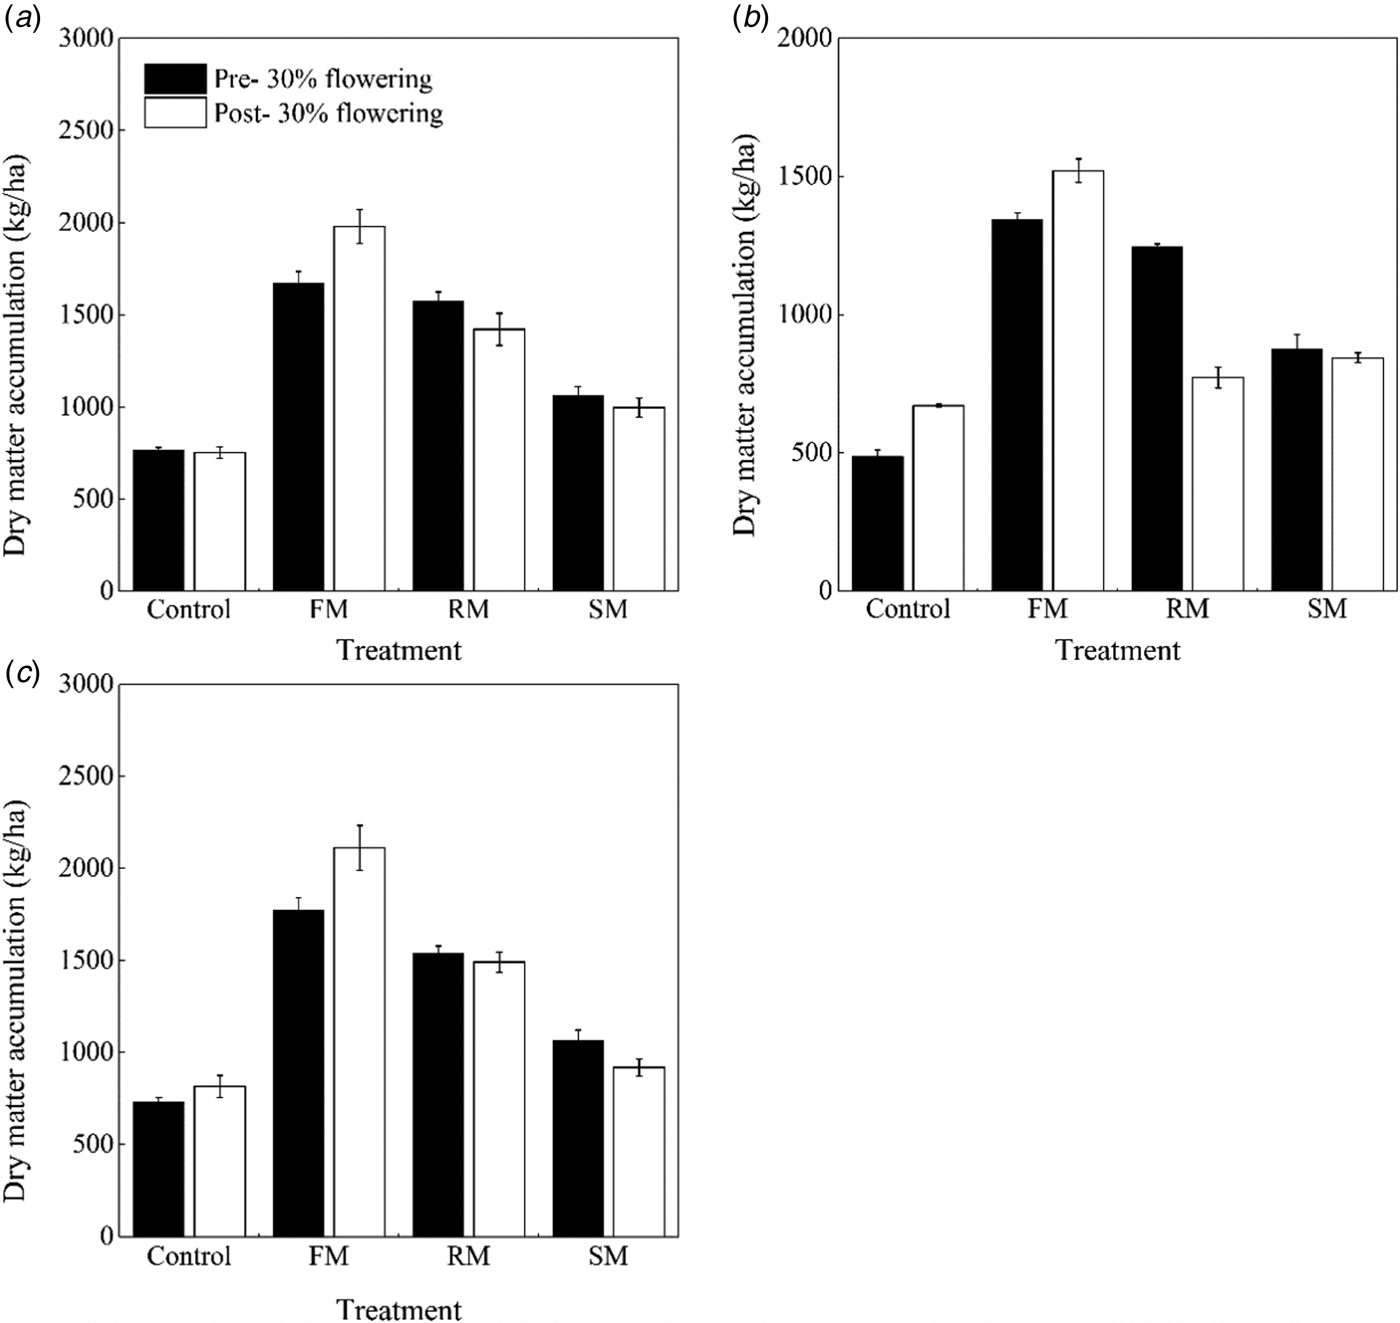
Furthermore, dry matter accumulation was affected by treatment (P < 0.001) and year (P < 0.001) at the 30% flowering stage (Figs 8(a)–(c)). Averaged across years, the dry matter that was accumulated in the FM, RM and SM treatments was 1596.9, 1452.3 and 1002.0 kg/ha, or 141.0, 119.2 and 51.2% (P < 0.001) greater than that in the control (662.6 kg/ha). The RM treatment had greater (P < 0.001) dry matter accumulation than the SM treatment, but the RM treatment had less (P < 0.001) dry matter accumulation than the FM treatment. The dry matter accumulation was significantly less (P < 0.001) in 2015 than that in 2014 and 2016, decreased by 22.1 and 22.6%, respectively. In addition, such effects by treatment (P < 0.001), year (P < 0.001) and their interaction (P < 0.001) in dry matter accumulation was observed at the post-30% flowering stage. Averaged across years, the dry matter accumulation in the FM, RM and SM treatments increased by 150.4% (P < 0.001), 64.5% (P < 0.001) and 23.2% (P < 0.01), respectively, compared with the control. The RM treatment had greater (P < 0.001) dry matter accumulation than the SM treatment, but the RM treatment had less (P < 0.001) dry matter accumulation than the FM treatment. However, in 2015 (dry year), there was a decrease in dry matter accumulation in the RM treatment compared with the SM treatment, by 8.5% (P = 0.054). The dry matter accumulation was significantly less (P < 0.001) in 2015 than that in 2014 and 2016, decreased by 26.0 and 28.7%, respectively.
Dry matter accumulation (kg/ha) at pre- and post-30% flowering stages as affected by the control, and FM, RM and SM treatments in (a) 2014, (b) 2015 and (c) 2016, respectively. Error bars represent standard errors of the means (n = 4).
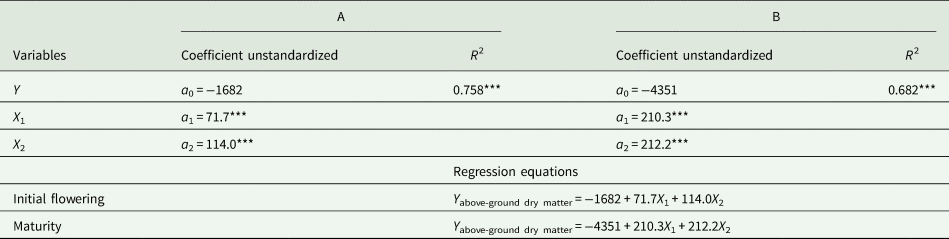
Multiple regression analysis found that 75.8 and 68.2% of the variation (P < 0.001) in above-ground dry matter at the initial flowering and maturity, respectively, was explained by the mean soil temperature (°C) and soil water content (w/w, %) (Fig. 7(d), Table 4). At initial flowering, the relative importance analysis of the mean soil temperature and soil water content in the contribution was significantly (P < 0.001) positive to explaining the above-ground dry matter, reaching 29.2 and 46.3%, respectively. At maturity, the above-ground dry matter was significantly (P < 0.001) and positively correlated to the mean soil temperature (relative importance = 36.1%) and soil water content (relative importance = 32.1%).
Multiple regression analysis (Y = a 0 + a 1X 1 + a 2X 2) of average mean soil temperature 0–10 cm (°C) from turning green stage to 30% flowering stage (X 1) and average soil water content 0–20 cm (w/w, %) of four specific stages (turning green; branching; flower bud formation; and initial flowering) (X 2) on (A) the above-ground dry matter (kg/ha) at 30% flowering stage (Y) during the 3 years of perennial vetch cultivation in various treatments and of average mean soil temperature (°C) from turning green stage to maturity stage (X 1) and average soil water content (w/w, %) of seven specific stages (turning green; branching; flower bud formation; initial flowering; full flowering; pod-filling and maturity) (X 2) on (B) the above-ground dry matter (kg/ha) at maturity stage (Y) during the 3 years of perennial vetch cultivation in various treatments; The mean soil temperature and soil water content were independent (explanatory) variables, and the above-ground dry matter was dependent (response) variable

Results are taken from all mulching treatments across three growing seasons. *** mean P < 0.001. R 2, determination coefficient.
Seed yield and yield components
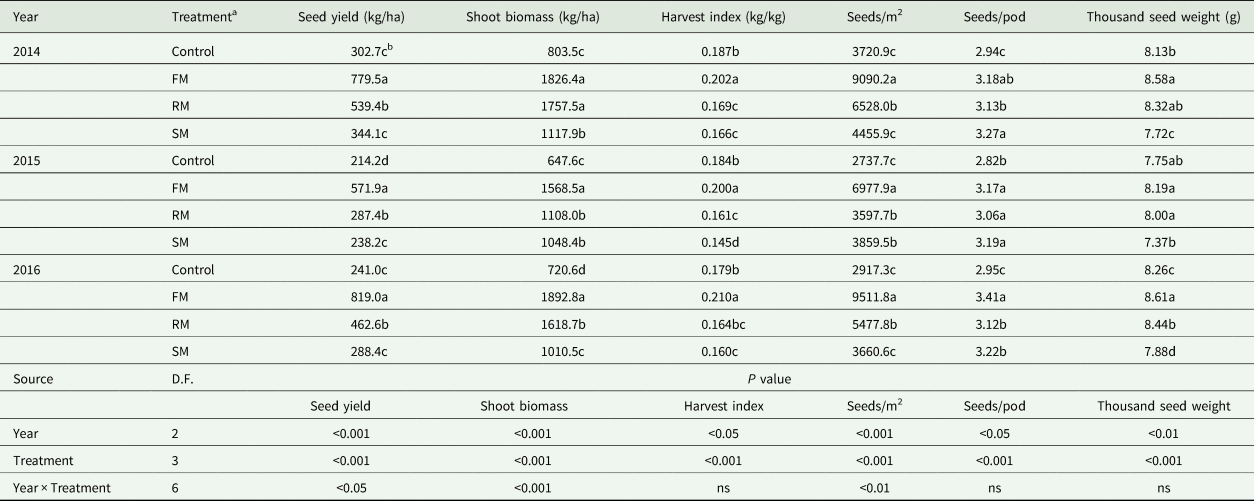
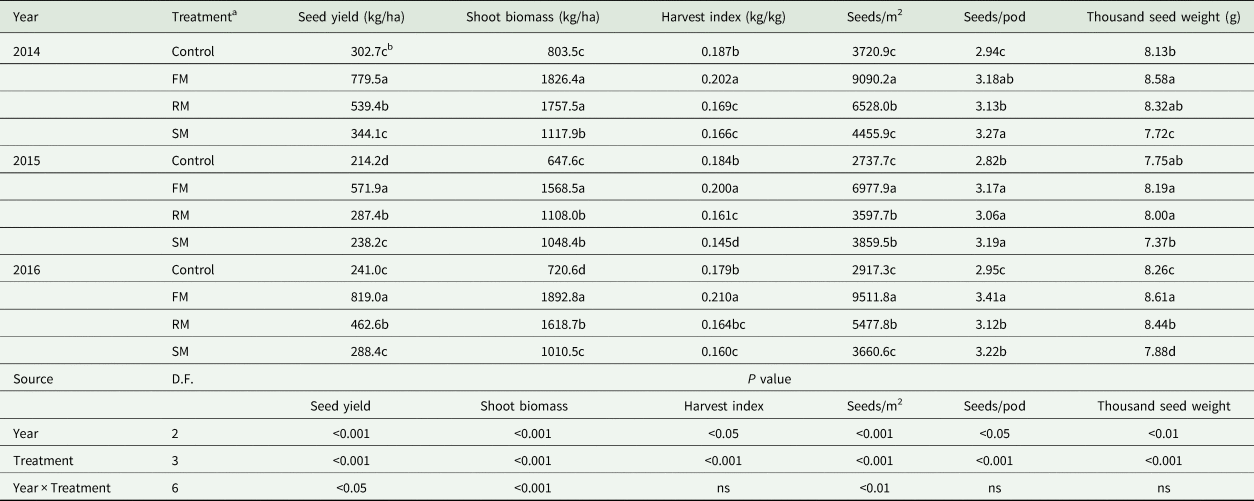
The main effects of year and treatment as well as interaction of year and treatment (Table 5) significantly (P < 0.05) affected seed yield, shoot biomass, harvest index, seeds/m2, seeds/pod and thousand seed weight, with the exception of harvest index, seeds/pod and thousand seed weight which were not affected by interaction of year and treatment.
Seed yield (kg/ha), shoot biomass (kg/ha), harvest index (kg/kg), seeds (seeds/m2), seeds per pod (seeds/pod), and thousand seed weight (g) of perennial vetch as affected by the control and FM, RM and SM treatments in 2014, 2015 and 2016
D.F., degrees of freedom.
P value, significance level; ns, not significant.
a Control, non-mulched control; FM, plastic film mulch for the entire season; RM, plastic film mulch cover until 30% flowering; SM barley straw mulch for the entire season.
b Within a column for a year, values followed by different letters are significantly different according to Duncan's new multiple range test (P < 0.05).
The seed yield, shoot biomass, harvest index, seeds/m2, seeds/pod and thousand seed weight were lower (P < 0.05) in 2015 than in 2014 and 2016, but there were no significant differences in seed yield (P = 0.109) and harvest index (P = 0.056) between 2015 and 2016. The shoot biomass and seeds/m2 were also significantly (P < 0.05) higher in 2014 than in 2016. Averaged across years, compared with the control, seed yield and shoot biomass obtained with the FM treatment increased significantly (P < 0.001), by 186.4 and 143.5%, respectively, which was accompanied by significant (P < 0.01) increases in seeds/m2, seeds/pod and thousand seed weight (by 172.8, 12.1 and 10.5%, respectively), thereby increasing harvest index by 11.2% (P < 0.001). Compared with the control, the greater (P < 0.001) seed yield with the RM treatment occurred along with higher shoot biomass (P < 0.001), and increased by 70.2 and 106.5%, respectively, due to increases of 66.4 and 6.9% (P < 0.05) in seeds/m2 and seeds/pod, respectively, but the RM treatment decreased harvest index significantly (P < 0.001) by 10.3%. Compared with the control, the SM treatment significantly (P < 0.001) increased shoot biomass, seeds/m2 and seeds/pod by 46.3, 22.7 and 11.2%, respectively, but significantly (P < 0.01) reduced thousand seed weight and harvest index (by 4.8 and 14.6%, respectively). In comparison with the SM treatment, the FM and RM treatments increased seed yield significantly (P < 0.05) by 149.3 and 48.1%, respectively. In addition, the SM treatment had a lower (P < 0.001) harvest index than the FM and RM treatments, decreased by 23.2 and 4.8%, respectively (Table 5)
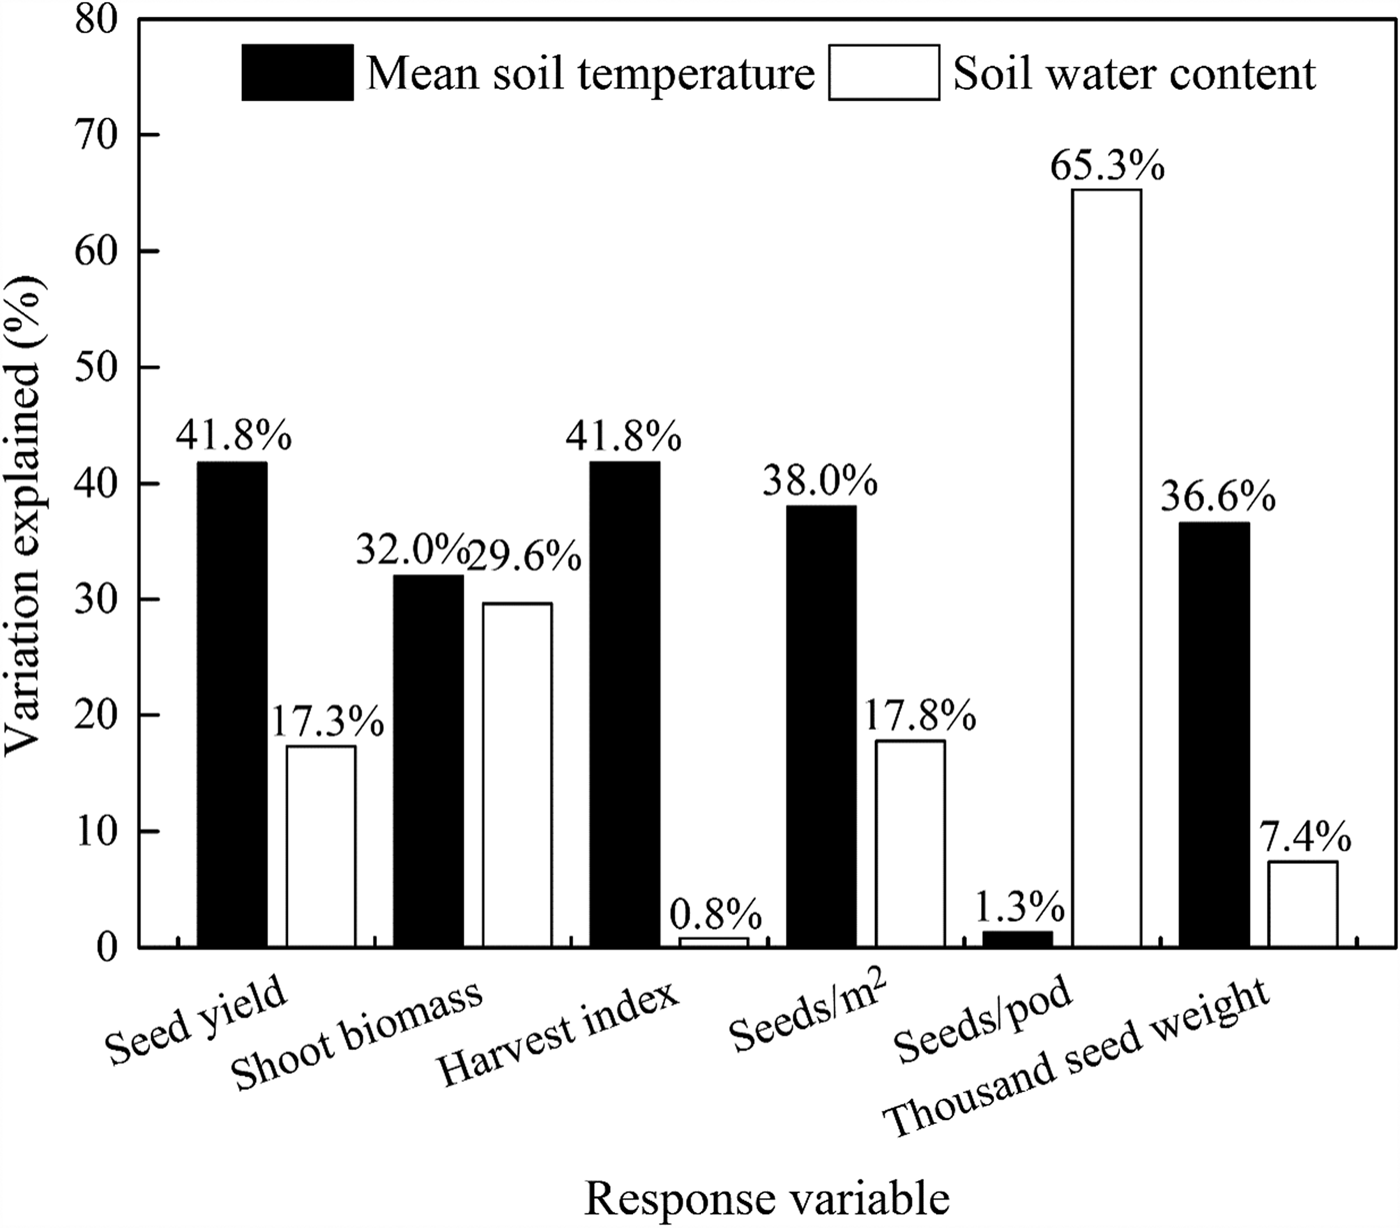
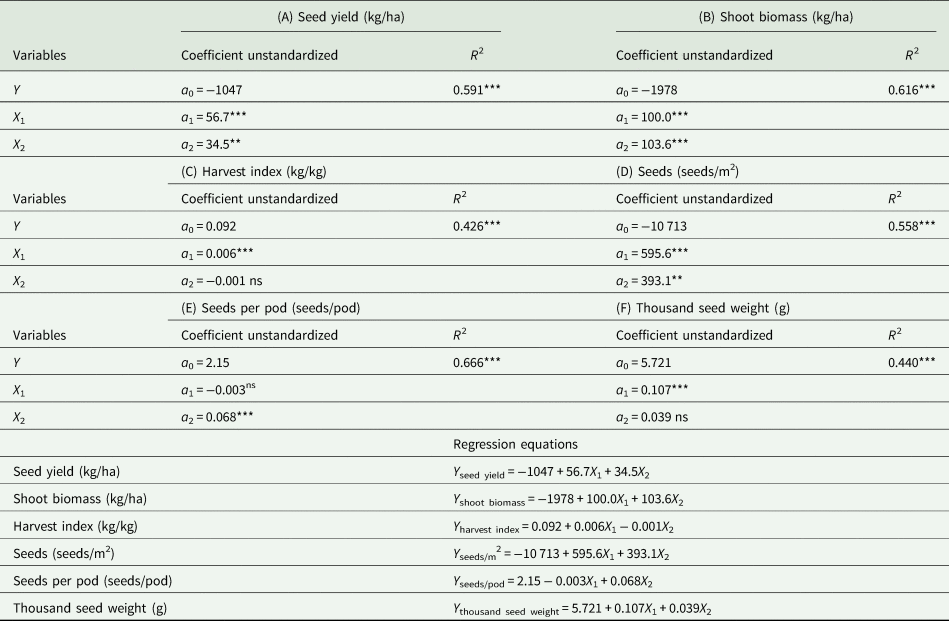
Examination by multiple regression analysis showed that 59.1, 61.6, 42.6, 55.8, 66.6 and 44.0% of the variations (P < 0.001) in seed yield, shoot biomass, harvest index, seeds/m2, seeds/pod and thousand seed weight, respectively, was explained by the contributions of the mean soil temperature (°C) and soil water content (w/w, %). Both the mean soil temperature and soil water content were positively correlated with seed yield and yield components. The relative importance of the contribution to total variance highlights a surprisingly dominant role of mean soil temperature, but soil water content was more important for seeds/pod (Fig. 9, Table 6).
Contributions of the soil mean temperature 0–10 cm (°C) and soil water content 0–20 cm (w/w, %) to variations in the seed yield (kg/ha), shoot biomass (kg/ha), harvest index (kg/kg), seeds (seeds/m2), seeds per pod (seeds/pod) and thousand seed weight (g), respectively.
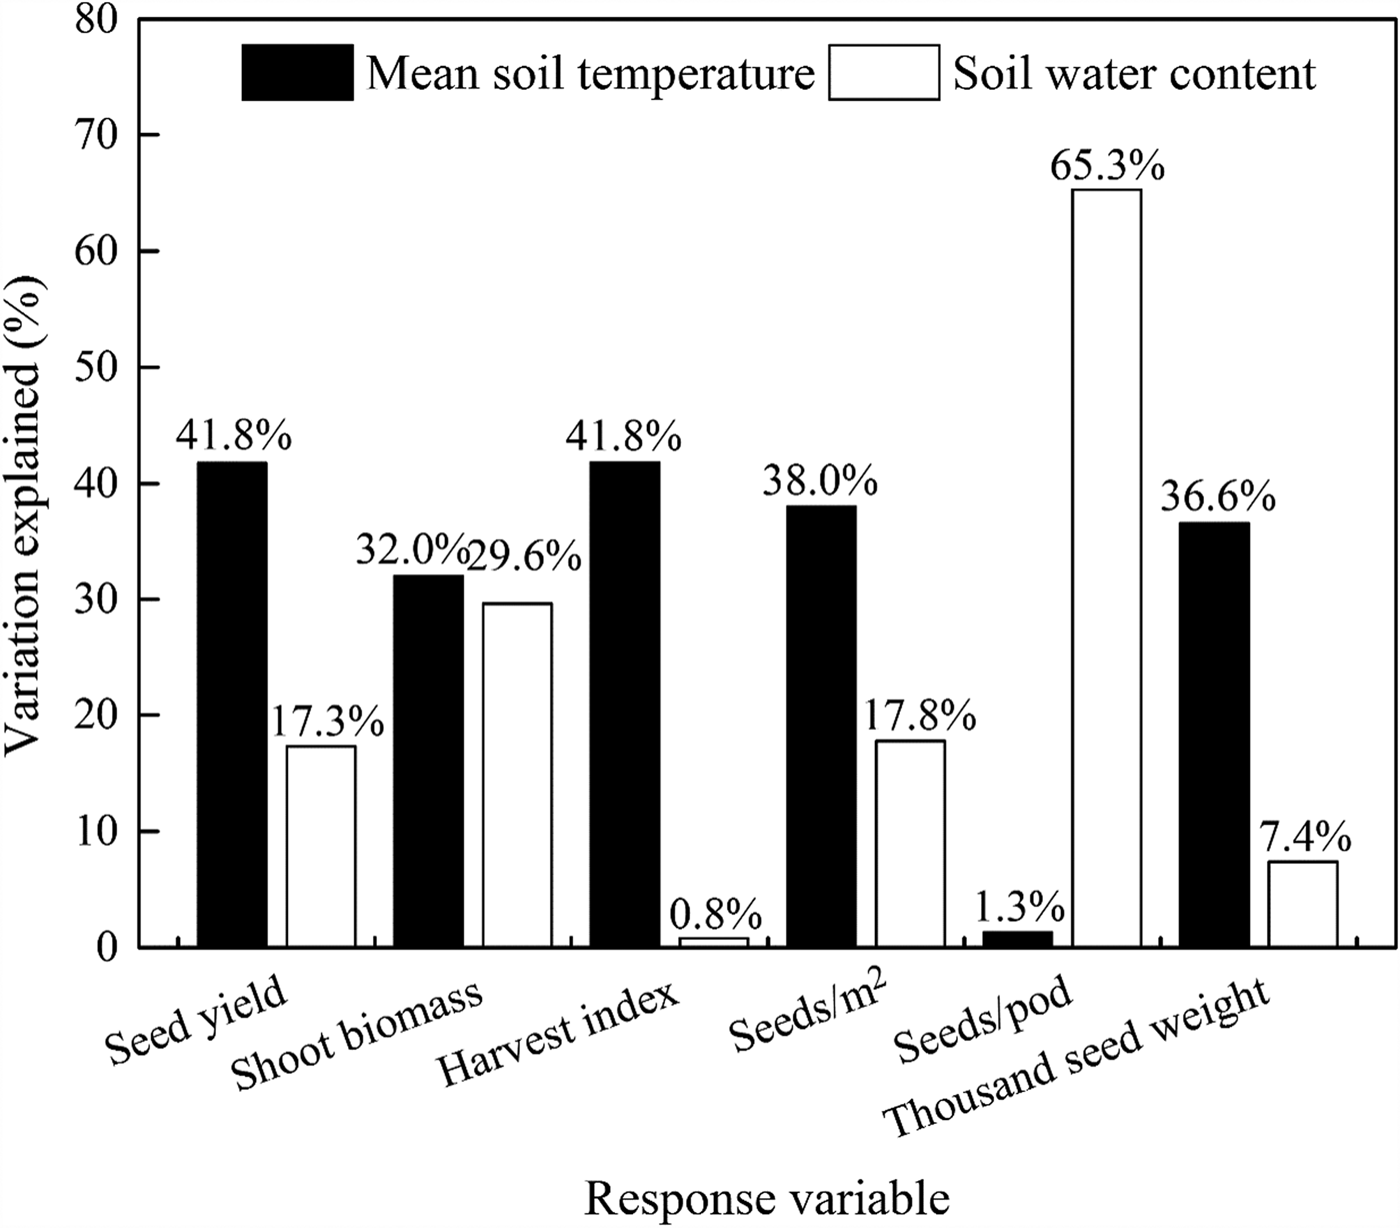
At the maturity stage, multiple regression analysis (Y = a 0 + a 1X 1 + a 2X 2) of average mean soil temperature 0–10 cm (°C) from turning green stage to maturity stage (X 1) and average soil water content 0–20 cm (w/w, %) of seven specific stages (turning green; branching; flower bud formation; initial flowering; full flowering; pod-filling and maturity) (X 2) on (A) the seed yield (kg/ha), (B) shoot biomass (kg/ha), (C) harvest index (kg/kg), (D) seeds (seeds/m2), (E) seeds per pod (seeds/pod) and (F) 1000-seed weight (g) (Y), respectively, during the 3 years of perennial vetch cultivation in various treatments; The mean soil temperature and soil water content were independent (explanatory) variables, and the seed yield, shoot biomass, harvest index, seeds/m2, seeds/pod and thousand seed weight were dependent (response) variables

Results are taken from all mulching treatments across three growing seasons. **P < 0.01, ***P < 0.001, respectively; ns, not significant. R 2, determination coefficient.
Evapotranspiration and water productivity
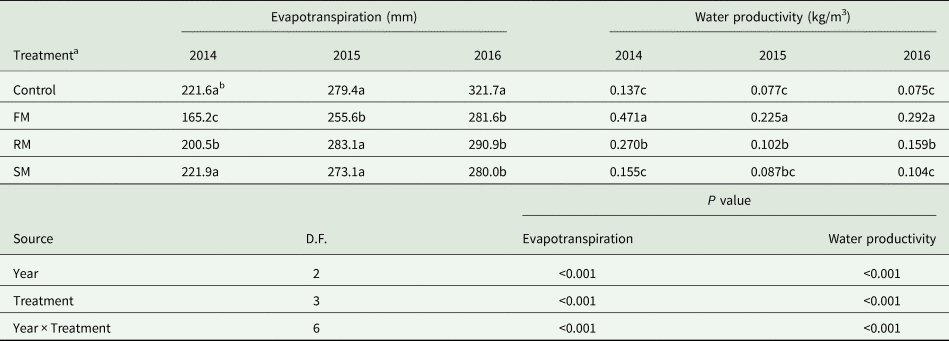
Table 7 shows that the main effects of year and treatment, as well as the interaction of year and treatment, affected evapotranspiration and water productivity significantly (P < 0.001).
Evapotranspiration (mm) and water productivity (kg/m3) of perennial vetch as affected by the control, and FM, RM and SM treatments in 2014, 2015 and 2016

D.F., degrees of freedom.
P value, significance level.
a Control, non-mulched control; FM, plastic film mulch for the entire season; RM, plastic film mulch cover until 30% flowering; SM barley straw mulch for the entire season.
b Within a column for a year, values followed by different letters are significantly different according to Duncan's new multiple range test (P < 0.05).
On average, evapotranspiration in 2015 was 34.8% higher (P < 0.001) than in 2014, whereas the evapotranspiration in 2015 was 7.1% less than in 2016 (P < 0.01). Averaged across years, the control had the highest evapotranspiration followed by SM (P = 0.371), RM (P = 0.366) and FM (P < 0.05) treatments (Table 7).
On average, water productivity was higher in 2014 than in 2015 or 2016, by 64.0 and 110.6% (P < 0.05), respectively. Averaged across years, the FM, RM and SM treatments had higher water productivity than the control, increased by 242.6% (P < 0.001), 83.8% (P < 0.05) and 20.0% (P = 0.572), respectively. The water productivity of the FM treatment was higher (P < 0.001) than the RM and SM treatments (Table 7).
Root biomass and root-to-shoot ratio
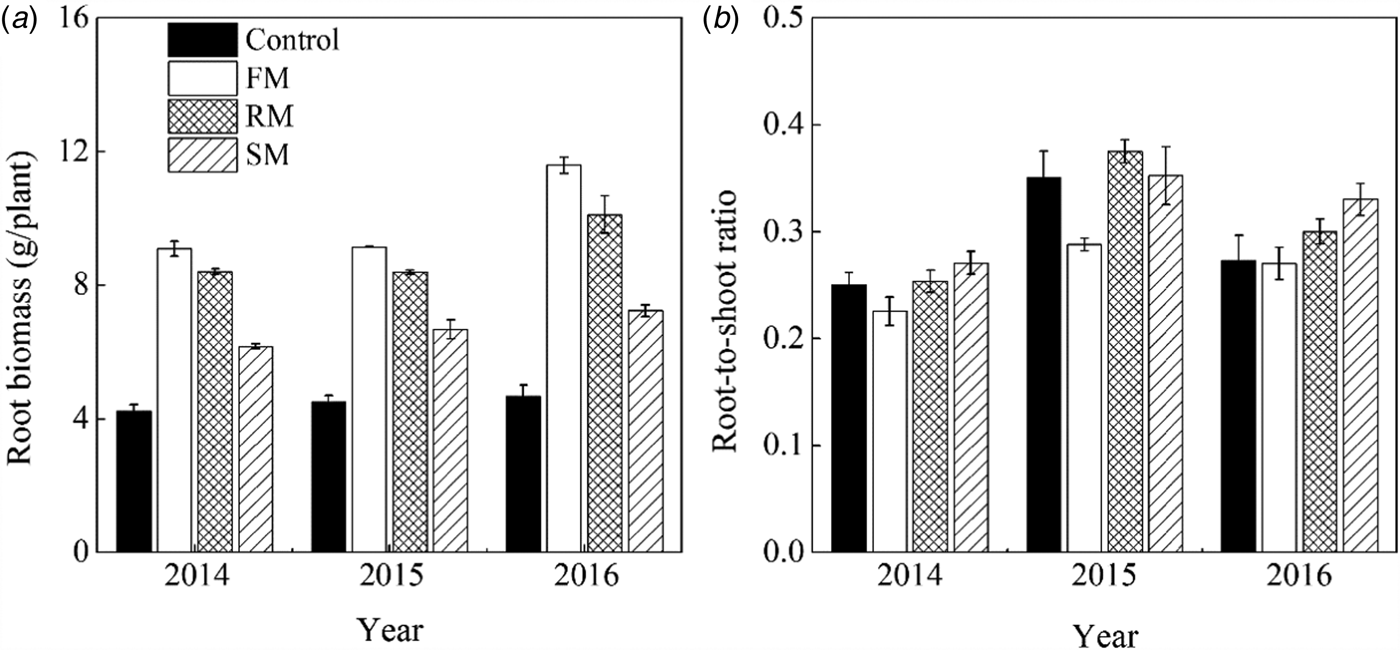
Root biomass and root-to-shoot ratio were significantly (P < 0.001) affected by year and treatment. On average, the root biomass was significantly higher (P < 0.001) in 2016 than in 2015 and 2014, showing increases of 17.1 and 20.5%, respectively (Fig. 10(a)). Averaged across years, FM, RM and SM treatments had 122.6, 100.7 and 49.9% higher root biomass (P < 0.001) than the control, respectively. Root biomass in the RM treatment was lower (P < 0.05) than the FM treatment, but higher (P < 0.001) than the SM treatment.
(a) Root biomass (g/plant) and (b) root-to-shoot ratio of perennial vetch plants as affected by the control, and FM, RM and SM treatments at the maturity stage in 2014, 2015 and 2016, respectively. Error bars represent standard errors of the means (n = 4).
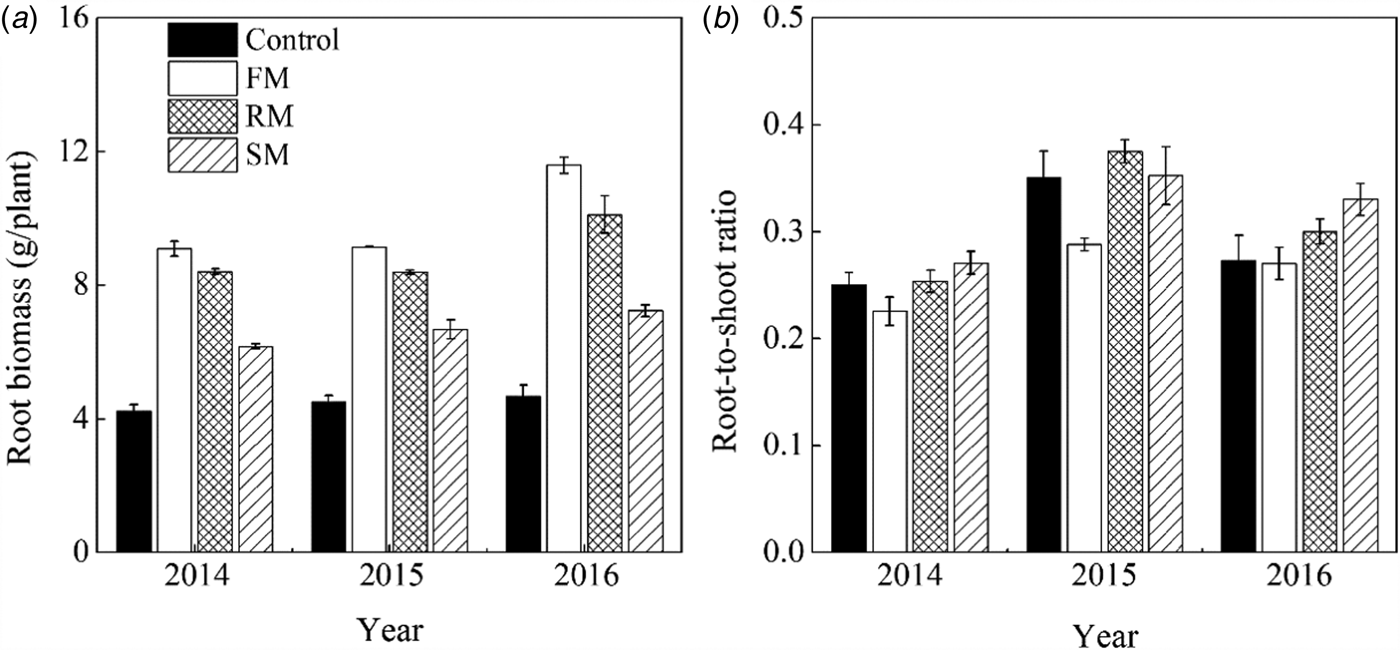
In 2015, root-to-shoot ratio was 16.4 and 36.6% higher (P < 0.01) than in 2016 and 2014, respectively. The root-to-shoot ratio in 2016 was also higher (P < 0.01) than that in 2014 (Fig. 10(b)). Averaged across years, the SM and RM treatments had 21.6 and 18.5% higher (P < 0.05) root-to-shoot ratio, respectively, than the FM treatment. The effect of year on the root-to-shoot ratio was also significantly (P < 0.05) related to treatment. In 2015 (dry year), the RM treatment had the highest root-to-shoot ratio, followed by the SM treatment (P = 0.413), the control (P = 0.386) and FM treatment (P < 0.01).
Discussion
With low temperature and erratic precipitation in alpine regions of the Qinghai-Tibetan Plateau, perennial vetch crops are often characterized by a shortened growth period, fluctuating forage biomass and seed yield with often poor water productivity. The current results showed that modified mean soil temperature, soil water content and soil nutrients generated by mulching helped perennial vetch to improve P n, LAI and above-ground dry matter, seed yield resulting in better water productivity performance on the Qinghai-Tibetan Plateau. Regressions showed that mean soil temperature and soil water content contributed positively to the variation in primary productivity for perennial vetch. The mean soil temperature contributed more than soil water content to the variations in P n, above-ground dry matter and seed yield, whereas the reverse occurred in seeds/pod. The implications of these results are considered below.
Climate data for the study site show that air temperatures and the amount of precipitation may be low when plants are in the vegetative stage (April–June). During the reproductive stage, there is a gradual increase in air temperature, but precipitation is seasonal and erratic. Thus, the climate may inhibit growth and subsequent reproduction of perennial vetch plants in the alpine zone. The current results showed that plastic film mulching increased mean soil temperature, while straw cover decreased mean soil temperature and alleviated temperature oscillation in alpine regions, which agreed with the findings of Zhou et al. (Reference Zhou, Li, Jin and Song2009) and Ram et al. (Reference Ram, Dadhwal, Vashist and Kaur2013). On the one hand, the topsoil under plastic film mulching is warmed via the ‘greenhouse effect’ (Bu et al., Reference Bu, Liu, Zhu, Luo, Chen, Li, Lee Hill and Zhao2013a). When the plant canopy is fully established, the effects gradually decrease due to the ‘overshadowing effect’ (Li et al., Reference Li, Wen, Wan, Liu, Han, Liao and Wu2016). On the other hand, the SM treatment could be acting as a physical barrier, cooling the topsoil due to the reduction of solar radiation reaching the soil surface in the daytime (Chakraborty et al., Reference Chakraborty, Garg, Tomar, Singh, Sharma, Singh, Trivedi, Mittal, Sharma and Kamble2010) and reducing the magnitude of temperature decreases at night (Horton et al., Reference Horton, Bristow, Kluitenberg and Sauer1996). In addition, soil water content was largely affected by mulching materials and erratic precipitation. Both plastic film and straw mulch increased soil water content compared to the non-mulched control plots, as mulching increased water retention and decreased soil water loss by evaporation, thereby conserving soil water (Li et al., Reference Li, Wang, Li, Gao and Tian2013b). As expected, the FM and SM treatments conserved water content in the soil profile efficiently, improving perennial vetch growth and reproduction (Unger et al., Reference Unger, Stewart, Parr and Singh1991; Sauer et al., Reference Sauer, Hatfield and Prueger1996). Even with a low frequency of precipitation, as during the reproductive stage in 2015, the FM and SM treatments still guaranteed water supply for reproduction. It is possible that increased soil temperature and soil water content with the FM and SM treatments promoted root development, which enhanced uptake of soil water to support shoot growth and seed production, thereby increasing water productivity. The current results are in accordance with the findings for other plants such as M. sativa (Fan et al., Reference Fan, Gao, Wang, Malhi and Li2014), Helianthus annuus L. (Zhao et al., Reference Zhao, Pang, Wang, Huo and Li2014) and Arachis hypogaea Linn. (Ramakrishna et al., Reference Ramakrishna, Tam, Wani and Long2006). Further, the current results showed that plastic-film mulch (especially the FM treatment) substantially increased soil available N and P, which agrees with Wang et al. (Reference Wang, Li, Lv, Fu, Ma, Song, Wang and Li2017) and Li et al. (Reference Li, Wu, Zhao, Lu, Fan and Zhang2007), who suggested that the increased soil temperature and moisture conditions with plastic-film mulch stimulate soil microbial activity and thus accelerate N mineralization and P transformation (Hu et al., Reference Hu, Jia, Zhao, Li and Siddique2012; Andersson et al., Reference Andersson, Tighe, Guppy, Milham and McLaren2015; Hai et al., Reference Hai, Li, Liu, Jiang, Guo, Jing, Rengel and Li2015).
Above-ground dry matter of perennial vetch appeared to be strongly related to the temporal distribution of captured resources, mainly due to the increased leaf are index and P n (Bu et al., Reference Bu, Liu, Zhu, Luo, Chen, Li, Lee Hill and Zhao2013a). The current results showed that mulching (especially in the FM treatment) increased soil temperature and water content to improve plant growth and P n; there was a positive effect of mean soil temperature and soil water content on the P n and above-ground dry matter. The FM treatment, with elevated mean soil temperature and soil water content conditions, hastened time to the turning green stage, providing perennial vetch with an advantage towards maximizing the plant canopy at an earlier growth stage, leading to increased radiation capture, and enhancing P n, increasing photosynthate production, and ultimately greater dry matter production. This is in agreement with previous research in Z. mays (Bu et al., Reference Bu, Liu, Zhu, Luo, Chen, Li, Lee Hill and Zhao2013a), T. aestivum (Xie et al., Reference Xie, Wang and Li2005; Jia et al., Reference Jia, Li, Wang and Yang2006; Liu et al., Reference Liu, Jin, Zhou, Jia, Li, Xiong and Li2009) and M. sativa (Fan et al., Reference Fan, Gao, Wang, Malhi and Li2014). These results suggest that improved soil temperature and moisture with the plastic film mulching promote root development to enhance acquisition of soil nutrients and water to achieve and maintain a larger plant canopy and greater photosynthetic rate to improve source capacity, resulting in increased photosynthate production and mineral N and P nutrient uptake for growth (Uhart and Andrade, Reference Uhart and Andrade1991; Stone et al., Reference Stone, Sorensen and Jamieson1999; Liu et al., Reference Liu, Zhan, Chen, Luo, Bu, Chen and Li2015).
The current results clearly showed that mulching practices, and particularly the FM treatment, could improve seed yield of perennial vetch in alpine regions, which was consistent with studies on S. italica (Dong et al., Reference Dong, Liu, Jiang, Shi, Wang, Qiao, Liu, Zhao, Li and Si2014), A. sativa (Wang et al., Reference Wang, Ren, Song, Hu, Zhang, Wang and Vance2015a) and Z. mays (Li et al., Reference Li, Wang, Li, Gao and Tian2013b). Multiple linear regression indicated that soil temperature and water content were positively correlated with seed yield and soil temperature had a greater contribution than soil water content to the variation in seed yield. He et al. (Reference He, Yang, Wu, Jia and Ma2016) and Bu et al. (Reference Bu, Liu, Zhu, Luo, Chen, Li, Lee Hill and Zhao2013a) reported that greater soil temperature and moisture with plastic film mulching led to a larger plant canopy for capturing more radiation and greater photosynthetic capacity, thereby improving seed yield for O. sativa and Z. mays. However, compared with the FM treatment, decreased mean soil temperature and soil water content with the RM treatment reduced the photosynthetic rate and plant canopy at the seed filling stage and thus negatively affected perennial vetch seed production, resulting in decreased seed yield. It is possible that decreased soil temperature and moisture led to reductions in soil water and nutrient uptake for plants with a high level of source capacity (Ma and Han, Reference Ma and Han2001; Frazão et al., Reference Frazão, de Cassia Piccolo, Feigl, Cerri and Cerri2010). Further, the SM treatment shortened the flowering stage but prolonged the seed filling stage. During the seed filling stage, increased air and soil temperatures were seen in the SM treatment, which also had greater soil water content combined with more radiation accumulation and P n, resulting in increasing seed set, seed provisioning and thus increasing seed yield of perennial vetch (Campbell and Halama, Reference Campbell and Halama1993; Arathi, Reference Arathi2011). These results were consistent with improvements seen for seed yield of B. napus (Su et al., Reference Su, Lu, Wang, Li, Ren and Cong2014) and H. annuus (Zhao et al., Reference Zhao, Pang, Wang, Huo and Li2014) with straw mulching. Even when perennial vetch was subjected to drought stress at the reproductive stage in 2015, the FM treatment increased soil temperature and moisture conditions for increasing seed yield compared to the other mulching treatments and the control. These results were consistent with those for M. sativa (Jia et al., Reference Jia, Li, Wang and Yang2006), Z. mays (Zhang et al., Reference Zhang, Li, Yang, Wang and Chen2011) and S. italica (Dong et al., Reference Dong, Liu, Jiang, Shi, Wang, Qiao, Liu, Zhao, Li and Si2014), suggesting that plants under the FM treatment maintained high transpiration rates through acquisition of soil water and nutrients, required for photosynthesis to increase seed yield.
The variation in seeds/pod and thousand seed weight, which are the main yield components (Annicchiarico, Reference Annicchiarico2006; Annicchiarico and Pecetti, Reference Annicchiarico and Pecetti2010) is affected by soil temperature and moisture conditions. An increase in plant reproductive output is accompanied by increased soil temperature and moisture conditions that in turn increase seed number and weight, primarily through improving ovule fertilization and seed provisioning (Vleugels et al., Reference Vleugels, Ceuppens, Cnops, Lootens, van Parijs, Smagghe and Roldán-Ruiz2016). The current results showed a significant increase in seeds/pod in the FM treatment compared with the control. A substantial portion of this variation was due to the increased soil water content, and the R 2 showed that seeds/pod increased with higher values of soil water content than mean soil temperature. A large reduction in seeds/m2 was observed in the dry year. This is consistent with the findings of Turner (Reference Turner1993) and Pang et al. (Reference Pang, Turner, Khan, Du, Xiong, Colmer, Devilla, Stefanova and Siddique2017), who suggested that drought-stressed Trifolium repens L. and Cicer arietinum L. plants might decrease pollen lifespan, viability and pollen tube growth, resulting in a failure of ovule/egg fertilization and decreasing the number of mature seeds. In addition, thousand seed weight of perennial vetch was increased with the FM treatment compared to the control. The R 2 showed that thousand seed weight increased with higher values of mean soil temperature, which had a greater effect than soil water content. Increased mean soil temperature with the FM treatment could promote root development, improving water availability and soil nutrient uptake, which could support mother plants to produce high-energy photosynthates and N components for seed filling (Fig. S1) and increase thousand seed weight (Lu et al., Reference Lu, Wu, Pang, Li, Wu, Shi and Zhang2007; Nayyar et al., Reference Nayyar, Kaur, Kumar and Upadhyaya2007; Liu et al., Reference Liu, Jin, Zhou, Jia, Li, Xiong and Li2009; Ghanbari et al., Reference Ghanbari, Mousavi and Pessarakli2015).
The beneficial effects of mulching on water productivity may be considered through alterations in water and thermal conditions (Jabran et al., Reference Jabran, Ullah, Hussain, Farooq, Zaman, Yaseen and Chauhan2015). The current results showed that mulching treatments (especially the FM treatment) increased water productivity compared to the control plots, through fast canopy development (i.e. reduced bare soil evaporation and increased productive transpiration) and high seed yield (Ali and Talukder, Reference Ali and Talukder2008). The high water productivity is achieved mainly through two variables. The first factor is reducing loss via soil evaporation, which always affects water productivity (Fereres and Soriano, Reference Fereres and Soriano2007; Albrizio et al., Reference Albrizio, Todorovic, Matic and Stellacci2010). The current results confirmed that mulching made better use of light and heavy precipitation by harvesting precipitation, which improved water availability (i.e. decreased soil evaporation loss and increased soil water storage) to perennial vetch plants, thus increasing water productivity (Jabran et al., Reference Jabran, Ullah, Hussain, Farooq, Zaman, Yaseen and Chauhan2015). The current results were in accordance with Siczek et al. (Reference Siczek, Horn, Lipiec, Usowicz and Łukowski2015) and Li et al. (Reference Li, Wang, Li, Gao and Tian2013b), suggesting that a larger plant canopy and stronger root system generated by mulching could decrease soil evaporation and increase transpiration and photosynthesis for improving water productivity. Secondly, the significantly higher water productivity with the FM treatment is attributed to the greater seed yield compared with the control and other mulching treatments (Li et al., Reference Li, Wen, Wan, Liu, Han, Liao and Wu2016). Factors such as increased temperature, water content and nutrient availability, and hence enhanced carbohydrate and soil nutrient translocation towards seed production, result in elevated water productivity. Similar results have also been reported by Jabran et al. (Reference Jabran, Ullah, Hussain, Farooq, Zaman, Yaseen and Chauhan2015) on O. sativa and Gu et al. (Reference Gu, Li and Du2018) on B. napus. Thus, improved soil conditions with FM treatment exert a positive impact on increased water productivity for perennial vetch in alpine regions, where low temperature and frequent drought have a negative impact.
Conclusions
In the circumstances of low air temperature and erratic precipitation during the growing season, mulching significantly improved primary productivity of perennial vetch in the alpine region. Plastic film mulching (especially the FM treatment) would work well to increase the top-soil temperature and conserve available soil water, and in turn to promote plant growth and development, improve P n and thus increase above-ground dry matter, seed yield and water productivity of perennial vetch during the growing season. R 2 of the regression reveals that the relative importance of the mean soil temperature driver was greater than the soil water content driver for P n, dry matter and seed yield, whereas the reverse was true for seeds/pod, and thus more attention should be given to compensate for low temperatures and frequent drought in the alpine region. These relationships help to show the fundamental link between variations in perennial vetch productivity traits and soil temperature and moisture adaptation. It follows that the FM treatment has the potential for increasing perennial vetch productivity under a range of water and heat conditions. Therefore, the FM treatment should be applied as a promising field-management option for maximizing the sustainability of perennial vetch large-scale cultivation and management in alpine regions.
Supplementary material
The supplementary material for this article can be found at https://doi.org/10.1017/S0021859619000443
Acknowledgements
The authors wish to thank Zhixin Zhang, Rui Li, Yafeng Huang, Chao Xia and Tingru Wang for their assistance in field work and suggesting improvements to this paper.
Financial support
The current research was supported by the National Basic Research Program of China, 973 Program, [grant numbers: 2014CB138700].
Conflict of interest
None.
Ethical standards
Not applicable.