




No CrossRef data available.
LOWER BOUNDS FOR LRD/GI/1 QUEUES WITH SUBEXPONENTIAL SERVICE TIMES
Published online by Cambridge University Press: 22 January 2004
Abstract
We investigate the tail distribution of the virtual waiting times in a LRD/GI/1 queue where the arrival process is long-range dependent (LRD) and the service times are independent and identically distributed (i.i.d.) random variables. We present two lower bounds on the stationary waiting time tail asymptotics, which illustrate the different dominating components that influence server performance under various conditions. In particular, we show that the tail distribution of the stationary waiting time is bounded below by that of the associated LRD/D/1 queues resulting from replacing all random service times by the mean. This shows the performance impact purely due to the long-range dependency of the arrival process. On the other hand, when the service times are subexponential, we show that the tail distribution of the stationary waiting time is bounded below by that of the corresponding D/GI/1 queue by replacing the dependent arrival process with its associated independent version. This shows the minimum performance impact due to the tail distribution of the service times. The above two lower bounds indicate that the performance of LRD/GI/1 queues will be dominated by the heavier tail of the corresponding LRD/D/1 and D/GI/1 queues. These features are further illustrated and quantified through examples and via numerous simulation experiments.
Information
- Type
- Research Article
- Information
- Probability in the Engineering and Informational Sciences , Volume 18 , Issue 1 , January 2004 , pp. 87 - 101
- Copyright
- © 2004 Cambridge University Press
1. INTRODUCTION
With the rapid advances in Internet technology, electronic commerce is becoming a mature business strategy. The concept of Quality of Service (QoS) is working its way to the front lines of electronic business commitments and requirements, as it plays an important role in Internet applications, services, and pricing negotiations. One needs to have a fundamental understanding of the key characteristics of the traffic patterns in commercial websites and a fundamental understanding of the impact of such traffic patterns on Web server performance, as well as the server capacity required to guarantee a certain level of QoS (e.g., request response time). Our primary focus in this article is to investigate these important research issues related to such performance metrics when the arrival traffic is long-range dependent and the service times are subexponential.
In the past decades, long-range dependence (LRD) has been detected in a wide range of applications and over multiple networking infrastructures [5,10,19]. Roughly speaking, the LRD process has a slowly decaying correlation structure that is nonintegrable. This dependence structure is expected to affect performance in a drastically negative way that is much different from that under the Poisson process. Previous work [7,13,18] in this area has been mostly focused on the dependent input process while assuming the service times of all arrivals are deterministic (i.e., LRD/D/1 queues or equivalently fluid queues with LRD input process). Although the assumption of deterministic service times is valid in the case of network routers serving fixed-size packets or is a reasonable approximation when the packet sizes have small variance, such an assumption is hardly justified in the case of Web servers where, in addition to the long-range dependency of the arrival process, requests vary largely in their sizes and service demands, often having nontraditional (subexponential) tail distributions [1,5,6,8,11,21]. Therefore, how the performance would be influenced by the LRD input process and the nontraditional service time distributions remains an open question, important both in theory and real practice, such as Web server performance and QoS concerns.
Performance impact due to subexponential service times (while assuming independent and identically distributed (i.i.d.) interarrival times) has been explored extensively over the past decades. A fundamental result (due to Pakes [14]) shows that for GI/GI/1 queues with i.i.d. interarrival times and i.i.d. service times, where it is assumed that the service times have distribution function (d.f.) F with finite mean μ−1 and traffic intensity ρ < 1, if the integrated (service time) tail distribution Fe is subexponential, then the stationary waiting time W∞ is also subexponential and its tail distribution is asymptotically equivalent to Fe(x) as x goes to infinity. Therefore, for GI/GI/1 queues, when the residual service times are subexponential, the tail distribution of the service times will dominate the tail behavior of the stationary waiting times. The above result has later been generalized to Markov-modulated G/GI/1 queues [9] and short-range-dependent arrival processes [3].
Our goal in this article is to examine the performance asymptotics under both LRD arrival processes and i.i.d. subexponential service times. In particular, consider LRD/GI/1 queues, let A(t) be the total number of arrivals in interval [0, t), and denote by Si the service demand by the ith arrival and by Ti the ith interarrival time. Throughout this article, we assume that the Si's are i.i.d., and the sequence of Ti is stationary and ergodic.
We are interested in the stationary waiting time, expressed in Loynes' schema as (cf. [12])

where

is the equality in distribution and the sequence {Sk,Tk}k=−∞∞ is the stationary extension of the original sequence {Sk,Tk}k=1∞.
We present two lower bounds on the stationary waiting time tail asymptotics, which illustrate the different dominating components that influence server performance under various conditions. Specifically, we show that for LRD/GI/1 queues, where the arrival process is long-range dependent and the service times are subexponential, the tail distribution of the waiting time W∞ is asymptotically bounded below by [ρ/(1 − ρ)]Fe(x), where Fe is the tail distribution of the stationary residual service times. Although this lower bound is known to be asymptotically exact for GI/GI/1 queues, this bound is the first, to the best of our knowledge, that extends to long-range dependent arrival processes. It indicates that the performance of any G/GI/1 queues with subexponential times is always bounded below by that of the associated D/GI/1 queue by replacing the (dependent) arrival process with its associated independent version. This shows the minimum performance impact due to the tail distribution of the service times.
In addition, we show that the tail distribution of the stationary waiting time of a LRD/GI/1 queue is always bounded below by that of the corresponding LRD/D/1 queue when replacing the random service times with its mean. This shows the minimum performance impact due to the long-range dependency of the input process.
The above two lower bounds further illuminate that the performance of LRD/GI/1 queues should be dominated by the heavier distribution between Fe and the tail distribution of W∞ for the associated LRD/D/1 queues. When modeling the LRD process using the fractional Gaussian noise (FGN) with Hurst parameter H, the corresponding FGN/D/1 queue is well studied in [7,13], where it is known that the stationary waiting time is asymptotically equivalent to a Weibull distribution with shape parameter 2 − 2H, denoted by Weibull(2−2H). In this case, when the residual service time is heavier than Weibull(2−2H), then the steady-state performance will be dominated by the residual service times. However, if the residual service time is lighter, then the steady-state performance is dominated by the dependence structure of the arrival process. The same results also hold for the stationary virtual waiting times. These characterizations are further illustrated and quantified via numerous simulation experiments.
The rest of the article is organized as follows. Definitions and some preliminaries are presented in Section 2. In Section 3, we show our main results, which give two important asymptotic lower bounds for the tail distribution of the stationary waiting time under general (dependent) arrival process and i.i.d. subexponential service times. These features are further illustrated and quantified via numerous simulation experiments in Section 4. Finally, concluding remarks are given in Section 5.
2. PRELIMINARIES
In this article, we will use the notation a(x) ∼ b(x) for

for lim infx→∞(a(x)/b(x)) ≥ 1, and

for lim supx→∞(a(x)/b(x)) ≤ 1.
For a given distribution function F on [0,∞}, designate Fe to be the integrated tail distribution of F so that

where

.
Definition 1: A distribution function F on [0,∞) is said to be subexponential, denoted as

, if for any n ≥ 2,

where F*n denotes the n-fold convolution of F.
The class of subexponential distributions was first introduced by Chistakov [4]. Intuitively, it says that the sum becomes large mainly due to one of the summands being large. Distribution functions in the subexponential family include Pareto distributions, log-normal distributions, and part of the Weibull distribution family. A Pareto distribution with shape parameter α and scale parameter β has d.f.

A Weibull distribution with scale parameter α and shape parameter β has d.f.

It is subexponential when the shape parameter β ∈ (0,1).
Note that

is a subset of

, the class of long-tailed distributions such that F(x + y) ∼ F(x) as x → ∞ for all y. It can be shown that any random variable (r.v.) X with d.f.

would have an infinite moment generating function [17]: E(eθX) = ∞, θ > 0. We will therefore refer to a r.v. X as light tailed if E(eθX) < ∞ for some θ > 0.
Here, we quote some well-known properties that will be used later.
Lemma 2: Let F and G be d.f.'s on [0,∞) such that F(x) ∼ cG(x), with constant c ∈ (0,∞). Then,

if and only if

.
Lemma 3: If

and F is any d.f. such that limx→∞(F(x)/G(x)) = c, with constant c ∈ [0,∞), then

3. ASYMPTOTIC LOWER BOUNDS
Consider a single queuing system where jobs arrive at random times 0 ≤ Γ1 ≤ Γ2 ≤ ···, and the service times {Sn}n≥1 are i.i.d. random variables with d.f. F and finite mean μ−1. Throughout this article, we assume that the service discipline is first-come first-serve (FCFS). Let Tn = Γn − Γn−1, n = 1,2,…, be the interarrival times. We assume the arrival process is independent of the service times. Denote by A(t) the cumulative number of arrivals in time [0, t). We assume that process A(t) is stationary and ergodic s.t. limt→∞(A(t)/t) = λ. Note that the arrival process A(t) could be dependent or even long-range dependent. We assume ρ = λ/μ < 1 so that the system is stable. In addition, let {Sk,Tk}k=−∞∞ be the stationary extension of the original sequence {Sk,Tk}k=1∞.
We now present two important asymptotic lower bounds for the tail distribution of the stationary waiting time W∞. These bounds illuminate the different dominating components that influence server performance under different conditions, which shed light on the joint performance impact under both the long-range dependent arrival process and subexponential service times.
3.1. Lower Bound Based on Service Time Tail Distribution
In this subsection, we assume that the service times Sn, n = 1,2,… are i.i.d. subexponential. We consider a general LRD/GI/1 queuing system and show the minimum performance impact due to subexponential service times.
We will first present Lemma 4, which can be considered as an extended version of Lemma 3.1 in [2].
Lemma 4: Let Dn, n = 1,2,…, be a sequence of random variables such that as n → ∞, Dn /n → d with probability (w.p.) 1. For arbitrary ε, ε′ > 0, there exists a constant c > 0 such that

and

Proof: Inequality (3) is basically the result of Lemma 3.1. in [2]. Noting that −Dn /n → −d w.p. 1, inequality (4) simply follows from applying (3) on the sequence −Dn. █
Theorem 5: Consider a LRD/GI/1 queue with FCFS, where the input process is stationary and ergodic s.t. limt→∞(A(t)/t) = λ. The service times are subexponential i.i.d. r.v.'s with mean μ−1 and d.f. F. Set ρ = λ/μ and assume ρ < 1. If

, then

Proof: Because the input process is stationary and ergodic, it follows immediately that

. Applying Lemma 4 yields that for arbitrary ε, ε′ > 0, there exists a constant c > 0 such that P[B] > 1 − ε′, where B denotes the event set

. We then have
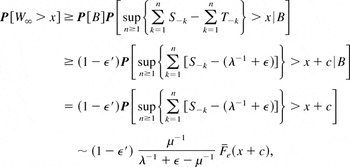
where the last equality comes from the fact that the arrival process (thus, event B) is independent of the service times. The last ∼ equivalence is due to [14] for D/GI/1 queues with deterministic interarrival times λ−1 + ε. Since

, Fe(x + c) ∼ Fe(x), (5) follows by letting ε and ε′ go to zero. █
Note that the above argument applies for any (whether dependent or independent) stationary ergodic arrival process. Thus, from Theorem 5, we conclude that under any stationary ergodic arrival process, whenever the service times are subexponential, the tail distribution of the stationary waiting time will be at least as heavy as that of the residual service times.
Remark: Although it is well known that for GI/GI/1 queues where the arrival process is of renewal type and the service times are subexponential, (5) is asymptotically exact [14]; the above lower bound is the first, to the best of our knowledge, that extends to long-range-dependent arrival processes.
3.2. Lower Bound Based on Dependence Structure
We next derive a lower bound for the tail distribution of the stationary waiting time which shows the performance impact purely due to the long-range-dependent structure of the arrival process.
Theorem 6: Consider a LRD/GI/1 queue with FCFS, where the input process is stationary and ergodic s.t. limt→∞(A(t)/t) = λ. The service times are subexponential i.i.d. random variables with mean μ−1 and d.f. F. Set ρ = λ/μ and assume ρ < 1. Let W∞LRD/D/1 be the stationary waiting time of the associated LRD/D/1 queues where the arrival process is the same but service times are deterministic and equal to μ−1. If for all sufficiently small ε > 0,

where D−ε denotes deterministic service times equal to μ−1 − ε, then

Proof: Because Sk's are i.i.d. random variables, by the strong law of large numbers,

. Applying Lemma 4 entails for arbitrary ε, ε′ > 0, there exists a constant c > 0 such that P[B′] > 1 − ε′, where B′ denotes the event set

. Therefore,

where the last equality follows from the fact that the service times (thus, event B′) is independent of the arrival process. Since

, P[W∞LRD/D−ε /1 > x + c] ∼ P[W∞LRD/D−ε /1 > x]. We then have that (7) follows by letting ε and ε′ go to zero. █
Theorem 6 shows that under both long-range-dependent arrival process and subexponential service times, the tail distribution of the stationary waiting time will be at least as heavy as that resulting from the dependence structure of the arrival process alone (i.e., as if with deterministic service times).
3.3. Example: Fractional Gaussian Noise Input Traffic
In this subsection, we concentrate on the case when the arrival traffic is FGN. The FGN model is frequently used to capture the long-range dependency of traffic mostly due to its mathematical simplicity. The use of FGN for traffic modeling is discussed in [15] and references therein.
Suppose requests arrive at discrete times t = 0,1,2,…, where the number of arrivals at time slot t is denoted by integer at. Assume that {at} is a stationary FGN sequence with mean λ, variance σ2, and Hurst parameter H ∈ [½,1). In other words, at = λ + σNtH, where {NtH} is a zero-mean standard (fraction) Gaussian sequence with (auto)covariance function

Consider a FGN/GI/1 queue with arrival process {at}; the service times for the requests Si's are i.i.d. random variables with finite mean μ−1 and general distribution G. Since jobs arrive in batches (at the beginning of each slot), here we are interested in the stationary waiting time of the first job in a batch, which can be expressed in Loynes' schema as follows:

where

and the sequences {at}t=−∞∞ and {Si}i=−∞∞ are respectively stationary extensions of the sequences {at}t=0∞ and {Si}i=0∞.
Let με−1 = μ−1 − ε. As in the proof of Theorem 6, one can show that

Note that the last component corresponds to a fluid queue fed by LRD inputs, which has been studied in [13] assuming με = 1, and it is known that for large x,

This lower bound has been shown in [7] to be asymptotically exact in log scale.
Therefore, supt≥0(Ar(t)με−1 − t) has its tail distribution asymptotically equivalent to a Weibull distribution with shape parameter 2 − 2H, which is clearly long tailed, thus satisfying condition 6.
As the waiting times of other customers in a batch are larger than that of the first customer, we obtain the lower bound of the tail distribution of the stationary waiting time.
Corollary 7: Consider a FGN/GI/1 queue, where the arrival process is FGN and the service times are i.i.d. r.v.s with mean μ−1. Then, for large x,

where

with ρ = λ/cμ and γ2 = σ2/λ2. Note that γ2 is simply the coefficient of variance of the arrival process.
Clearly, lower bound (9) only shows the impact on performance by the long-range-dependence arrival process.
3.4. Further Insights
The results from previous subsections show that the joint impact on performance by a long-range dependent arrival process and subexponential would be bounded below by that of the associated queues when replacing the (dependent) arrival process with its independent version, and by the tail distribution of the residual service times. Thus, the heavier tail of (9) and (5) dominates. We then have the following corollary.
Corollary 8: For a LRD/GI/1 queue, where the input process is LRD and the service times are i.i.d. subexponential with finite mean μ−1, then for large x, the tail distribution of the stationary waiting time is bounded below by the heavier tail of (5) and (7).
Corollary 9: Consider FGN/GI/1 queues as introduced in Section 3.3, The service times are i.i.d. subexponential with finite mean μ−1. Then, the lower bound of the stationary waiting time will be dominated by the heavier tail of the residual service time and Weibull distribution with shape parameter 2−2H and scale parameter δ, which is given by (10).
In fact, similar results hold for the stationary virtual waiting time

This is because of the following stochastic comparisons between stationary virtual waiting time and stationary waiting time:

where Se ∼ Fe and is independent of W∞. The stochastic inequality X ≤st Y means that P[X > x] ≤ P[Y > x] for all

.
In order to show (11), let

for n ≥ 1. Note that

Thus, the left-hand side of (11) follows immediately.
The right-hand side of (11) follows from the known fact [2] that for general G/GI/1 queues with FCFS and ρ < 1,

for all x, where Se is distributed as Fe and is independent of W∞.
We immediately have the following corollary.
Corollary 10: The two lower bounds given by (5) and (9) hold asymptotically for the stationary virtual waiting time V∞. In addition, the heavier one of both the stationary waiting times W∞ dominates.
Therefore, when (5) is heavier than (9), the tail distributions of the stationary waiting time and virtual waiting time are dominated by the subexponential service times; that is, the impact by the dependence structure of the input process becomes relatively small. If instead, the lower bound (9) is heavier than (5), then the tail distributions of the stationary waiting time and virtual waiting time are dominated by the dependence structure. These features are further illustrated by the simulation studies in the next section.
We conjecture that the lower bound of Corollary 8 actually provides an asymptotically exact solution.
4. COMPARISON WITH SIMULATIONS
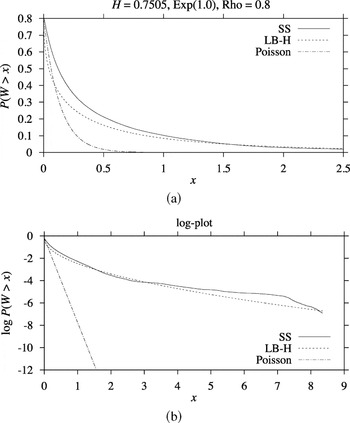
To compare with the theoretical bounds developed in the last section, we simulate the system under generated self-similar input sequence and explore the performance under different service time distributions. The self-similar input process is generated using the drill-down techniques introduced in [21] using the FGN model, which is based on the fast Fourier transform algorithm proposed in [16]. Specifically, we set the parameters of the FGN model to be H = 0.7505, λ = 30.1471 and σ2 = 86.6037, which are obtained from a real set of commercial website data dated August 9, 2001, hour 16–21.2. The service times are generated (based on the inversion formula) under different distributions. In all cases, we assume the traffic intensity equals ρ = 0.8. The resulting empirical stationary waiting time tail distributions P[W∞ > x] are then calculated and plotted. Note that W∞ ≥st V∞; we further compare P[W∞ > x] with the lower bounds developed in Section 3. We denote the lower bound (5) simply as Poisson since it corresponds to the performance under the same service times but with Poisson input process. Therefore, it shows the performance impact due to the subexponential service times. Similarly, we denote as LB-H the lower bound given by (9) since it shows the performance impact under the long-range-dependent structure. Specifically, LB-H is set to ρe−δx2−2H for x > 0 since P(W > 0) = ρ.
Simulation results for exponential service times are plotted in Figure 1, where in (a) the tail probability of the waiting times P[W > x] is plotted as a function of x, and in (b) the log P[W > x] versus x plot is displayed. Note that when the arrival process is Poisson, the resulting queue is a M/M/1 queue, where its steady-state waiting time has a known exponential tail distribution [20] such that P[W > x] = ρe−μ(1−ρ)x for x > 0. Clearly, empirical tail probabilities obtained from simulation stay very close to the lower bound LB-H and far from the tail distribution under Poisson inputs. This suggests that when the service times have exponential tails, the performance is essentially dominated by the long-range dependence and the steady-state waiting time is asymptotically equivalent to a Weibull distribution.

(a) Waiting time tail probabilities under exponential service times with self-similar arrival process. (b) The corresponding plot in log scale.
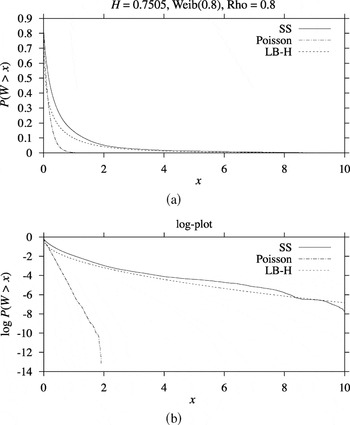
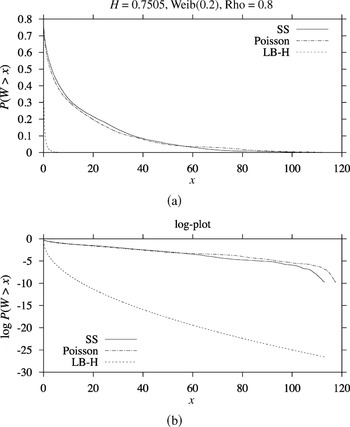
Figures 2 and 3 show the simulation results when the service times are of the Weibull distributions given by (2), where two cases were considered, with β = 0.8 and β = 0.2, respectively; the corresponding parameter α is chosen so that the mean service time1
The mean of a Weibull r.v. with parameter (α, β) is α−1/βΓ(1 + 1/β), where

.

(a) Waiting time tail probabilities under Weibull(β = 0.8) service times. (b) The corresponding log plot.

(a) Waiting time tail probabilities under Weibull (β = 0.2) service times. (b) The corresponding log plot.
Observe that under Weibull(0.8) service times, the tail distribution under self-similar (SS) inputs is very close to the lower bound LB-H, suggesting that the dependence structure dominates the performance. However, when the service times are Weibull(0.2), the performance deviates greatly from LB-H and stays closer to that under the Poisson inputs, suggesting that the service times dominated the performance instead when the service time tail distribution is heavier than Weibull(2−2H).
Figure 4 corresponds to service times of the Pareto distribution given by (1), where α = 1.5 and β is chosen so that the mean service time2
The mean of a Pareto r.v. with parameter (α, β) is βα/(α − 1).

(a) Waiting time tail probabilities under Pareto service times with α = 1.5. (b) The corresponding plot in log scale.
Informally, we can summarize the performance issues as follows. Under FGN arrival process and exponential tailed service times, the waiting time tail distribution is dominated by the dependence structure of the arrival process. When the service times are subexponential, if the residual service time (viz. lower bound (5)) is heavier than Weibull(2−2H), then the waiting time distribution is dominated largely by the service time tail properties; otherwise, the dependence structure dominates the performance.
5. CONCLUSIONS
Based on both analytical results and simulations, we investigated various issues concerning the joint impact on the asymptotic behavior of the stationary waiting time and virtual waiting time by the long-range-dependent arrival process and subexponential service times. We presented two important lower bounds on the stationary virtual waiting time tail asymptotics, which illuminates the different dominating components that influence server performance under various conditions. In particular, we showed that the tail distributions of the stationary waiting time and virtual waiting time of an LRD/GI/1 queue with subexponential service times are bounded below by that of the associated D/GI/1 queue by replacing the dependent arrival process with its associated independent version. This shows the performance impact purely due to the tail distribution of the service times. In addition, tail distributions of the stationary waiting time and virtual waiting time are also bounded below by that of the corresponding LRD/D/1 queues, which shows the performance impact [13] purely due to the long-range dependency of the arrival process when replacing the random service times with its mean. These features are further illustrated and quantified via numerous simulation experiments.
Although the analytical solutions provide only asymptotic lower bounds for the tail distribution of the response times, we believe that these bounds are asymptotically exact. This is the subject of our ongoing investigation.
Acknowledgment
The authors would like to thank the reviewer for pointing out some omissions in the original proofs and the helpful comments and suggestions.
References
REFERENCES
Arlitt, M.F. &
Williamson, C.L.
(1997).
Internet Web servers: Workload characterization and performance
implications.
IEEE/ACM Transactions on Networking
5(5):
631–645.Google Scholar
Asmussen, S.
(1998).
Subexponential asymptotics for stochastic processes: Extremeal
behaviour, stationary distributions and first passage
probabilities.
Annals of Applied Probability
8:
354–374.Google Scholar
Asmussen, S.,
Schmidli, H., &
Schmidt, V.
(1999).
Tail probabilities for non-standard risk and queueing processes
with subexponential jumps.
Advances in Applied Probability
31:
422–447.Google Scholar
Chistakov, V.P.
(1964).
A theorem on sums of independent positive random variables and its
application to branching random process.
Theory of Probability and Its Applications
9:
640–648.Google Scholar
Corvella, M.E. &
Bestavros, A.
(1996).
Self-similarity in World Wide Web traffic: Evidence and possible
causes.
Performance Evaluation Review
24:
160–169.Google Scholar
Downey, A.
(2001).
The structural cause of file size distributions.
Proceedings of the International Symposium on Modeling Analysis and
Simulation of Computer and Telecommunication Systems.
Duffield, N.G. &
O'Connell, N.
(1995).
Large deviation and overflow probabilities for the general
single-server queue, with applications.
Mathematical Proceedings of the Cambridge Philosophical Society
118:
363–375.Google Scholar
Iyengar, A.K.,
Squillante, M.S., &
Zhang, L.
(1999).
Analysis and characterization of large-scale web server access
patterns and performance.
World Wide Web
2:
85–100.Google Scholar
Jelenkovic, P. &
Lazar, A.A.
(1998).
Subexponential asymptotics of a Markov-modulated random walk with
queueing applications.
Journal of Applied Probility
35(2):
325–347.Google Scholar
Leland, W.E.,
Taqqu, M.S.,
Willinger, W., &
Wilson, D.V.
(1994).
On the self-similarity nature of Ethernet traffic (extended
version).
IEEE/ACM Transactions on Networking
2(1):
1–15.Google Scholar
Liu, Z.,
Niclausse, N., &
Jalpa-Villanueva, C.
(2001).
Traffic model and performance evaluation of Web servers.
Performance Evaluation
46(2–3):
77–100.Google Scholar
Loynes, R.M.
(1968).
The stability of a queue with non-independent inter-arrival and
service times.
Proceedings of Cambridge Philosophical Society
58:
497–520.Google Scholar
Norros, I.
(1994).
A storage model with self-similar input.
Queueing Systems
16:
387–396.Google Scholar
Pakes, A.
(1975).
On the tails of waiting time distributions.
Journal of Applied Probability
12:
555–564.Google Scholar
Park, K. &
Willinger, W. (eds.).
(2002).
Self-similar network traffic and performance evaluation.
New York:
Wiley.
Paxson, V.
(1995).
Fast approximation of self-similar network traffic.
Technical Report LBL-36750/UC-405,
Lawrence Berkeley Laboratory.
Sigman, K.
(1999).
Appendix: A primer on heavy-tailed distributions.
Queueing Systems
33:
261–275.Google Scholar
Vanichpun, S. &
Makowski, A.M.
(2002).
Positive correlations and buffer occupancy: Lower bounds via
supermodular ordering.
Proceedings of IEEE INFOCOM 2002, pp.
1298–1306.
Willinger, W.,
Taqqu, M.S.,
Sherman, R., &
Wilson, D.V.
(1997).
Self-similarity through high-variability: Statistical analysis of
ethernet LAN traffic at the source level.
IEEE/ACM Transactions on Networking
5(1):
71–86.Google Scholar
Wolff, R.W.
(1988).
Stochastic modeling and the theory of queues.
Englewood Cliffs, NJ:
Prentice-Hall.
Xia, C.H.,
Liu, Z.,
Squillante, M.S.,
Zhang, L., &
Malouch, N.
(2003).
Analysis of performance impact of drill-down techniques for Web
traffic models.
Proceedings of the 18th International Teletraffic Congress
(ITC-18), pp.
1–10.
(a) Waiting time tail probabilities under exponential service times with self-similar arrival process. (b) The corresponding plot in log scale.
(a) Waiting time tail probabilities under Weibull(β = 0.8) service times. (b) The corresponding log plot.
(a) Waiting time tail probabilities under Weibull (β = 0.2) service times. (b) The corresponding log plot.
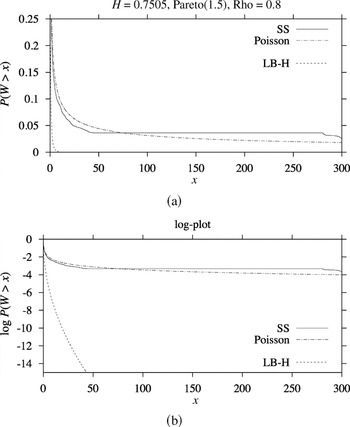
(a) Waiting time tail probabilities under Pareto service times with α = 1.5. (b) The corresponding plot in log scale.
 You have
Access
- 3
- Cited by