Introduction
Taxonomic classification at the genus level can involve tensions between splitting and lumping philosophies. When there are living taxa, this kind of controversy can often be resolved by molecular data, but it is impossible to use this approach in extinct fossil groups (Sandin et al. Reference Sandin, Pillet, Biard, Poirier, Bigeard, Romac, Suzuki and Not2019).
Radiolarians, ranging in age from the Cambrian to the present, are marine unicellular planktonic rhizarians. We use them here as a test case to explore genus taxonomy, focusing on the family Follicucullidae (Ormiston and Babcock Reference Ormiston and Babcock1979; De Wever et al. Reference De Wever, Dumitrica, Caulet, Nigrini and Caridroit2001). Follicucullids belong to the order Albaillellaria, which is characterized by an internal triangular frame made from three intersecting rods, and species can be defined readily because of their rapid evolution. Albaillellaria are important for stratigraphy, in particular the Follicucullidae, which is the main age-diagnostic clade between the Bashkirian (Pennsylvanian) and the Wuchiapingian (late Lopingian, Permian) (Aitchison et al. Reference Aitchison, Suzuki, Caridroit, Danelian and Noble2017).
The family Follicucullidae consists of as many as 75 species, but only three genera (Follicucullus, Ishigaconus, and Parafollicucullus) are regarded as valid, based on the consensus decision of the Paleozoic Genera Working Group (Caridroit et al. Reference Caridroit, Danelian, O'Dogherty, Cuvelier, Aitchison, Pouille, Noble, Dumitrica, Suzuki, Kuwahara, Maletz and Feng2017; Noble et al. Reference Noble, Aitchison, Danelian, Dumitrica, Maletz, Suzuki, Cuvelier, Caridroit and O'Dogherty2017). Eleven available genera had been established in this family, but the remaining eight genera were synonymized because of poorly preserved holotypes (e.g., Longtanella) or different opinions concerning species-level criteria. Some questions also arose from recently published papers. For example, Nestell and Nestell (Reference Nestell and Nestell2020: p. 10) thought that “Haplodiacanthus should be a valid genus” and urged the necessity of reevaluating many follicucullid genera. The poor preservation of the Longtanella holotype was agreed by all members without opposition at the time. Later, several Chinese researchers identified some other “true” Longtanella species, which impacts on the identity of the topotype of Longtanella. It was concluded that this genus differs from Parafollicucullus by its turri-form, slightly bent test, and the absence of an obvious wing or pseudothorax (Ito Reference Ito2020). A further differing opinion concerns Cariver: in “The Paleozoic Radiolarian Genera Catalogue,” it is synonymized with Follicucullus based on the assumption that differences in the size of the ventral lingula indicate intrageneric variation. However, Nakagawa and Wakita (Reference Nakagawa and Wakita2020) noted that the developmental location of the ventral lingula is on anatomically opposite sides in both genera. Therefore, it is impossible to explain the differences as intrageneric variation without flipping the anatomical left and right, and thus Cariver is identified as a valid genus. Except for this case, however, reasons for identifications of genera have not been clearly explained. Therefore, the subjectivity of these choices to lump or split genera should be tested using more objective means.
Here, we evaluate the traditional genus taxonomy by using two mathematical methods: (1) Hayashi's quantification theory II (HQT-II), a qualitative discriminant multivariate statistical technique (Dong et al. Reference Dong, Zhou and Xia1979; Tanaka Reference Tanaka1979; Hayashi Reference Hayashi and Hayashi1988; Kan and Fujikoshi Reference Kan and Fujikoshi2010); and (2) a phylogenetic analysis using maximum parsimony, performed using TNT software. As explained later in detail, the former is a general statistical method to output the correct ratio of predetermined categories whose distinction parameters are based on a qualitative scale. The latter is a method to explore evolutionary relationships. If HQT-II verifies the composition of species based on some genus concept, this could be independent of their evolutionary relationships, whereas the parsimony analysis should provide a robust phylogenetic genus concept that reflects relationships. These two methods are founded on different mathematical backgrounds, so if they converge on the same result, this confirms its robustness. This paper is the first trial of HQT-II and parsimony analysis in radiolarian studies, and this is also probably the first time the method has ever been used in paleontology.
Material and Methods
Meta-dataset
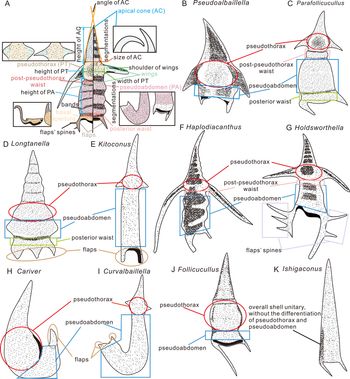
The dataset is derived from our own specimens, in particular Longtanella, and publications (Supplementary Table 1, Supplementary Fig. 1). The terminology of Follicucullidae species is shown in Figure 1. We adjusted the taxonomic concepts as we have discussed previously (Xiao et al. Reference Xiao, Suzuki and He2018: p. 199).
Diagrammatic illustration (not real species) showing the terminology and measured traits of Follicucullidae species (A) and sketch of the type species of the genera (B, Pseudoalbaillella scalprata; C, Parafollicucullus fusiformis; D, Longtanella zhengpanshanensis; E, Kitoconus elongata; F, Haplodiacanthus anfractus; G, Holdsworthella permica; H, Cariver charveti; I, Curvalbaillella u-forma; J, Follicucullus ventricosus; K, Ishigaconus scholasticus).

The meta-dataset comprises 53 morphological features with 175 states for the 75 taxonomically stable species (including 15 undescribed morphospecies from our own materials). As the applicable measurement scale for both HQT-II and TNT is the statistical ordinal scale or nominal scale of Stevens (Reference Stevens1946), morphological features were coded as binary (0, 1) in the case of characters that are present or absent and as a stepped code (0, 1, 2, …) for metric continuous characters (Supplementary Table 2).
Hayashi's Quantification Theory II
HQT-II is one of four methods of quantification introduced by a Japanese statistician, Chikio Hayashi, who also coined the now widely used term “data science” in 1996. He developed his methods to deal with qualitative data, and they are widely used in Asia in many fields, such as the geologic, environmental, and medical sciences and civil engineering (Hayashi Reference Hayashi1950; Matsuba et al. Reference Matsuba, Ding, Liu and Chiba1998; Li et al. Reference Li, Gu, Okada and Levy2005; Takasawa et al. Reference Takasawa, Tanaka, Gonda and Kawabe2010). HQT-II aims at discrimination and classification of samples by establishing discrimination functions based on several variables of known types. It is mathematically equivalent to canonical analysis applied to dummy variables corresponding to categorical data or discriminant analysis in multidimensional situations. The unique feature of HQT-II and related methods is that all work with qualitative data that can be quantified before analysis using a qualitative external criterion to predict or analyze the effects of the factors while seeking to maximize the correlation ratio (Tanaka Reference Tanaka1979).
Among novel methods applied over the years to paleontological questions, numerical taxonomy, introduced to paleobiology in the 1970s, comprises a suite of multivariate statistical methods to handle large databases of numerical and categorical data. As HQT-II was established in the 1950s (e.g., Hayashi Reference Hayashi1954), the approach is older than numerical taxonomy, and we feel it is useful to introduce the method to a wider audience outside Asia. HQT-II represents a third broad statistical approach, different from classic frequentist and Bayesian approaches.
Bayesian statistics have been used ever more widely in recent years, including paleontology (e.g., Xiao et al. Reference Xiao, Suzuki and He2018), applying algorithms of probability using the likelihood function based on probability theory and random variables. Bayesian discrimination can predict a sample classification based on prior information, but we could not identify any Bayesian methods that are relevant to HQT-II. In comparison to frequentist and Bayesian statistics, HQT-II has the advantage of simplicity. The basic principle of HQT-II is to obtain the centroid of each sample and the center point of each group in multidimensional space and calculate the distance from each sample centroid to the center point. The smallest distance from the centroid of the sample to the center point of the groups determines the group for the sample. This method involves a small amount of calculation and offers high discrimination accuracy associated with weight determination, and is thus suitable for discrimination classification problems that rely on multiple factors.
Before HQT-II analysis, multicollinearity has to be resolved (Kumari Reference Kumari2008), in this case through correlation analysis. We performed HQT-II and associated analyses with the statistical add-on, BellCurve for Excel v. 3.20 (Social Survey Research Information Company). The categorical dataset for HQT-II comprises “categorical external variables” and “classification into more than 2 or 3 groups” (Hayashi Reference Hayashi and Hayashi1988; Kan and Fujikoshi Reference Kan and Fujikoshi2010). In our study, the former is relevant to assigning species to a genus, whereas the latter is relevant to categorical morphological characters. We performed a correlation analysis, then the HQT-II analysis itself, and then a cluster analysis. HQT-II outputs the following data, including some mathematical requirements: discriminant result (Table 1), correlation ratio η2 (Table 2), centroid of each group (Supplementary Table 3), range (Table 3, Supplementary Table 4), category score (Supplementary Table 5), sample score (Supplementary Table 6), and group scatter diagram (Fig. 2). The interpretation of these output data will be explained in the “Results and Interpretations,” where necessary.
Group scatter diagram generated from Hayashi's quantification theory II, showing the visualized display of the clusters of Follicucullidae species with two selected axes (six patterns of dimension plots containing: A, axes 1 and 2; B, axes 2 and 3; C, axes 3 and 4; D, axes 4 and 5; E, axes 5 and 6; F, axes 6 and 7).

Discriminant result conducted using Hayashi's quantification theory II.

Correlation ratio conducted using Hayashi's quantification theory II.

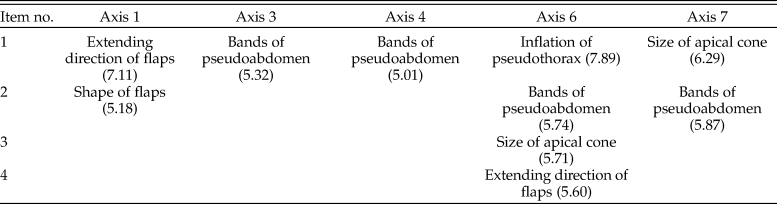
Partial range score in the axes that are higher than 5.00.

The R package RQDA (Huang Reference Huang2016) can be used to perform qualitative data analyses similar to HQT-II, but as yet there is no full implementation available in R. We provide R code here written by S. Aoki from Gunma University, Japan (Supplement 1 in the Supplementary Material).
Phylogenetic Analysis
Phylogenetic analysis was conducted using the New Technology search in TNT v. 1.5 (Goloboff and Catalano Reference Goloboff and Catalano2016), a standard analytical tool for parsimony analysis. TNT does not evaluate the reliability of assignment of species to genera, but it can output synapomorphy lists at nodes. A time tree was constructed with the paleotree package (Bapst Reference Bapst2012) in R, with stratigraphic ranges of species from their first and last appearance data. We considered only those 38 species with known stratigraphic ranges (Xiao et al. Reference Xiao, Suzuki and He2018; Zhang et al. Reference Zhang, Feng and He2018), and Holdsworthella annulata and Holdsworthella nodosa were chosen as outgroup taxa because of their greater stratigraphic age. Then, an ancestral state reconstruction (ASR) of phylogenetically informative characters was conducted at the genus level in R with the ape package (Paradis and Schliep Reference Paradis and Schliep2019) to track models of trait change.
Results and Interpretations
Correlation Analysis
The data matrix size of HQT-II is limited by mathematical requirements and software architecture (Kan Reference Kan2017). The BellCurve for Excel program has a limit of 10 groups for HQT-II. According to the equation (Kan Reference Kan2017: p. 119), “the number of states minus the number of morphological features” must be reduced to 64. For this purpose, we used Cramer's V metric in correlation analysis to check for multicollinearity among parameter lists (Supplementary Table 7), and we preferred those morphological features with small absolute values of Cramer's V (<|0.45|, following the criteria of Kan and Fujikoshi Reference Kan and Fujikoshi2010). After several filtering steps (Supplementary Table 8), 25 morphological features were selected for HQT-II (Supplementary Table 9), which is also the objective minimum essential list of morphological characters at the species level that are supported by correlation analysis.
Hayashi's Quantification Theory II
We first allocated the 75 species to 10 split genera manually, based on comparisons of type species. This a priori classification was evaluated with HQT-II using the 25 morphological characters and 84 morphological states, resulting in 100% discriminant accuracy (Table 1). The discriminant accuracy is a fitness ratio of how well HQT-II predicts the genus to which a species belongs when compared with our manually classified genera. HQT-II outputs the correlation ratio η2, the ratio of between-group variation divided by the total variation on each output axis. Referred to η2 (0 means no contribution to discriminant result, and 1 is the full contribution), the first seven axes (>0.9) make very strong contributions to the discriminant result (Table 2). According to their ranges, the characters that correspond to each axis are objectively calculated (Table 3, Supplementary Table 2). Characters that score high values (>5.00) give an insight into the combinations of important characters that covary.
The prediction of the sample classification by HQT-II is determined by the distance of the sample score from the centroid of each group. The output of HQT-II is a multidimensional space of nine axes, and we summarize the data in a two-dimensional scatter diagram (Fig. 2, plotted using the sample score of Supplementary Table 6) with two selected axes (axes 1 and 2 in the case of Fig. 2A). The origin (x = 0 and y = 0) is read as the average condition of all data, the centroid of each genus as the average condition of the relevant characters on each axis, and the distances between genera as the statistical isolation distances. Because the scores of the first seven axes are so high (>0.9), all axes look equally important. The maximum number of combinations of results with two axes from these seven comprises 21 patterns, so we cannot show all of them. Instead, six patterns of dimension plots (e.g., axis 1 and 2, axis 2 and 3, …) are shown in Figure 2. The plot on axes 1 and 2 (Fig. 2A) shows complete separation of all 10 genera. The dimension plot map on axes 2 and 3 (Fig. 2B) shows a continuous group comprising Curvalbaillella, Longtanella, Parafollicucullus, and Haplodiacanthus, which is fit empirically based on our assumptions of similarity among these four genera. The dimension plot map on axes 3 and 4 (Fig. 2C) makes a continuous line between Curvalbaillella and Follicucullus, in line with our empirical observation that they share a similar very long shell. The plot map on axes 4 and 5 (Fig. 2D) differs from the previous plot maps in showing two clusters of species: an aggregated generic cluster composed of Follicucullus, Holdsworthella, Ishigaconus, Kitoconus, and Longtanella, and a second cluster of Pseudoalbaillella, Parafollicucullus, Cariver, and Haplodiacanthus. These two clusters, however, can also be thought of as one curve, and if so, this can be regarded as an example of the “horseshoe or Guttman effect.” This effect often occurs when one axis is highly dominant, and the second axis then becomes a quadratic transformation of the first (Clausen Reference Clausen1998: p. 28). Although Clausen (Reference Clausen1998: p. 28) also commented that “the horseshoe pattern does not exist here as an artifact” in some cases, it is presumably the Guttman effect. The plot map between axes 5 and 6 (Fig. 2E) also looks as if it shows a horseshoe pattern if Follicucullus and Cariver are ignored. The risk of a Guttman effect among axes 4, 5, and 6 is unclear, but it might well be suspected. The plot map between axes 6 and 7 (Fig. 2F) forms a curved line except for Curvalbaillella and Haplodiacanthus, which might reflect our feeling that these genera belong to the same family and the remaining two genera look different from the majority of Follicucullidae. The interpretations of axes are discussed in the Supplementary Material (item 2) based on the simple correlation coefficient (Supplementary Table 10).
Cluster Analysis
The score list output by HQT-II for the first seven axes was employed to make a dendrogram for visualization of distances among the 75 species and morphospecies using the Ward method (Fig. 3). The dendrogram identifies 10 obvious small groups at the 4.0 level, eight midsize groups at the 6.0 level, and three large groups at the 12.0 level, suggesting that the division into 10 genera is objectively confirmed. Taking account of the ease of identification and the hypothesis of the so-called Follicucullus lineages (e.g., Wang et al. Reference Wang, Luo and Yang2012; Zhang et al. Reference Zhang, Ito, Feng, Caridroit and Danelian2014), an appropriate number of clusters is set as eight at a threshold value of 6.0: 17 species, all belonging to Longtanella in cluster 1; 4 Curvalbaillella and 2 Kitoconus species in cluster 2, which is synonymized herein as Curvalbaillella; 17 Parafollicucullus species in a strict sense in cluster 3; 5 Haplodiacanthus species in cluster 4; 7 Holdsworthella species in cluster 5; 6 Pseudoalbaillella species in a strict sense in cluster 6; 3 Follicucullus and 7 Ishigaconus species (synonymized herein as Follicucullus) in cluster 7; and 7 Cariver species in cluster 8. It is worth specific mention that there are no species switches between genera, as shown by the 100% discriminant ratio under HQT-II.
Dendrogram of the cluster analysis, highlighting eight clusters that map closely to generic names of Follicucullidae. Genus abbreviations: L, Longtanella; Cu, Curvalbaillella; K, Kitoconus; Pa, Parafollicucullus; Ha, Haplodiacanthus; Ho, Holdsworthella; Ps, Pseudoalbaillella; F, Follicucullus; I, Ishigaconus; Ca, Cariver.

Phylogenetic Analysis
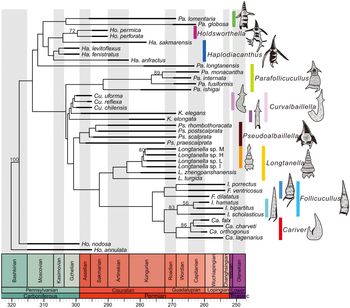
After analyzing the data matrix under the parsimony criterion, one tree was obtained with tree length 275 (consistency index = 0.400, retention index = 0.701). Most bootstrap values are more than 50. A time-calibrated phylogenetic tree with a geologic timescale and a full stratigraphic range for each taxon is shown in Figure 4. Regardless of the different numbers of species and different mathematical logic between cladistics and HQT-II, the clades in the phylogram coincide with the eight generic clusters discovered by HQT-II, with one exception, indicating the high robustness of the eight-genus division scheme. Figure 4 shows six major clades: (1) Haplodiacanthus (sensu lato)–Holdsworthella (sensu lato)–part of Parafollicucullus clades (lineage I), (2) the remaining Parafollicucullus clade (lineage II), (3) Curvalbaillella (sensu lato) clade (lineage III), (4) Pseudoalbaillella clade (lineage IV), (5) Longtanella clade (lineage V), and (6) Follicucullus–Cariver clades (lineage VI). As shown, Parafollicucullus is a polyphyletic group of lineages I and II. This raises a question about the distinguishing character(s) of Parafollicucullus at the genus level. This extinct polyphyletic group is also considered in terms of homology, because molecular phylogenetic studies for extant Radiolaria and Phaeodaria except for Spumellaria identify strong homology at the level of superfamilies and suborders (Class Acantharea by Decelle et al. [Reference Decelle, Suzuki, Mahé, de Vargas and Not2012], Class Phaeodaria by Nakamura et al. [Reference Nakamura, Imai, Yamaguchi, Tuji and Suzuki2015], Order Nassellaria by Sandin et al. [Reference Sandin, Pillet, Biard, Poirier, Bigeard, Romac, Suzuki and Not2019], and Order “living Entactinaria” by Nakamura et al. [Reference Nakamura, Sandin, Suzuki, Tuji and Not2020]). The original diagnosis of Parafollicucullus is “bilaterally symmetrical, imperforate siliceous shells of unknown internal structure with apical cone, winged pseudothorax and ring-like pre-pseudoabdominal segment interposed between pseudothorax and pseudoabdomen” (Holdsworth and Jones Reference Holdsworth and Jones1980: p. 285). Parafollicucullus in both lineages I and II possesses these characters, but species in lineage I (Parafollicucullus lomentaria and Parafollicucullus globosa) differ in having a long and straight apical cone, inflated pseudothorax, and undulating pseudoabdomen. These characters are not seen in any species of Parafollicucullus in lineage II. On the other hand, all the species grouped in lineage I (Holdsworthella and Haplodiacanthus) have these three characters. If we simply follow the original diagnosis, “Parafollicucullus” in lineage I is empirically differentiated from “true” Parafollicucullus, and here we propose Parafollicucullus(?) for the “Parafollicucullus” species in lineage I to distinguish them from Parafollicucullus in lineage II. These characters were overlooked before. This morphological parameter appeared with high scores (>5.00) on axes 4, 6, and 7 in HQT-II (Table 2). The principle in HQT-II is mathematical independence among the axes, but several similar morphological parameters were scattered on different axes in HQT-II. This might be helpful to determine the cause of mismatch between both methods.
Time-calibrated phylogenetic tree of Follicucullidae, with geologic time scale, generated using TNT and R. See caption for Fig. 3 for genus abbreviations. Thick black lines are known geochronological ranges, whereas thin black lines are ranges of unknown ancestor(s) or the true range of species for which dated specimens have not been reported.

Ancestral State Reconstructions
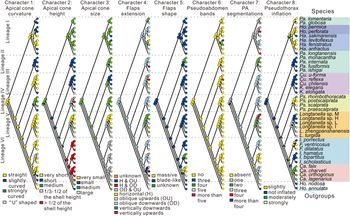
The characters evaluated for ASR under the equal-rates model are those that have larger values in the range output by HQT-II: curvature (character 1), height (character 2), and size (character 3) of the apical cone, extent (character 4) and shape (character 5) of the flaps, bands (character 6) and segmentations (character 7) of the pseudoabdomen, and inflation of the pseudothorax (character 8). It turns out that most descendants kept the plesiomorphic state for almost all characters (Fig. 5), and the distributions of some characters represent clear generic-level groupings. We trace morphological changes across the phylogeny in chronological order.
Parsimony ancestral state reconstruction based on the phylogenetic tree for the eight chosen taxonomically important morphological characters in a maximum likelihood framework. Different states of traits are colored. Pie charts represent empirical Bayesian posterior probabilities (trait values) of ancestral states for each node in the phylogenetic tree. See caption for Fig. 3 for genus abbreviations. PA, pseudoabdomen; PT, pseudothorax.

As shown by green and blue dots in characters 1, 2, and 3 (Fig. 5, color figure online), the apical cone of the ancestral species is straight, and medium in height and size. Most descendants inherit the straight apical cone, except for lineage IV, where it is strongly curved, and lineage II, where it is slightly curved. The height and size of the apical cone varies greatly in the descendants, while lineage VI obviously possesses a larger apical cone than the others (red dots in character 2 and gray dots in character 3). By contrast, the apical cone of lineages II and III became smaller (blue dots in character 2 and character 3). The flaps of the ancestral species are blade-like and extend obliquely downward, and most descendants kept this feature, while members of the Cariver group possess a massive and upwardly extended flap (yellow in character 5). The bands of the pseudoabdomen are also significant when deciding the genus, but only some species differ morphologically from their ancestors (character 6). Trends in segmentation of the pseudoabdomen show a decreasing trend, in that most species and nodes retain the one-segment state (character 7). Pseudothorax shape started with a noninflated appearance in the ancestral species, and this condition is retained in lineages II and III (blue dots in character 8), but the pseudothorax became inflated in other species; in lineage I it became slightly inflated (yellow dots), and in many members in lineages V and VI it became more inflated (green and yellow dots).
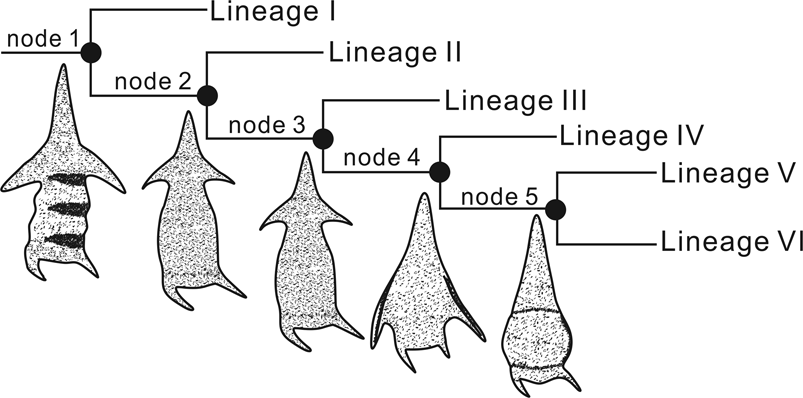
Overall, for all lineages, plesiomorphies are a straight apical cone with medium height and size, blade-like flaps that extend obliquely downward, three-segmented pseudoabdomen without bands, and uninflated pseudothorax (Table 4, Fig. 6). Synapomorphies for different lineages include short apical cone in lineage II, single segmentation of pseudoabdomen in lineages III and IV, strongly curved apical cone in lineage IV, and large apical cone more than  ${1 \over 2}$ of the shell height in lineage VI.
Simplified diagram showing the plesiomorphies indicated at the various nodes. The detailed traits are listed in Table 4.

Synapomorphies and plesiomorphies indicated at various nodes and lineages. The node numbers refer to Fig. 6 caption.

Discussion
Taxonomic Concepts and Data Manipulation
In coding character states, we found that holotypes are generally the best-preserved specimens of the wider sample published with the initial descriptions. Therefore, in our analysis, we largely refer to holotypes, but checked the accuracy of character coding with paratypes. In rare cases, we used paratypes if the holotype specimen was partly broken. Species variation was considered in compiling the synonymy lists and the illustrations (e.g., Wang et al. Reference Wang, Luo and Yang2012; Ito et al. Reference Ito, Feng and Matsuoka2015) and our own tests. A categorical approach was used to deal with species variation. If a character has extensive variation, two or more character states were assigned to some species (see Supplementary Table 2). In some cases, we coded character states as “?” if there was no information in the literature.
Further, we took care in designing intervals of continuous quantitative characters. Different specimens within a single species may vary in some characters, for example, the height of the pseudothorax. Thus, when the characters were designed, we used the widest intervals of length ratios to accommodate the maximum number of specimens within a species, like  ${1 \over 3}-{1 \over 2} $.
An Objective Method to Choose Distinguishing Morphological Features at the Genus Level
The motivation of this study was to evaluate the plausibility of genus definitions based on splitting and lumping. The prior three-genera scheme for the Follicucullidae (Parafollicucullus, Ishigaconus, Follicucullus) was based on the quality of the type material and descriptions that rely on distinct characters. In the case presented here, six lineages are favored, with one lineage lumping two of the three genera from the Paleozoic catalogue (Ishigaconus + Follicucullus) and some previously poorly described and figured genera, especially Longtanella, being reconstituted based on a wider character matrix across all species within the clade than was used in the original typological work.
Correlation analysis was applied first to reduce any multicollinearity, in case related characters might artificially dominate the results. For example, the apical cone angle largely decides the apical cone size of radiolarians, as shown by their high correlation coefficient. This could be useful for detecting more inconspicuous related characters in other biota. In the current case study, HQT-II has proved to be a powerful tool to evaluate genus categories. The advantage of HQT-II is its reliability in a wide variety of scientific applications as a general multivariate analysis method, and it is applicable for any species whose stratigraphic ranges are unknown. Compared with discriminant analysis, whose explanatory variables can only be quantitative, HQT-II is more flexible in dealing with classification in paleontology. Qualitative and quantitative characters of taxa can be readily coded and processed without weight determination.
Morphological Evolution of Six Lineages and Competing Models
HQT-II and cladistics resulted in a clear demonstration of the taxonomic validity of the genera Haplodiacanthus (lineage I), Parafollicucullus (lineage II), Curvalbaillella (lineage III), Pseudoalbaillella (lineage IV), Longtanella (lineage V), and Follicucullus and Cariver (lineage VI). These objective lineage trees permit us to reconstruct morphological evolution and evaluate the likelihood of previous evolutionary studies. Our attempt to specify morphological characters at the genus level produced a minimal list of eight possible conditions of four traits (curvature, height, and size of apical cone; extension pattern and shape of flaps; inflated condition of pseudothorax; number of bands and segments in pseudoabdomen) (Table 5). These eight characters were evaluated through ASR, because they scored high values in the range output by HQT-II, meaning they are the most important in defining the different groups. Table 5 and Figure 5 also show that it is very difficult to pinpoint a genus name by a single state of a single trait; a combination is essential. In reference to the original definition/diagnosis for each genus, a huge number of morphological characters can be excluded from the minimum essential list (the rightmost column of Table 5). As listed in Table 5, 88 cells comprising eight morphological states and 11 “genera” are filled with state conditions. By comparison with the original description of each genus, 9 of the 88 cells (10.2%) exactly match the original description. Eleven of the 88 cells (12.5%) partly match the original description. The remaining 68 of the 88 cells (77.3%) are not clearly written in the original description. As Noble et al. (Reference Noble, Aitchison, Danelian, Dumitrica, Maletz, Suzuki, Cuvelier, Caridroit and O'Dogherty2017) suggested, this means it is essential to revise the genus definitions, but some problems remain in the minimum essential character list, as discussed later.
Character list and abandoned morphological characters from the initial definition. Black cells mean that the trait exactly fits with the diagnosis; gray cells mean that the trait partly fits with the diagnosis; cells with no background present newly recognized traits from this study.

The dated phylogeny (Fig. 4) and the ACS trees (Fig. 5) can be compared in a general way. For example, we include in Figure 4 only species whose time range is known, so some taxa from Figure 5 are not included. Noting that we show the known fossil ranges in Figure 4 (thick black lines) as well as the minimum inferred ranges (thin black lines), we can compare the major lineages identified through the HQT-II method (Fig. 5).
Lineage I is the Haplodiacanthus (sensu lato)–Holdsworthella (sensu lato)–Parafollicucullus(?) clades. In this lineage, species possess a medium-sized apical cone and multiply segmented pseudoabdomen. Lineage I ranges from the Gzhelian to middle Capitanian, but diverges from other lineages in the early Moscovian. The previously identified portion of lineage I was limited to “Pa. longtanensis-Pa. globosa” by Wang et al. (Reference Wang, Luo and Yang2012). This lineage is marked by decreasing segmentation of the pseudoabdomen (Fig. 7), supporting the importance of this character. Those Parafollicucullus(?) species that fall in lineage I (Pa.(?) lomentaria, Pa.(?) globosa, Pa.(?) longtanensis) may be placed in a new genus in future in order to resolve the polyphyletic condition.
Prior models on the “Pseudoalbaillella” lineages recognized in Follicucullidae from previous work (Ishiga Reference Ishiga1983; Wang et al. Reference Wang, Luo and Yang2012) and our models. Abbreviations: Kas., Kasimovian; Gzh., Gzhelian; Ass., Asselian; Sak., Sakmarian; Roa., Roadian; Wor., Wordian; Cap., Capitanian.

Lineage II is the Parafollicucullus clade exclusive of lineage I Parafollicucullus(?). All species in this lineage possess a short and slightly curved apical cone. It is noted that the type species of Pseudoalbaillella (Ps. scalprata) is placed in lineage IV after node 3, where lineage II (Curvalbaillella sensu lato) diverges from lineages III–VI (Fig. 6). As far as we know, there has been no previous phylogeny connecting the type species of Pseudoalbaillella and Parafollicucullus (Pa. fusiformis). Instead, Wang et al. (Reference Wang, Luo and Yang2012) recognized two lineages “Pa. ishigai-Pa. longtanensis-Pa. fusiformis” and “Pa. fusiformis-Pa. internata-Pa. monacantha” (Fig. 7). Our result excludes Pa. longtanensis from lineage I. The first lineage involves transitions in decrease of segmentation of pseudoabdomen, whereas the second involves transitions in degeneration of the ventral wing. Although the latter character is not recognized in this study as an important trait in genus-level groupings, the phylogram (Fig. 4) supports their opinions, except for Pa. longtanensis.
Lineage III is the Curvalbaillella (sensu lato) clade, and we include here members of the genus Kitoconus, which we identify also as Curvalbaillella. The difference between these two genera is the curved or straight long pseudoabdomen. Our result is that species in lineage III have a straight apical cone, an uninflated pseudothorax, and a long unsegmented pseudoabdomen that is distinct from other taxa. We found no necessity to separate Curvalbaillella and Kitoconus, but morphotypes with the typical curved pseudoabdomen are limited to between the latest Gzhelian and early Sakmarian, so that an artificial division between the two genera may be allowable.
Lineage IV is the Pseudoalbaillella (sensu stricto) clade, in which the species possess a curved and higher apical cone and unsegmented pseudoabdomen. The verified range of Pseudoalbaillella (sensu stricto) is from late Asselian to latest Roadian. Ishiga (Reference Ishiga1983) proposed that Pseudoalbaillella evolved without Parafollicucullus (sensu stricto), and he thought that Ps. scalprata gave rise to Ps. postscalprata, which in turn gave rise to Ps. rhombothoracata (Fig. 7). Our phylogram partly supports this idea that some of the sister taxa may have direct evolutionary relationships.
Lineage V is the Longtanella clade. The species in lineage V have a straight apical cone without (or with weakly developed) wings. The evolutionary position of lineage V is involved in the evolutionary relationship among Parafollicucullus, Pseudoalbaillella, and Follicucullus in that Longtanella has been ignored in previous evolutionary models. Follicucullus was thought to originate from Pseudoalbaillella, because Pa. monacantha used to be considered a species of Follicucullus (Ishiga Reference Ishiga1991; De Wever et al. Reference De Wever, Dumitrica, Caulet, Nigrini and Caridroit2001; Zhang et al. Reference Zhang, Ito, Feng, Caridroit and Danelian2014). However, Wang et al. (Reference Wang, Luo and Yang2012) noticed that it is better to place Pa. monacantha in Pseudoalbaillella because of the evolutionary transitions, as mentioned earlier, and this opinion was confirmed by Ito et al. (Reference Ito, Feng and Matsuoka2015). Ito et al. (Reference Ito, Feng and Matsuoka2016) also drew a direct evolutionary connection from Parafollicucullus to Follicucullus, but this was not supported by our analyses, in which we identify a relationship between Longtanella and Follicucullus (Fig. 4).
Lineage VI is the Follicucullus–Cariver clade. The species belonging in this lineage are unwinged conical types with large apical cones, species of Cariver and Follicucullus. Noble et al. (Reference Noble, Aitchison, Danelian, Dumitrica, Maletz, Suzuki, Cuvelier, Caridroit and O'Dogherty2017) synonymized Cariver with Follicucullus, but they clearly form distinct clades within lineage VI (Fig. 4). Noble et al. (Reference Noble, Aitchison, Danelian, Dumitrica, Maletz, Suzuki, Cuvelier, Caridroit and O'Dogherty2017: p. 427) gave their reasons as “the type species falls well within the original diagnosis,” but this decision is rejected, because the flap develops on anatomically opposite sides in both genera (Nakagawa and Wakita Reference Nakagawa and Wakita2020).
Some further lineages were recognized, such as F. scholasticus-F. bipartitus-F. hamatus, which developed by increasing the curvature of the apical cone, and F. ventricosus-Ca. guangxiensis-Ca. charveti-Ca. orthogonus which developed by changing the direction of the flaps and the inflation of the pseudothorax (Caridroit and De Wever Reference Caridroit and De Wever1986; Wang et al. Reference Wang, Luo and Yang2012; Zhang et al. Reference Zhang, Ito, Feng, Caridroit and Danelian2014; Fig. 8). It should be noted that these key transitions are consistent with our eight morphologically important characters.
Prior models of the “Follicucullus” lineages recognized in Follicucullidae from previous work (Caridroit and De Wever Reference Caridroit and De Wever1986; Wang et al. Reference Wang, Luo and Yang2012) and our models.

Unsolved Issue
This paper has focused on a reevaluation of the genera in the family Follicucullidae using a range of objective computational methods, namely HQT-II, TNT, paleotree, and ASR. Using multivariate statistical procedures, morphological characters were selected to avoid multicollinearity. The minimum required number of distinguishing characters was limited to eight parameters (curvature, height, and size of apical cone; extension patterns and shape of flaps; inflated condition of pseudothorax; number of bands and number of segments in pseudoabdomen) (Table 5). This contributes to lowering the burden of observation with many morphological characters. These morphological characters, however, may be lost or unseen in poorly preserved follicucullid specimens. However, specialists generally seem to correctly specify the genus. This phenomenon may be understood if we consider the morphological characters omitted in the process of checking multicollinearity (Supplementary Table 7). For example, if the curvature of the apical cone cannot be examined in real samples, morphological characters with high correlation coefficient values, such as orientation of the apical cone (r = 0.87) (“Apical cone_Orientation” in Supplementary Table 7) and composition of overall shell (r = 0.64) (“Overall shell_consist” in Supplementary Table 7) may be used as alternative morphological characters. It looks strange to use “composition of overall shell,” but it may be allowable if we accept the value of the correlation coefficient. For practical identification, such alternative morphological characters become part of the definition of the genus. Morphological characters that are omitted in the process of reducing multicollinearity can be used as a backup, reflecting their statistical “redundancy,” for practical identification of poorly preserved specimens. Such “redundancy” is not achieved by the simple addition of “omitted morphological characters” in the diagnosis, because these cannot be objectively tested. We hope to consider the redundancy issue further in future.
Conclusions
The first application of HQT-II, TNT, paleotree, and ASR to the Permian follicucullid radiolarians has tested the current three-genera scheme, their hypothesized evolutionary history, and morphological evolution for eight selected morphological characters. The combination of HQT-II and parsimony analysis showed that the three-genera scheme with Follicucullus, Ishigaconus, and Parafollicucullus cannot be sustained, and that instead the family should be subdivided into 10 genera consisting of 17 Longtanella species, 17 Parafollicucullus species, 6 Pseudoalbaillella species, 6 Curvalbaillella-species, 12 Haplodiacanthus species, 10 Follicucullus species, and 7 Cariver species. The discrimination of this genus-level solution was supported 100% by the HQT-II analysis.
The phylogenetic tree analysis objectively output six follicucullid lineages. Parafollicucullus used to be thought of as the direct ancestor of Follicucullus. The validity of Longtanella has been suspected for decades, but this genus is an important sister group in evolution between Pseudoalbaillella and Follicucullus. Pseudoalbaillella, Longtanella, Follicucullus, and Cariver shared a recent common ancestor, while Parafollicucullus is polyphyletic and not so closely related to them.
Eight characters (curvature, height, and size of apical cone; extension patterns and shape of flaps; inflated condition of pseudothorax; number of bands and segments in pseudoabdomen) were chosen for their potential to discriminate species at the genus level based on their larger values in the range output by HQT-II. Then we challenged these eight traits in their ability to discriminate six lineages, and it turned out that the key transitions recognized in prior models are consistent with these eight morphologically important characters. Moreover, the usability of these important morphological characters may help to lower the burden of observation on many traits, especially for poorly preserved specimens.
Finally, we proposed a protocol to discriminate a genus-level divisional scheme and reconstruct the phylogeny: (1) preparation of a categorical dataset for each species in a family; (2) reduction of multicollinearity with correlation analysis; (3) evaluation of the current genus scheme with HQT-II; (4) confirmation of genus divisions by a cluster analysis with ranges from HQT-II; (5) reconstruction of phylogenetic trees with stratigraphically documented species from the full set of species from HQT-II; and (6) determination of major morphological characters in evolution. This protocol is functional, as shown by the case study of Permian radiolarians, and it can be applied to other taxa of macro- and microfossils in the whole field of paleontology.
Acknowledgments
We thank the editor and two anonymous reviewers for constructive suggestions for the improvement of this article. We gratefully acknowledge T. L. Stubbs (School of Earth Sciences, University of Bristol) for teaching phylogenetic tree methods in R during the short course in Wuhan in 2018. Financial support was provided by the National Natural Science Foundation of China (NSFC grant no. 41902016 and grant no. 41772016), the Fundamental Research Funds for the Central Universities (CUG grant no. CUG190612), and the State Key Laboratory of Biogeology and Environmental Geology (GBL11605). Special thanks to Tohoku University for hosting Y. F. Xiao's three-month visit from September 29 to December 25, 2019.