INTRODUCTION
A plethora of models have been developed during the past few decades with the aim of being used for various agricultural purposes. The most frequent tasks for these models include assessing productivity, yield forecasting, providing decision support at various levels (from fields to regions), risk assessment under current and expected climatic conditions (Hoogenboom Reference Hoogenboom2000) and the evaluation of adaptation strategies (Thaler et al. Reference Thaler, Eitzinger, Trnka and Dubrovsky2012). One group of published studies involving crop growth models is focused mainly on estimating crop development, yields and biomass formation for selected crops (Trnka et al. Reference Trnka, Dubrovsky and Zalud2004a,Reference Trnka, Dubrovsky, Semeradova and Žaludb; Palosuo et al. Reference Palosuo, Kersebaum, Angulo, Hlavinka, Moriondo, Olesen, Patil, Ruget, Rumbaur, Takac, Trnka, Bindi, Caldag, Ewert, Ferrise, Mirschel, Saylan, Siska and Rotter2011; Rötter et al. Reference Rötter, Palosuo, Kersebaum, Angulo, Bindi, Ewert, Ferrise, Hlavinka, Moriondo, Nendel, Olesen, Patil, Ruget, Takac and Trnka2012) due to limited data availability. Other studies are focused additionally on the reproduction of soil processes (Pedersen et al. Reference Pedersen, Petersen, Eriksen, Hansen and Jensen2007; Nendel et al. Reference Nendel, Berg, Kersebaum, Mirschel, Specka, Wegehenkel, Wenkel and Wieland2011), including achieving the proper water, nitrogen (N) and carbon (C) balance. Although model validation is usually a complicated task, it should be a precondition for the application of a model to seek answers for complex questions. Then the model can be used for assessing the economics, stability and suitability of complete crop rotations and management practices, the sustainability of agriculture and soil fertility or for answering environmental questions, such as the potential for water resource recharge, and pollution (Jego et al. Reference Jego, Martinez, Antiguedad, Launay, Sanchez-Perez and Justes2008) and C sequestration or trace gas emissions from the agricultural sector (Zhang et al. Reference Zhang, Li, Zhou and Moore2002). These issues are highly challenging at present and will probably be even more so under future climatic conditions because changes within processes such as N mineralization and leaching, among others, can be expected (Eckersten et al. Reference Eckersten, Blombäck, Kätterer and Nyman2001). Complex tools are necessary to describe and explain the processes within a plant–soil–atmosphere management system. However, higher complexity often implies greater limitations in the form of the availability of necessary input data. At the same time, increased model complexity is often linked to over-parameterization of the model (Beven Reference Beven1989), which leads to an increase in parameter-related uncertainty (Grunwald Reference Grunwald1997). Thus, validation of such models (at a certain level of detail) against measurements of various processes is paramount to estimate the uncertainty of the results achieved by applying a given model.
Model testing and validation has frequently been based on studies involving single crops (Palosuo et al. Reference Palosuo, Kersebaum, Angulo, Hlavinka, Moriondo, Olesen, Patil, Ruget, Rumbaur, Takac, Trnka, Bindi, Caldag, Ewert, Ferrise, Mirschel, Saylan, Siska and Rotter2011; Rötter et al. Reference Rötter, Palosuo, Kersebaum, Angulo, Bindi, Ewert, Ferrise, Hlavinka, Moriondo, Nendel, Olesen, Patil, Ruget, Takac and Trnka2012). However, crops perform differently in the context of different crop rotations. Crop rotation design and management are essential for achieving sustainable land use accounting for the multi-functionality (e.g. productivity, socio-economics and ecology) of agricultural land use under present and future conditions. In response to climate change and/or economic boundary conditions, farmers are already engaged in determining the composition of crop rotations, e.g. by introducing more maize and oilseed rape (Olesen et al. Reference Olesen, Trnka, Kersebaum, Skjelvag, Seguin, Peltonen-Sainio, Rossi, Kozyra and Micale2011). Adding diversity to a crop rotation and improving soil and water resources are options for increasing the resilience of the system (Reidsma & Ewert Reference Reidsma and Ewert2008) under future conditions (especially to distribute the risk of adverse weather conditions during a season). However, there is still a lack of studies testing the ability of models to cover the various crop rotation design options.
Using the HERMES model (Kersebaum Reference Kersebaum2007, Reference Kersebaum, Ahuja and Ma2011), the main objective of the present study was to assess the model's robustness and ability to reproduce the inter-annual variability in yields, biomass and, in particular, soil processes (described through soil N, organic C and water content dynamics) under various field crop rotations and for permanent grassland as an alternative vegetation cover, e.g. for locations subject to the threat of erosion (Klik & Eitzinger Reference Klik and Eitzinger2010). This validation could be employed as a starting point for subsequent studies using HERMES and similar approaches to predict changes in crop production and soil processes under future climate conditions. The potential of possible mitigation and adaptation measures within the agricultural sector could therefore also be analysed, which is an additional important task (Smith & Olesen Reference Smith and Olesen2010). For this purpose, a unique database of field experiments conducted at 12 sites with various soil-climatic conditions throughout the Czech Republic was used.
MATERIALS AND METHODS
Data
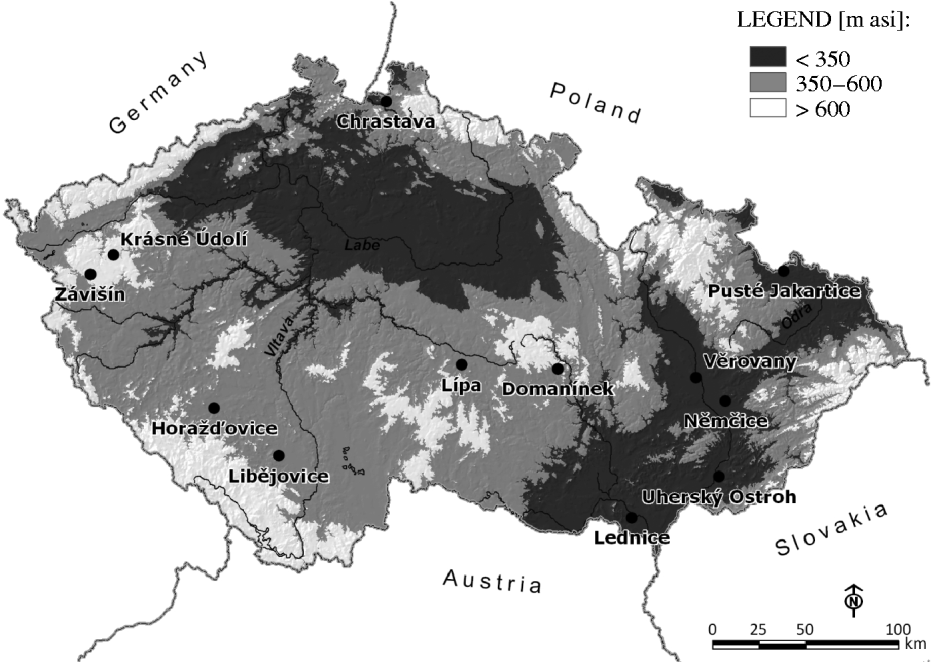
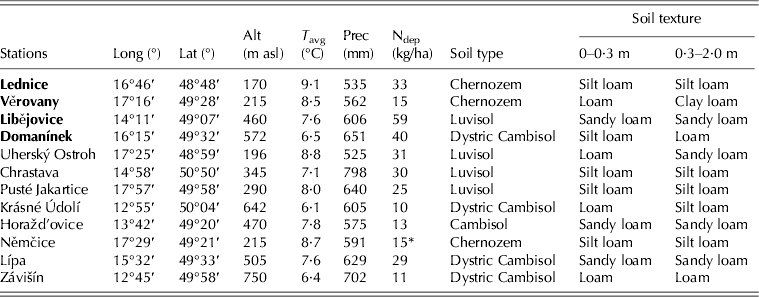
The present study was based on extensive measurements made within field experiments at 12 sites throughout the Czech Republic (Fig. 1). Their locations and an overview of their soil and climatic characteristics are summarized in Table 1. The observations made at 11 of the stations were conducted by the Central Institute for Supervising and Testing in Agriculture, CISTA (www.ukzuz.cz). The data from the experimental site at Němčice were provided by the Department of Agrochemistry, Soil Science, Microbiology and Plant Nutrition, Mendel University, Brno. The cultivated crops, in terms of sowing and harvesting, fertilization (date, amount and type of fertilizer), irrigation (date, amount and N concentration), yields, above-ground biomass at harvest, soil content of mineral N (Nmin) at several depths and, occasionally, the N content within the above-ground biomass were observed at the CISTA stations. In the case of Němčice, Nmin was monitored from 1981 to 2007, and for a shorter period the yields, soil moisture and organic C dynamics were also available. An overview of the duration of the experiments and sequences of the crops included is given in Table 2. The length of the simulated periods varied from 2 to 27 years. If unknown (for HERMES) crops or experiments with a poor description appeared within the rotation, the simulation was interrupted and reinitialized at the beginning of the season with the next crop parameterized for HERMES. The crops that have not yet been parameterized for HERMES include sunflowers and poppy seeds, which constitute a small share of the total acreage across Central Europe. In addition, the amount of N deposition taking place through precipitation was measured at each of the stations included (except Němčice). The average annual value (per experimental operating period) was then used as an important site-specific input parameter for HERMES when the Nmin dynamics were modelled (Table 1). The annual N deposition at Němčice station was estimated according to measurements made at Věrovany (the nearest station, <20 km as the crow flies).
Location within the Czech Republic of the 12 stations used in the study.

List of the stations included, their coordinates, altitudes, average temperature (Tavg), average annual precipitation (Prec), average nitrogen deposition per year (Ndep), and soil type and texture (Schoeneberger et al. Reference Schoeneberger, Wysocki, Benham and Broderson1998) for the 0–0·3 and 0·3–2·0 m layers. The stations in bold were used for model calibration
* Ndep for Němčice was estimated according to the data for Věrovany as the nearest station with measurements under similar conditions.
Overview of the experiments with different crops (sb: spring barley; wb: winter barley; ww: winter wheat; po: potatoes; gr: permanent grassland; wr: winter rape; oat: oats; sub: sugar beet; ma: maize; sm: silage maize; aa: alfalfa) simulated by HERMES. The amount of nitrogen (kg/ha) available from the fertilizers for each crop is listed under the crop abbreviations (underlined values indicate that some part was represented by manure)
* The seasons used for model calibration.
† The cultivation of potatoes at the Uherský Ostroh field station in 2001 was reported as interrupted before harvesting.
The daily meteorological data required (maximum and minimum air temperature, solar radiation, wind speed, vapour pressure and precipitation) were provided for each of the stations by the Czech Hydrometeorological Institute (www.chmi.cz). The snow model SnowMAUS, which represents an innovation within crop modelling that was developed and tested for agrometeorological applications in Central Europe (Trnka et al. Reference Trnka, Kocmánková, Balek, Eitzinger, Ruget, Formayer, Hlavinka, Schaumberger, Horáková, Možný and Žalud2010), was used to transform the meteorological input data for the HERMES model. The daily precipitation totals were thereby modified to better match the real timing and amount of water infiltration into the soil considering probable snow accumulation, melting and sublimation. During the preparation of the meteorological data, runoff was considered if the experimental site was reported to be on a slope. A simple approach based on the Soil Conservation Service Curve Number (SCS CN) method (USDA-SCS 1972) for addressing progressive runoff involving an increasing amount of precipitation (per day) and the reported slope of the location was adopted.
HERMES model
HERMES is a process-oriented model for estimating crop growth, soil water and N dynamics within arable land (Kersebaum Reference Kersebaum1995, Reference Kersebaum2007, Reference Kersebaum, Ahuja and Ma2011). According to the classification of Rötter et al. (Reference Rötter, Palosuo, Kersebaum, Angulo, Bindi, Ewert, Ferrise, Hlavinka, Moriondo, Nendel, Olesen, Patil, Ruget, Takac and Trnka2012) the HERMES crop model represents a more detailed photosynthesis-respiration approach, similar to DAISY or WOFOST, compared to models such as EPIC, CERES or CROPYSYST, which use a simpler radiation use efficiency (RUE) approach. Although the model primarily simulates N dynamics, the soil organic C content can be derived by assuming a constant C/N ratio, which is a much simpler approach in comparison with other models (Nendel et al. Reference Nendel, Berg, Kersebaum, Mirschel, Specka, Wegehenkel, Wenkel and Wieland2011). The advantage provided by HERMES is the model's ability to work with the restricted input data that are usually available at farms and to take into account the processes of net mineralization, denitrification, water and nitrate transport, plant growth and N uptake. The soil water dynamics are represented on the basis of a simple capacity approach. Within the current public version of the model (Hermes for Windows 2.04.1, Kersebaum Reference Kersebaum, Ahuja and Ma2011), the wilting point, field capacity and total pore space parameters must be provided directly or can be derived from the texture, stone content and bulk density class. Additionally, the initial organic C and C/N ratio are necessary. Several methods can be selected to estimate reference evapotranspiration within the HERMES model (Kersebaum Reference Kersebaum, Ahuja and Ma2011). The Penman–Monteith approach (Monteith Reference Monteith1965; Allen et al. Reference Allen, Pereira, Raes and Smith1998) was used in the present study, in connection with crop-specific factors (Kc) for each development stage to determine crop evapotranspiration, which could be reduced if the soil water content at the rooting depth was insufficient. Nitrate movements were estimated using the convection–dispersion equation. The estimates of net mineralization (including nitrification) employed mineralizable N divided into two pools (i.e. easily decomposable organic matter from fresh plant residues – Ndpm, and slowly decomposable parts of plants and the active percentage of soil organic matter – Nrpm). The percentage of Ndpm depends on the previous crop, while Nrpm depends on the properties of the soil organic compounds present. The mineralization process is restricted to the upper soil, to a depth of 0·3 m, and is driven by soil moisture and temperature. The denitrification loss is estimated using the nitrate content, soil temperature and water saturation within the upper 0·3 m.
The generic crop growth module is based on the SUCROS model approach (van Keulen et al. Reference Van Keulen, Penning de Vries, Drees, Penning de Vries and van Laar1982). Up to five different crop organs and 10 developmental stages can be defined in external parameter files for dry matter partitioning and phenological development in the considered crop. Dry matter production is driven by intercepted radiation and temperature and is reduced by the ratio between the actual and potential transpiration and N stress. The functions of the maximum and critical N contents during phenological development (Kersebaum & Beblik Reference Kersebaum, Beblik, Ma, Shaffer and Hansen2001) and the above-ground biomass (Greenwood et al. Reference Greenwood, Lemaire, Gosse, Cruz, Draycott and Neeteson1990; Colnenne et al. Reference Colnenne, Meynard, Reau, Justes and Merrien1998; Plénet & Lemaire Reference Plénet and Lemaire1999) determine the potential N demand and the threshold for N stress, respectively. The ability of a plant to take up N from the soil is limited by the actual length of its roots. Up to the time of flowering, the maximum rate of uptake is considered to be 30 × 10−14 mol/s/cm of root length (Barraclough Reference Barraclough1986), followed by a consecutive linear decrease to maturity (23 × 10−14 mol/s/cm). The convective N transport associated with water for transpiration is estimated. If this amount does not cover the daily demand, the maximum diffusive transport is derived for the rooted layers considering the dependency of diffusion on the soil water status. Nitrogen recycling through crop residues is calculated automatically from the simulated N uptake minus the N exported at harvest as yield and residues.
The effect of the atmospheric CO2 concentration on photosynthesis is represented through an approach following Hoffmann (Reference Hoffmann1995) in combination with a mixed Allen/Yu approach (Allen et al. Reference Allen, Pereira, Raes and Smith1998; Yu et al. Reference Yu, Goudriaan and Wang2001) describing the impact of CO2 on crop transpiration (Kersebaum et al. Reference Kersebaum, Nendel, Mirschel, Manderscheid, Weigel and Wenkel2009).
The present study followed the modifications implemented in HERMES version 2.04.1. For legumes, N fixation was calculated on a daily basis. In this case, crops attempt to take up N from the soil to achieve the optimal internal N curve. If N uptake from the soil is insufficient, N2 fixation can contribute up to a maximum of 0·74 to the daily demand. Additionally, some modifications were made to consider perennial crops (i.e. grass and alfalfa) and multiple cuttings during the year. Specifically, cutting removed above-ground biomass, leaving the roots and a fixed amount of biomass on the ground, which was used to estimate the leaf area index after cutting. Roots reached equilibrium between growth and decay. As the root death rate is a fixed rate of the existing root biomass this quasi-equilibrium is reached when biomass is at a certain level and when both decay and root growth are at approximately the same level. Nevertheless, small oscillations will occur during the year depending on the actual growth conditions. Consequent ploughing transferred all residues into the mineralization pools.
Model calibration and testing
The available data sets were split to enable model calibration and independent testing. HERMES was performed for a total of 166 experimental seasons at 12 sites (Fig. 1 and Table 2). The majority of the runs were conducted for field crops and at two stations with permanent grassland. The observations performed at Lednice, Věrovany, Libějovice and Domanínek, with different soils and climatic conditions, were used for field crop calibration. The initial crop parameter values were obtained from earlier model applications of HERMES or from the literature (van Heemst Reference van Heemst1988; Boons-Prins et al. Reference Boons-Prins, de Koning, van Diepen and Penning de Vries1993; Habekotté Reference Habekotté1997). As observations of phenology were not available from the experiments, the model was adjusted to allow it to mimic the typical duration of the phases and vegetation period. Despite the range of cultivars grown within the experimental fields, only one set of parameters for each crop (similar to an average or universal cultivar) was derived and applied. This arrangement was employed due to the limited possibility of performing detailed calibrations for each cultivar. During the calibration process, the parameters related to the length of phenophases (based on temperature sums) and assimilate partitioning were modified (step by step) to fit the expected development and observed yields, above-ground biomass, biomass and soil Nmin contents. The goal was to achieve the best fit through all of the evaluated variables based on several statistical indices (described later). Moreover, the validity of all results was checked against the observed (expected) ranges. Finally, for the two warmest stations (Lednice – calibration, and Uherský Ostroh – verification), the higher sums of degree days (by 60 °C (base temperature of 1 °C) for the phase from the double ridge to ear emergence stage and by 90 °C (base temperature of 9 °C) for grain filling) were used for spring barley. In the case of winter wheat, the increases were 50 and 180 °C, respectively. The second exception was made in the case of potatoes, which include various cultivars ranging from early to late. It was possible to identify the cultivars according to their names and terms of harvest, and the sum of degree days was then modified to match the probable range. The field crops at the Uherský Ostroh, Chrastava, Pusté Jakartice, Krásně Údolí, Horažd’ovice and Němčice stations were used to validate the suggested crop adjustments. In the case of the Horažd’ovice station, two variants associated with different N fertilization levels (Expt 1 with lower and Expt 2 with higher N fertilization) were included. For verification, the model behaviour was assessed using the observed yields, above-ground biomass at harvest and soil Nmin content. Moreover, in some cases, the N content in the above-ground biomass (also at harvest) was available and was used as an indicator of N-uptake and assimilate distribution functions. In the case of the Němčice station, the simulated soil moisture over 3 years (1983–85) and the organic C soil content in the 0–0·3 m layer (1988–96) were compared with measured values.
In addition to the field crop experiments performed within various rotations, continuous grass cover, cut regularly (twice per year), was also modelled by HERMES at two stations (Závišín and Lípa). The datasets at both stations were divided into two parts, with the first part being used for model calibration and the second part for verification. During the calibration, the specific CO2 assimilation rate and effective rooting depth were adjusted to reasonable levels, and then, similar to what was performed for field crops, the optimal lengths of six developmental phases and assimilate partitioning were estimated in a stepwise analysis. The process for alfalfa was identical.
A CO2 concentration of 350 ppm was used for the whole period and for all experiments. The initial soil Nmin content (for the 0–0·3, 0·3–0·6 and 0·6–0·9 m layers) was defined according to the measurements for the starting point of each simulation (before sowing the first crop), and the initial soil moisture was estimated (usually with a sufficient interval before the sowing date of the first crop to take into account the actual weather at the beginning of simulated growth). The initial Nmin data were excluded from the consecutive statistical analysis. At the initialization of the field crop simulations, a default proportion of 0·13 of Ntotal was assumed as the slowly decomposable fraction (Nuske Reference Nuske1983; Kersebaum Reference Kersebaum1995). For the grass experiments involving two cuttings, the default value was modified to 0·04. At the same time, the maximum effective rooting depths within the soil profile were set to 0·9 and 0·8 m for localities with field crops and grass, respectively.
Each simulated season and consequent crop rotation were defined by the crop cultivated, date of sowing and harvesting, fertilization (date, type and amount), irrigation (date, amount and N content), method for addressing residues (in the majority of cases, the residues were incorporated into the soil) and tillage (date, depth and degree of mixing).
Evaluation of model performance
For the purpose of performing a descriptive statistical assessment of the relationship between the measured and modelled quantities, the following parameters were used: the coefficient of determination (R 2), as the second order of the Pearson correlation coefficient; coefficient of determination (R 20) for the linear function passing through zero; the relative systematic error in the case of yields and above-ground biomass, as described by the slope of regression (y; equal to 1 is an optimal value); the mean bias error (MBE), as an indicator of the average systematic error (Davies & McKay Reference Davies and McKay1989) in appropriate units (e.g. in t/ha) as described in Eqn (1) and the root mean square error (RMSE), which describes the average absolute deviation between the simulated and modelled values (Eqn 2); the index of agreement (IA) according to Willmott (Reference Willmott1982) in Eqn (3); and the modelling efficiency (ME) described by Nash & Sutcliffe (Reference Nash and Sutcliffe1970), presented in Eqn (4). The IA ranges from 0 to 1, where an IA closer to 1 indicates higher simulation accuracy. The error in the case of ME is compared with the variance of the observed values. An ME equal to 1 is an optimal value, whereas negative values indicate that the mean observed value is a better predictor than the simulated values. For one type of analysis focused on productivity estimates the yields (observed and simulated) were recalculated into cereals equivalents (Petr Reference Petr1988).
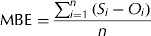 $${\rm MBE} = \displaystyle{{\sum\nolimits_{i = 1}^n {(S_i - O_i )}} \over n}$$
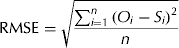 $${\rm RMSE} = \sqrt {\displaystyle{{\sum\nolimits_{i = 1}^n {(O_i - S_i )} ^2} \over n}} $$
 $${\rm IA} = 1 - \displaystyle{{\sum\nolimits_{i = 1}^n {(O_i - S_i )^2}} \over {\sum\nolimits_{i = 1}^n {(|S_i - \bar O| + |O_i - \bar O|)} ^2}} $$
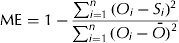 $${\rm ME} = 1 - \displaystyle{{\sum\nolimits_{i = 1}^n {(O_i - S_i )^2}} \over {\sum\nolimits_{i = 1}^n {(O_i - \bar O)^2}}} $$
where O i and S i are observed and simulated values, respectively, n is the number of samples and Ō is the mean of the observed values.
RESULTS
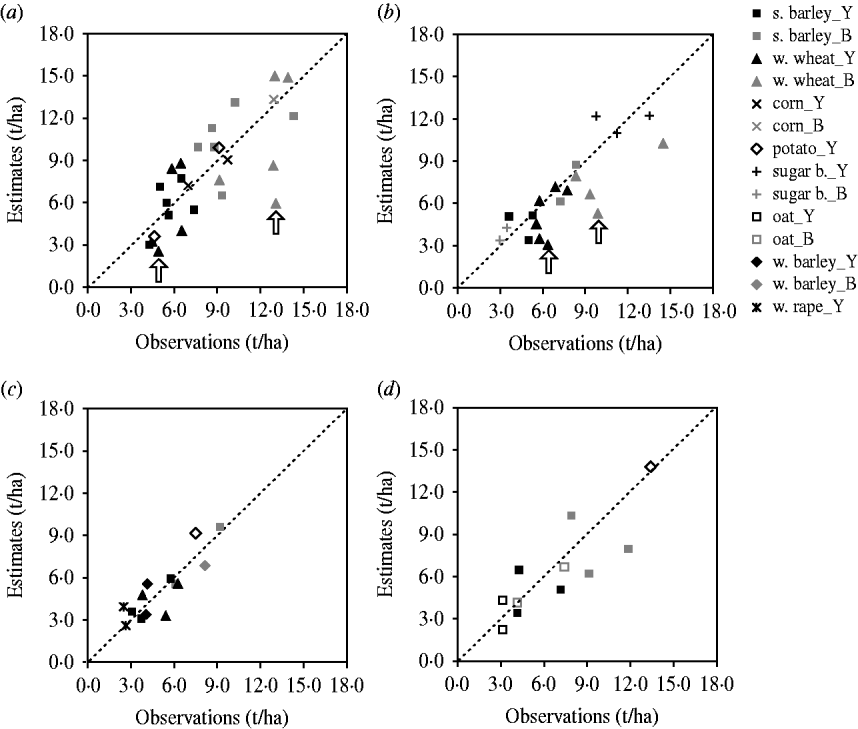
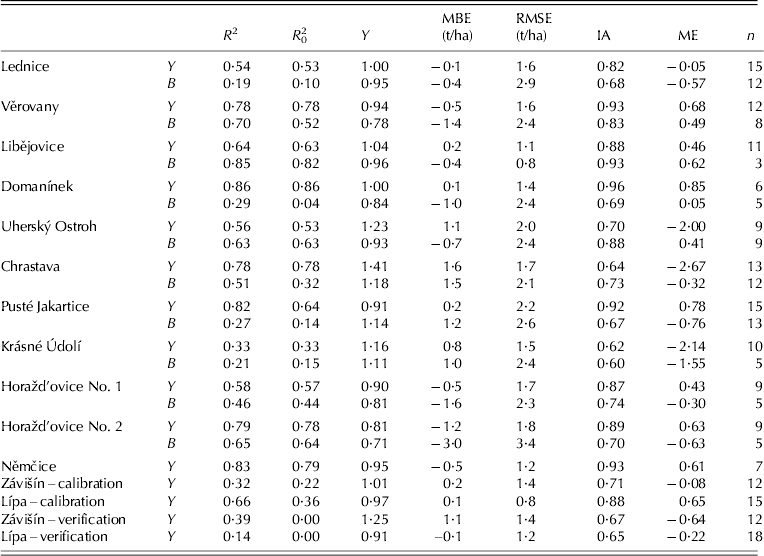
Within the HERMES calibration, the yields of field crops in rotations at individual locations (with different crops included together) were estimated at reasonable levels. The IA varied between 0·82 and 0·96, MBE between −0·5 and 0·2 t/ha, R 2 between 0·54 and 0·86 and the slope of regression (observed v. simulated) varied from 0·94 to 1·04. The amount of above-ground biomass was underestimated on average, but the accuracy of the model varied significantly according to the crop, location and year (y varied between 0·78 and 0·96 and MBE between −1·4 and −0·4 t/ha; × Fig. 2 and Table 3).
Comparison of the observed and estimated field crop yields (black symbols) and total above-ground biomass at harvest (grey symbols). The results achieved within the calibration process are depicted for the stations at (a) Lednice, (b) Věrovany, (c) Libějovice and (d) Domanínek. The yields and above-ground biomass for the dry year 2000 are indicated with black arrows.
Assessment of estimated yields (Y) and above-ground biomass (B) by the HERMES model using the coefficient of determination (R2), coefficient of determination for the linear function passing through zero (R20), slope of regression (y), mean bias error (MBE), root mean square error (RMSE), index of agreement (IA), modelling efficiency (ME) and number of included samples (n)
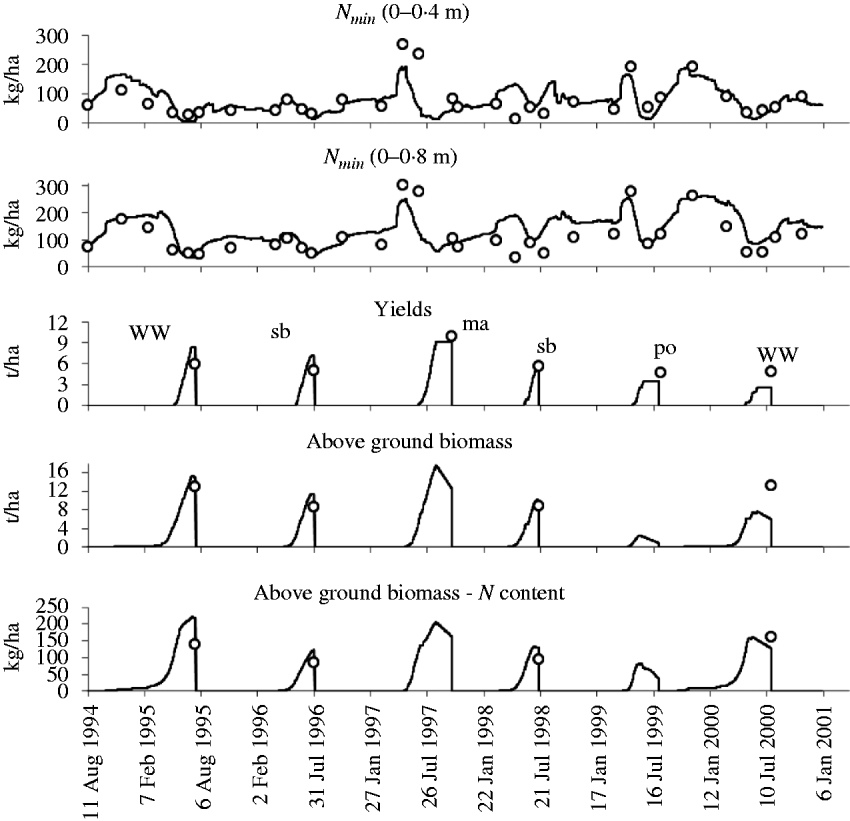
A more detailed description of the performance of HERMES under certain conditions can be obtained from Fig. 3, which depicts the results for the Lednice station. The dynamics of soil Nmin for the 0–0·4 m and 0–0·8 m layers as well as the yields, above-ground biomass development and above-ground biomass N content are shown. The values presented in the figure represent the crop rotation cycle with winter wheat, spring barley, maize, spring barley, potatoes and winter wheat cultivated from 1994 to the beginning of 2001. The performance of HERMES during the exceptionally dry year in 2000 is captured.
Comparison between the measured (circles) and simulated (lines) content of soil mineral nitrogen within the 0–0·4 and 0–0·8 m layers, yields, above-ground biomass and nitrogen content in the above-ground biomass for winter wheat (ww), spring barley (sb), maize (ma) and potatoes (po) from 1995 to 2000 at the Lednice station.
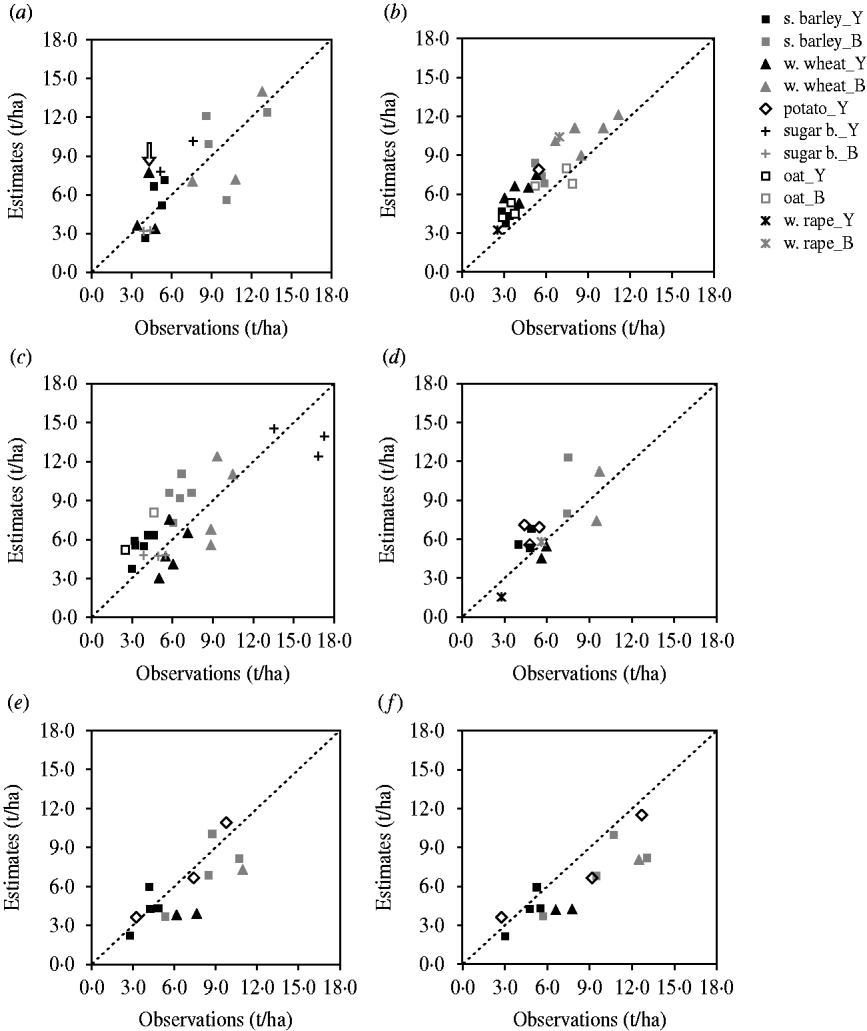
After completing the HERMES calibration, the model was applied to the set of six stations with field crop rotations to verify the achieved adjustment (Figs 4a–f, Table 3). For the yields in these cases, IA varied from 0.62 to 0.93, MBE between −1.2 and 1.6 and R 2 from 0.33 to 0.83. In comparison with the calibration results, higher systematic errors appeared. The highest yield overestimates were found at the Chrastava station (Fig. 4b, y = 1.41 and MBE = 1.6 t/ha). Figure 4a shows the effect of a high occurrence of Puccinia persistens subsp. Triticina, which affected the winter wheat yields in 1994 at Uherský Ostroh (indicated with an arrow). In the case of Pusté Jakartice, the slope of regression suggested a systematic underestimation of yields, but Fig. 4c shows that the error is apparently due to the error associated with two very high sugar beet yields that HERMES did not explain correctly. Figures 4(e) and (f) indicate the accuracy of the estimated yields within the lower and higher levels of N fertilization, respectively, at the Horažd’ovice station. The model yields almost the same values for the two treatments, which were supplied regularly with identical cattle manure doses (in combination with different mineral fertilization), and a pronounced underestimation of the yield and above-ground biomass was produced for the treatment with higher fertilization.
Comparison of the observed and estimated field crop yields (black symbols) and weight of total above-ground biomass at harvest (grey symbols) obtained within the verification process: (a) Uherský Ostroh, (b) Chrastava, (c) Pusté Jakartice and (d) Krásné údolí, and at Horažd’ovice with (e) lower and (f) higher fertilization.
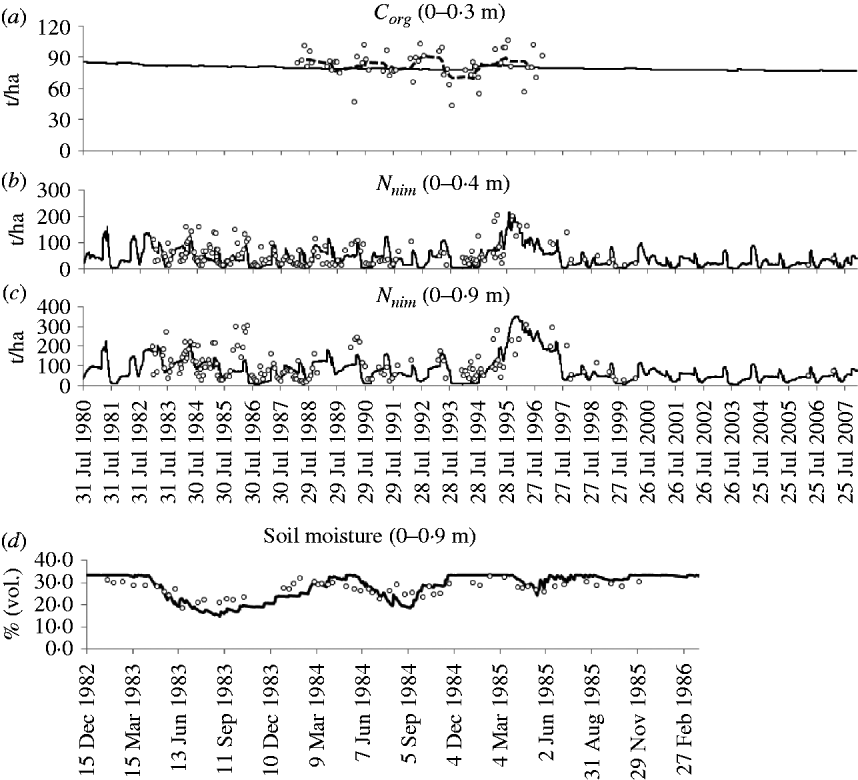
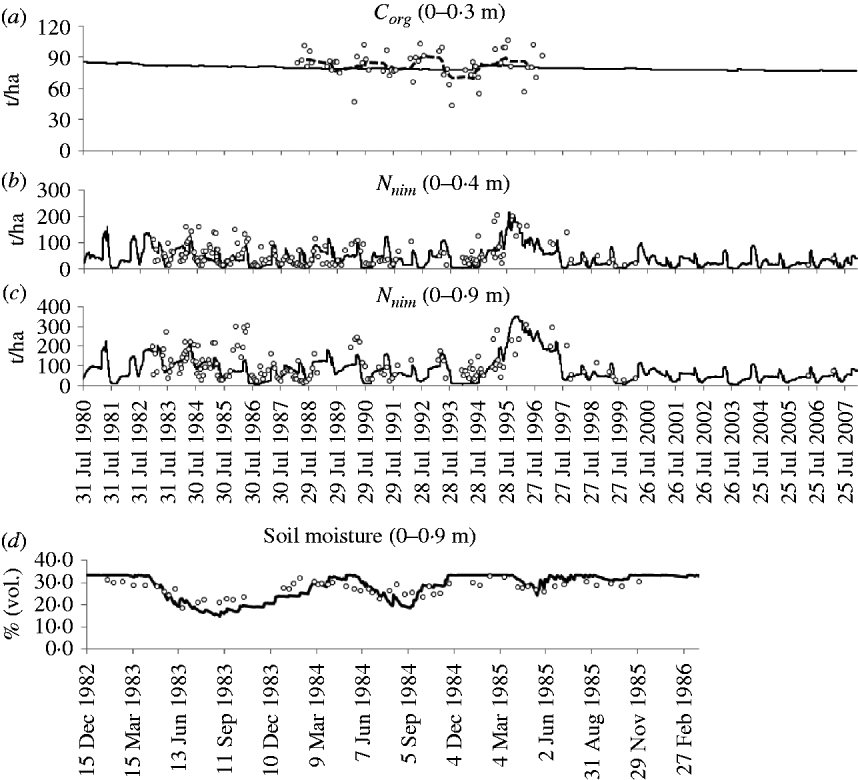
Valuable results were achieved at Němčice, where a continuous HERMES run was compared with measurements obtained in a long-term experiment from 1980 to 2007. To retain this period uninterrupted, alfalfa was introduced as a new crop cover within HERMES as part of this model exercise. Figure 5a shows the comparison of the estimated soil organic C content in the 0–0·3 m layer with the measured values. A decrease was reported by the model from c. 85 t/ha in 1980 to 77 t/ha in 2007. This decrease could be partly explained by the decreasing amounts of cattle manure applied in connection with an increase in air temperature throughout the period, leading to higher C and N mineralization. This decrease is not compensated by the cultivation of alfalfa from 1994 to 95 because most of the biomass produced is harvested. In general, the fluctuations in the measured Corg contents are much higher than the simulated values. The variability of Nmin within two different depths was successfully explained by HERMES at this station (Figs 5b and c). In this case, the higher values obtained as a consequence of the addition of alfalfa were also reproduced by HERMES, and the IAs were 0·67 and 0·68 for 0–0·4 m and 0–0·9 m, respectively. Moreover, soil moisture measurements (based on the gravimetric method and recalculated to provide the volumetric content using bulk density) were available from 1982 to 1985 at this station. In this case, HERMES reproduced the average moisture (up to 0·9 m depth) with reasonable accuracy; the MBE was 0·5% vol. and the IA was 0·78. As is apparent from Fig. 5d, the difference between the winter wheat seasons (harvested in 1983 and 1985) was distinguished by the model.
Comparison between the observed (dotted line) and simulated (solid lines) content of soil organic C, soil within the 0–0·4 and 0–0·9 m layers and soil moisture content in the 0–0·9 m layer for a long-term simulation at Němčice. The dashed curve in the case of organic C represents the running average of the observed contents (for a period with seven samples).
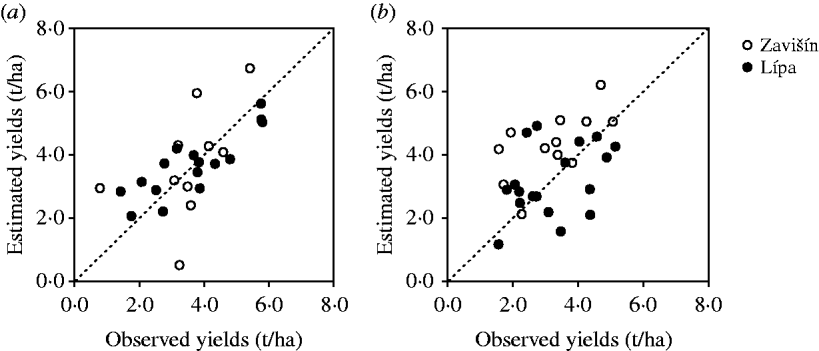
Similar to alfalfa, the present study introduced a grass stand to HERMES as a new sub-model, which required some modifications to consider permanent crop growth and the turnover of root C and N. The ability of HERMES to simulate this cover was assessed for two stations with two biomass cuttings per year (Fig. 6). A total of 160 kg N/ha was applied per year (divided into two doses) at the Závišín station, and an experiment without any fertilization conducted at the Lípa station was also included. The first half of both databases was used for the parameterization and calibration of HERMES (Table 2). The IAs for yields were 0·88 and 0·71 for Lípa and Závišín, respectively, while the MBEs were 0·1 and 0·2 t/ha. The higher uncertainty in the case of Zavišín could be due to the existence of outliers when, e.g. the first cutting in 1999 was 1 month later (in the second part of July) than usual and the second cutting was substantially underestimated (simulated as only 500 kg/ha) by the model due to the shorter period of biomass accumulation and the poor simulation of crop regeneration after the first cutting, which occurred under drought conditions. Within the verification, the explained variability was higher (R 2 of 0·39) but associated with systematic overestimation (y = 1·25, MBE = 1·1 t/ha).
Agreement between the observed and simulated yields (each cut separately) of grass within the (a) calibration and (b) verification periods at the Zavišín and Lípa stations.
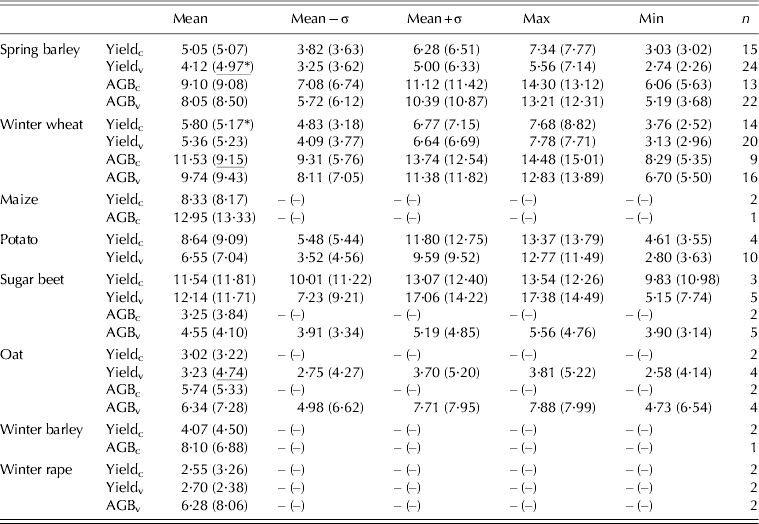
Table 4 presents a comparison of the observed and estimated yields and above-ground biomass separately for each of the included crops. Thus, the means and variability were analysed separately for the calibration and verification process. From the results obtained, it is apparent that the model depicted the differences within the crops and generally provided estimates with reasonable variability. Moreover, the average yearly productivity for each of the individually simulated crop rotations was compared with the observations. Thus, the sugar beet and potato tuber yields were multiplied by a factor of 0·25 and the seeds of winter rape by a factor of 2·0. The yields for the rest of the crops included were not subjected to any modification. The average yield production (as cereal equivalents) of the crop sequences during the calibration was observed and simulated at almost the same level (4·97 v. 4·91 t/ha/yr), and no statistically significant difference in variability was detected (P < 0·05). During the verification (the Němčice station was not included), the average yield production was 4·01 v. 4·39 t/ha/yr (observed v. simulated, respectively), without any statistically significant difference being observed for the means or variance (P < 0·05). When the cereal equivalents simulated for each crop and year separately were compared with the observed values, the IAs were 0·84 and 0·75, and R 2 was 0·51 and 0·34 (for calibration and verification, respectively).
Comparison of the mean observed (outside of brackets) and estimated (within brackets) yields (Yieldc for calibration, Yieldv for verification) and above-ground biomass (AGBc for calibration, AGBv for verification). The variability is represented by the means ± standard deviations (mean + σ; mean − σ) and maximum (max) and minimum (min) values within the samples. The number of included cases is indicated as (n). If a statistically significant difference (P < 0·05) was observed between the means of the observed and estimated (based on t-test) values, the values are underlined, while if a difference in variance (F-test, at the same level) appeared, it is indicated with an asterisk
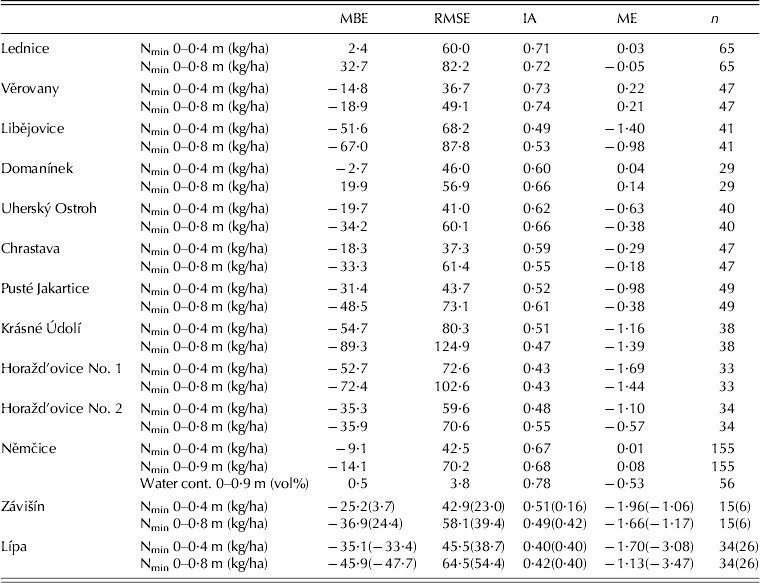
The model performance indices describing the accuracy of the soil Nmin estimates are listed in Table 5. During the calibration for the field crops, acceptable results were achieved at the majority of the included stations. However, a greater underestimation of Nmin for both assumed layers was found at Libějovice. The reason for this finding could be that the model did not sufficiently consider the long-term effect of clover (Trifolium, diploid cul. Start), which was cultivated at the experimental field in 1993 (before the initiation of the simulation), as clover is an unknown crop for HERMES. The second reason could be the reported relatively low retention capacity of the soil, which could lead the soil to experience higher percolation and consequent N leaching. The IA varied from 0·60 to 0·74 (with the exception of Libějovice, where the values were 0·49 and 0·53 for 0–0·4 m and 0–0·8 m, respectively) within the calibration. At the remaining stations (where verification for the field crops was conducted), a generally lower IA was observed (0·43–0·68), and a general trend towards underestimating the soil Nmin content appeared, as the MBE varied from −54·7 to −9·1 kg N/ha for 0–0·4 m and from −89·3 to −14·1 kg N/ha for 0–0·8 m (0–0·9 m for Němčice). From the results, it is apparent that HERMES provided results with a higher accuracy for soil Nmin in cases with higher fertilization levels, as can be observed by comparing Horažd’ovice Expt 1 v. Expt 2 or Závišín v. Lípa.
Overview of model performance focused on the soil mineral nitrogen content and soil water content (MBE, mean bias error; RMSE; root mean square error; IA, index of agreement; ME, model efficiency; n, number of included samples). In the case of grass sites, the values outside the brackets were obtained within the calibration, and the results of the verification are listed within the brackets
For spring barley and winter wheat (as crops with a sufficient number of samples), the relationship between yields (and, consequently, above-ground biomass at harvest) and the soil Nmin content after harvesting was analysed. For both crops, there was a negative relationship between the observed yield and biomass v. soil Nmin content within the database used for calibration. This finding was reproduced by HERMES only in the case of spring barley. Consequently, the errors for yields v. the errors for the soil Nmin content (0–0·4 m) after harvest were compared. For spring barley, it was revealed that within calibration runs, underestimated yields were connected with overestimated soil Nmin values. A less apparent form of this relationship was observed for the above-ground spring barley biomass. This relationship for errors was not reproduced for winter wheat during the calibration runs or verification results for either crop. This result could be due to the general weakness of this relationship, which might be overshadowed by other processes, such as the uncertainty in the modelling of crop growth and soil processes and differences in N leaching under various soil and climatic conditions.
Moreover, the influence of various CO2 concentrations (from 340 to 380 ppm) was tested, and the effect on the soil Nmin, Corg, soil moisture and yield results was minimal.
DISCUSSION
Based on the results of the present study for the HERMES model, it is considered to be robust and to reproduce complex processes within selected agricultural crops growing in the plant–soil–atmosphere system with reasonable accuracy. However, in some cases the estimates did not fit the measured processes perfectly. One source of uncertainty could be the field experiments used for which detailed phenological observations that would support better calibration were not available (because they were intended for monitoring of N-leaching and not a crop modelling experiment). Moreover, the measured soil water content used for model initialization, which is an important element for determining future crop growth (Trnka et al. Reference Trnka, Dubrovsky and Zalud2004a), was not known.
Certain deviations of the model could be explained by the use of a universal cultivar for each of the simulated crops, while in reality, various cultivars within a crop were used during the period investigated. Different cultivars were included within HERMES only for potatoes and in two cases for spring barley and winter wheat. This lack of representation could be the cause of the underestimated yields and above-ground biomass of winter wheat at Lednice and Věrovany, where the simulated growth was probably completed earlier. This shorter vegetation period in combination with the exceptionally dry conditions during the spring of 2000 resulted in a significant underestimation of biomass production and yield. The greatest underestimation of the spring barley yield and biomass at the Domanínek station was observed in 1993. In this case, flowering and, especially, the end of grain filling were estimated (on temperature sums) quite early compared with the recorded date of harvest and the situation in the remaining 2 years.
The general yield and biomass overestimates at the Chrastava station could be explained by the highest precipitation totals being recorded at this site (798 mm per year), associated with sufficient temperature and soil conditions to allow the planted (universal) cultivar to take advantage of the longer duration of the vegetation period. The second reason could be that under such conditions, the pressure from diseases could be greater, which is not assumed by the model, along with the possibility of frost damage. In the case of grass, the influence of weeds (as mentioned within the experimental documentation) could stress grass growth at Závišín and result in a difference from the model assumption of homogenous grass cover. The grass yields at Lípa were underestimated (also with a lower explained variability), which is connected to the even more underestimated soil Nmin content for the long-term experiment without N fertilization. The different results obtained for the two stations could be clarified by using universal parameters for grass stands, while the composition of species was probably different (and could evolve through time), as shown by the present-day visual assessment.
The accuracy achieved also varied for the monitored soil processes. For instance, the soil moisture results (at the Němčice station) were similar to the IA values of 0·80–0·89 reported for sandy soil at the same depth at Müncheberg by Kersebaum (Reference Kersebaum2007). The accuracy of the Nmin estimates within the calibration could also be compared with the HERMES crop rotation runs performed for sandy soil at Müncheberg by Kersebaum (Reference Kersebaum2007), with an IA higher than 0·69 being obtained. Less favourable results were achieved within the verification. The greatest Nmin underestimation was observed at Krásné Údolí and could be explained by the low soil retention capacity at this site, which is reported to be associated with high N leaching (Askegaard & Eriksen Reference Askegaard and Eriksen2007).
It is apparent that some uncertainty within the estimated values was caused by the specific conditions of the crop rotation simulations because results from the previous crop (period) were used as the initial conditions for the subsequent season, and an error (or uncertainty) within 1 year was propagated to the next crop or crops. This factor is important from the point of view of both the N balance (e.g. due to N uptake, N leaching and the amount of plant residues) and water balance (e.g. due to runoff, evapotranspiration and deep percolation). Some uncertainty could be connected to the annual N deposition through precipitation, which varied significantly from year to year at the selected stations, whereas in the HERMES model, only the average annual total Nmin could be defined. Moreover, the influence of an intercrop (if one occurred) was completely neglected within the HERMES simulations because of the lack of data. Such descriptions were available only in particular cases in the form of remarks within the experiment documentation (e.g. the emergence of spring barley after harvesting in 1990 (from harvest losses) that grew until heading during the term of autumn ploughing at the Lednice station). An intercrop can influence water balance and N uptake, shade the soil surface or fix atmospheric N within certain parts of the season, depending on the crop. For instance, Sapkota et al. (Reference Sapkota, Askegaard, Laegdsmand and Olesen2012) simulated the growth of selected catch crops and their effect on soil mineral N using the FASSET model, and the results were different for the different species involved. Finally, the soil Nmin spatial variability, representativeness of point measurements and analytical errors (Giebel et al. Reference Giebel, Wendroth, Reuter, Kersebaum and Schwarz2006) are not considered in the present results. Selles et al. (Reference Selles, Campbell, McConkey, Brandt and Messer1999) reported high coefficients of variation (33–80%) for the total soil N and N supply power, which were mainly attributed to random processes. Moreover, using an estimate of constant N being available for mineralization (at the same level for all stations), as this parameter was unknown, can reduce some of the differences between locations.
As the soil Nmin contents are sometimes very dynamic, showing high variation, a slight shift in the timing of estimated values can cause significantly poorer statistical results. It is apparent that reasonable water balance estimates are crucial, but some parameters are especially questionable in this regard, such as runoff in the case of locations with slopes. Runoff can be difficult to estimate for certain crops, parts of the season, rain intensities, actual soil moisture or over the winter when the soil is frozen.
In case of Corg at Němčice station, the magnitude of the observed short-term changes is difficult to explain on the temporal dynamics basis and the HERMES model. The oscillation within the observations can probably be attributed to spatial variability, which can occur due to small-scale changes of texture or for topographic reasons (Kersebaum et al. Reference Kersebaum, Lorenz, Reuter, Schwarz, Wegehenkel and Wendroth2005). Model accuracy for plant processes is generally higher than for soil processes, as was also reported, for example, by Mirschel & Wenkel (Reference Mirschel, Wenkel, Kersebaum, Hecker, Mirschel and Wegehenkel2007) for the AGROSIM model and concluded from the model inter-comparison performed by de Willigen (Reference De Willigen1991).
The main conclusion from the present work is that HERMES is an effective tool for modelling crop rotation simulations at a reasonable level of complexity. Some of the main advantages of this model are its restricted data requirements, user-friendly operation and the possibility of easily calibrating or incorporating completely new crops, which predetermine its successful use through various ranges of applications. HERMES produced relatively precise estimates in many of the investigated cases as well as values that differed compared with reality but that could be explained by the uncertainty connected with the data used in the study, which originated from extensive experiments (e.g. without a description of the initial soil moisture, number of productive tillers, weight of seeds or catch crop appearance). Due to the lack of detailed observations regarding phenological development, universal cultivars were used, which could be another source of uncertainty. Thus, there should be a high demand for designing and conducting intensive field experiments adapted for crop model calibration and testing, including observations for above-mentioned parameters, regular leaf area index measurements and the weight of biomass, together with N content observations performed several times per season. In addition, the reasonable results obtained using universal cultivars in the present paper support the application of HERMES for decision-making at a regional level (where some mixture of cultivars will naturally be present) regarding agricultural and environmental policies. As algorithms addressing the effect of atmospheric CO2 concentrations are included in the model, HERMES could be used under expected climatic conditions to assess the magnitude of changes within crop growth and soil processes or the potential of mitigation and adaptation measures.
This study was conducted with the support of project NAZV QI91C054, ‘Atlas of soil climate of the Czech Republic – Determination of soil temperature and moisture regimes and their influence on soil productivity’; project KONTAKT ME10128; project CZ.1.07/2.4.00/31.0056, ‘Partnership in Climate Research and Adaptation Strategies’; and CZ. 1.05/1.1.00/02.0073, ‘CzechGlobe – Centre for Global Climate Change Impacts Studies’. International cooperation was helped by COST ES1106 AGRIWAT.