Introduction
The Adélie penguin (Pygoscelis adeliae) is one of two true Antarctic penguin species uniquely adapted to the cold sea ice environment of the Southern Ocean (Williams Reference Williams1995, Baker et al. Reference Baker, Pereira, Haddrath and Edge2006). Because of the species’ life history affinity for the presence of sea ice, demographic rates of Adélie penguins are considered highly sensitive to ocean–climate warming that impacts the dynamics of sea ice and associated marine food webs (Ainley Reference Ainley2002, Forcada & Trathan Reference Forcada and Trathan2009, Ainley et al. Reference Ainley, Russell, Jenouvrier, Woehler, Lyver, Fraser and Kooyman2010), as well as the quality of penguin terrestrial breeding habitat via increased snow accumulation (Fraser et al. Reference Fraser, Patterson-Fraser, Ribic, Schofield and Ducklow2013). Nowhere in the Southern Ocean is Antarctic penguin demographic response to environmental change more pronounced than throughout the Scotia Sea and marine ecosystem occurring west of the Antarctic Peninsula (WAP; Fig. 1; Forcada & Trathan Reference Forcada and Trathan2009, Trivelpiece et al. Reference Trivelpiece, Hinke, Miller, Reiss, Trivelpiece and Watters2011, Lynch et al. Reference Lynch, Naveen, Trathan and Fagan2012, Ducklow et al. Reference Ducklow, Fraser, Meredith, Stammerjohn, Doney, Martinson, Sailley, Schofield, Steinberg, Venables and Amsler2013). Here, environmental warming has been especially marked and associated with considerable reductions in over-winter sea ice formation (Stammerjohn et al. Reference Stammerjohn, Martinson, Smith and Iannuzzi2008), particularly in comparison with other regions of Antarctica (Stammerjohn et al. Reference Stammerjohn, Massom, Rind and Martinson2012). Breeding colonies of Adélie penguins located near Anvers Island in the northern WAP (Fig. 1b & c) have declined by 80% from historical numbers (Ducklow et al. Reference Ducklow, Fraser, Meredith, Stammerjohn, Doney, Martinson, Sailley, Schofield, Steinberg, Venables and Amsler2013). In addition, widespread colony declines (up to 50%) have been documented among nesting Adélie and chinstrap (P. antarcticus) penguins of the WAP and the South Shetland Islands over approximately the last 30 years (Trivelpiece et al. Reference Trivelpiece, Hinke, Miller, Reiss, Trivelpiece and Watters2011, Lynch et al. Reference Lynch, Naveen, Trathan and Fagan2012).
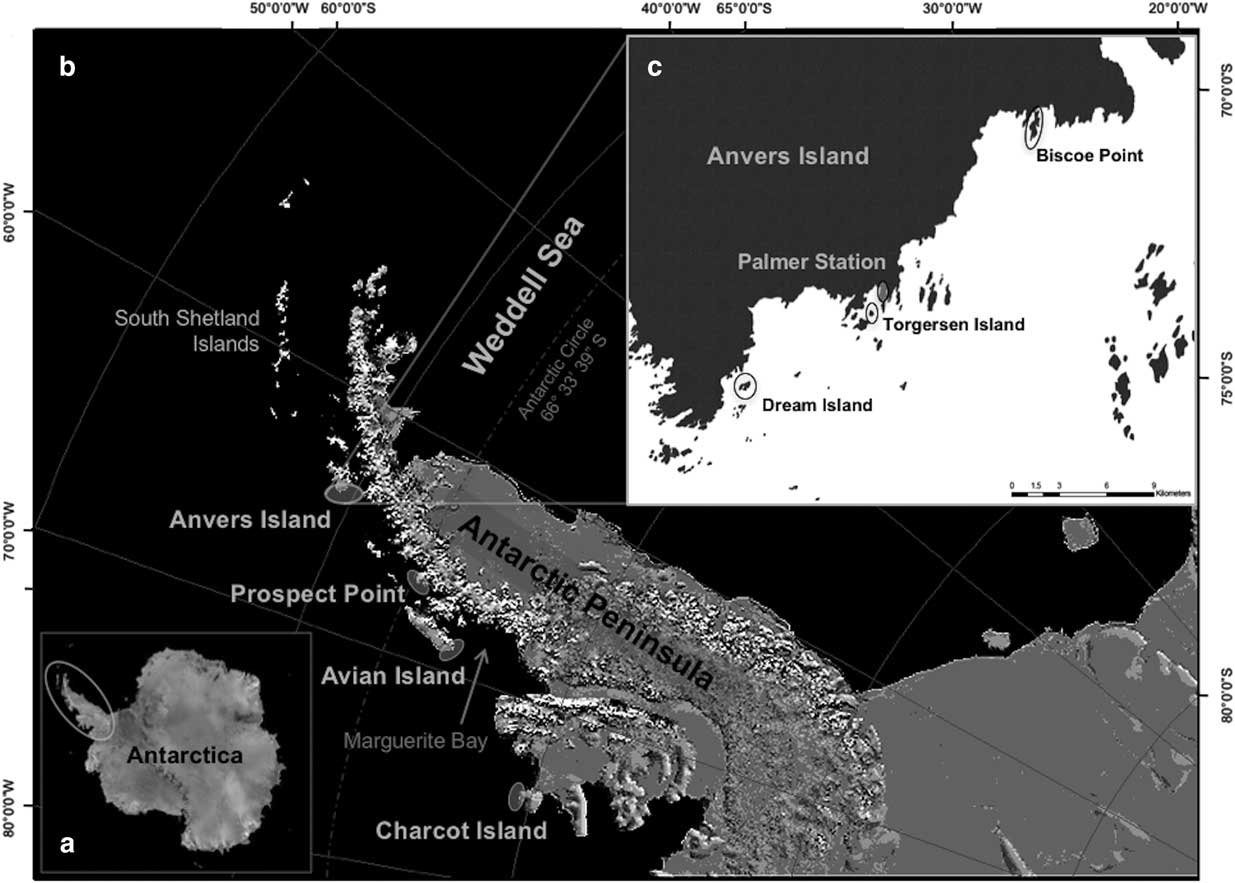
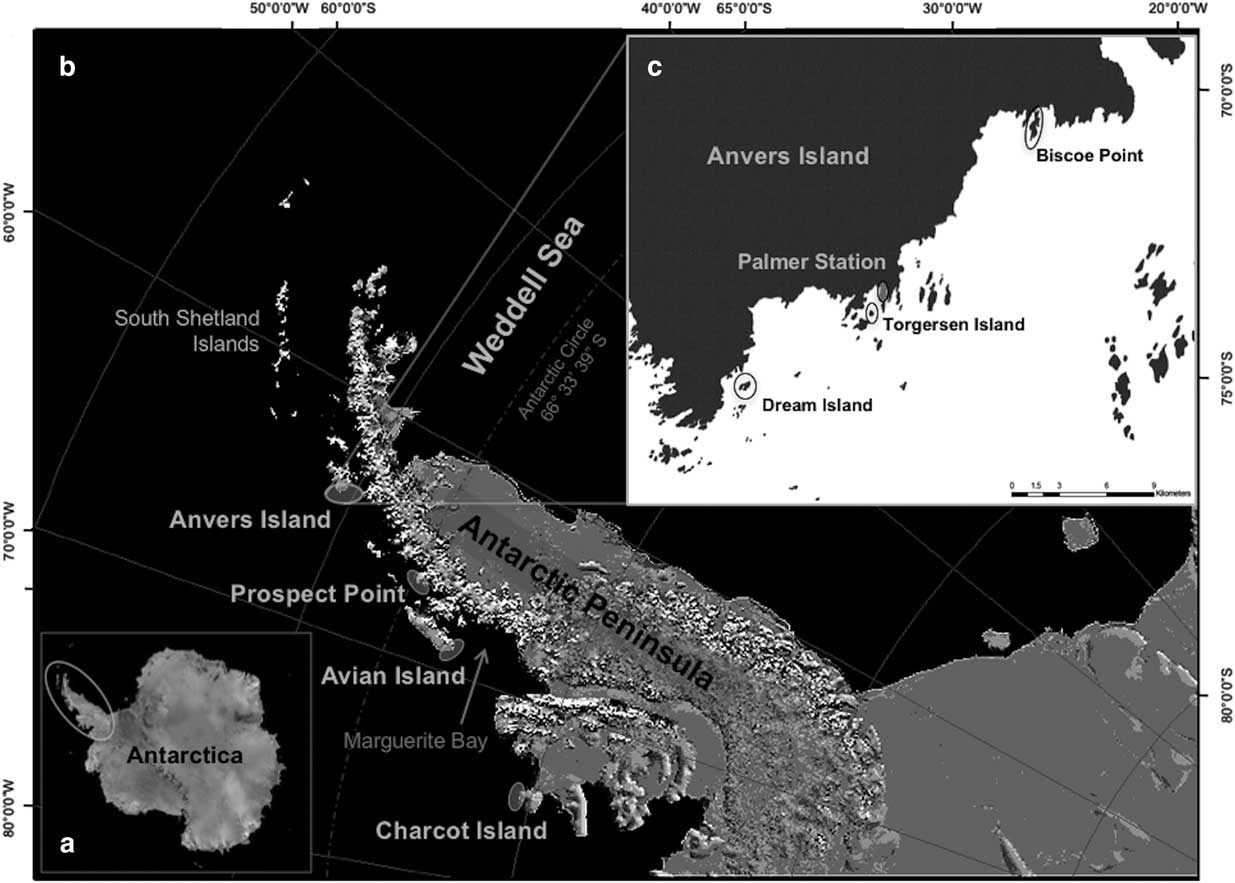
The marine ecosystem west of the Antarctic Peninsula extends from northern Alexander Island (approximately Charcot Island) to the South Shetland Islands. b. Fieldwork for the present study was conducted at major Adélie penguin colonies within the Palmer Archipelago near Anvers Island and Palmer Station, as well as at Prospect Point, Avian Island and Charcot Island. c. Northern penguin colonies were located at Dream Island, Torgersen Island and Biscoe Point. Images were generated from base maps provided by the National Snow and Ice Data Center’s map server A-CAP (http://nsidc.org/agdc/acap/).
Declines in the number of adult penguins at breeding colonies throughout the northern WAP have historically been interpreted as a consequence of climate-driven changes in sea ice-associated food webs having adverse energetic effects on fledglings that decrease their survival and recruitment probability as breeding adults (Fraser et al. Reference Fraser, Trivelpiece, Ainley and Trivelpiece1992, Hinke et al. Reference Hinke, Salwicka, Trivelpiece, Watters and Trivelpiece2007, Chapman et al. Reference Chapman, Hofmann, Patterson, Ribic and Fraser2011, Trivelpiece et al. Reference Trivelpiece, Hinke, Miller, Reiss, Trivelpiece and Watters2011). That is, Antarctic penguins, like other seabirds, have long been considered strongly philopatric to natal rearing colonies (Ainley et al. Reference Ainley, LeReseche and Sladen1983, Ainley Reference Ainley2002, Friesen et al. Reference Friesen, Burg and McCoy2007); changes in the size of breeding colonies have been attributed to alterations in survival and therefore recruitment, as opposed to emigration to new breeding areas with more favourable habitat conditions. Since philopatry reduces the likelihood that an individual disperses to a new breeding area, the behaviour can create fine-scale patterns of spatial genetic structure across populations, in contrast to dispersal behaviour that generally acts as a homogenizing force on genetic variability (Avise Reference Avise2000). In this context, breeding Adélie penguins would be expected to show significant genetic structuring. However, of the few genetic studies that have examined this question for the species, using either bi-parentally inherited nuclear or maternally inherited mitochondrial DNA (mtDNA) markers, a lack of genetic differentiation has generally been observed at both the continental (Roeder et al. Reference Roeder, Marshall, Mitchelson, Visagathilagar, Ritchie, Love, Pakai, McPartlan, Murray, Robinson, Kerry and Lambert2001, Ritchie et al. Reference Ritchie, Millar, Gibb, Baroni and Lambert2004) and regional (i.e. southern Scotia Arc/northern WAP; Clucas et al. Reference Clucas, Dunn, Dyke, Emslie, Levy, Naveen, Polito, Pybus, Rogers and Hart2014) scales, suggestive of considerable dispersal capacity and gene flow among Adélie penguin breeding colonies. In support, demographic studies by Dugger et al. (Reference Dugger, Ainley, Lyver, Barton and Ballard2010, Reference Dugger, Ballard, Ainley, Lyver and Schine2014) based on mark-recapture techniques, as well as a comparison of ancient and modern genetic markers by Shepherd et al. (Reference Shepherd, Millar, Ballard, Ainley, Wilson, Haynes, Baroni and Lambert2005), indicate that breeding Adélie penguins of Victoria Land can disperse to different areas, particularly during extreme environmental conditions. Thus, more recent demographic and genetic evidence supports the idea that Adélie penguins are not strictly philopatric, but may disperse to regions with more suitable conditions in response to environmental change.
We studied the population genetics of Adélie penguins breeding throughout four major colonies of the WAP to understand historical genetic structuring and gene flow given relatively recent and ongoing reductions in sea ice habitats associated with changes in breeding colony trends in this region of the Southern Ocean. Our work aims to evaluate the Adélie penguin’s vulnerability to current and future environmental change, particularly the species’ adaptive capacity to deal with environmental perturbations in terms of genetic diversity and dispersal capacity (e.g. Foden et al. Reference Foden, Butchart, Stuart, Vié, Akçakaya, Angulo, DeVantier, Gutsche, Turak, Cao, Donner, Katariya, Bernard, Holland, Hughes, O’Hanlon, Garnett, Şekercioğlu and Mace2013). Given the conclusions of recent genetic and demographic studies (Roeder et al. Reference Roeder, Marshall, Mitchelson, Visagathilagar, Ritchie, Love, Pakai, McPartlan, Murray, Robinson, Kerry and Lambert2001, Ritchie et al. Reference Ritchie, Millar, Gibb, Baroni and Lambert2004, Shepherd et al. Reference Shepherd, Millar, Ballard, Ainley, Wilson, Haynes, Baroni and Lambert2005, Dugger et al. Reference Dugger, Ainley, Lyver, Barton and Ballard2010, Reference Dugger, Ballard, Ainley, Lyver and Schine2014, Clucas et al. Reference Clucas, Dunn, Dyke, Emslie, Levy, Naveen, Polito, Pybus, Rogers and Hart2014), we test the general hypothesis that Adélie penguins of the WAP are a genetically unstructured population and therefore show connectivity via gene flow. A series of population genetic analyses were applied, based on both nuclear and mtDNA markers, to develop estimates of genetic diversity, spatial genetic structure and gene flow at the regional scale among Adélie penguins breeding throughout the WAP, and genetic signatures were tested for recent and historical fluctuations in population demography. Study colonies encompass 800 km along the WAP (Fig. 1b & c), which captures an extreme latitudinal gradient in annual sea ice coverage (see Ducklow et al. Reference Ducklow, Fraser, Meredith, Stammerjohn, Doney, Martinson, Sailley, Schofield, Steinberg, Venables and Amsler2013 fig. 2) and change in numbers of breeding adults at colonies. Along the Palmer Archipelago near Anvers Island (Fig. 1b & c), Adélie penguins occur at the northern extent of their breeding range along the WAP (Fraser et al. Reference Fraser, Trivelpiece, Ainley and Trivelpiece1992), which is contracting given extensive declines (see Ducklow et al. Reference Ducklow, Fraser, Meredith, Stammerjohn, Doney, Martinson, Sailley, Schofield, Steinberg, Venables and Amsler2013 fig. 7) and reflects trends for the species throughout other colonies of the region (Trivelpiece et al. Reference Trivelpiece, Hinke, Miller, Reiss, Trivelpiece and Watters2011, Lynch et al. Reference Lynch, Naveen, Trathan and Fagan2012). Similarly, Adélie penguins nesting at Prospect Point (Fig. 1b) have also declined (Fraser, unpublished data). Colony declines at these two study sites have occurred in association with significant, long-term reductions in annual sea ice coverage within the northern seasonal sea ice zone along the WAP (Stammerjohn et al. Reference Stammerjohn, Martinson, Smith and Iannuzzi2008, Ducklow et al. Reference Ducklow, Fraser, Meredith, Stammerjohn, Doney, Martinson, Sailley, Schofield, Steinberg, Venables and Amsler2013). However, Adélie penguin breeding colonies at Avian and Charcot islands, within the species core to more southern distribution along the WAP, have increased (Sailley et al. Reference Sailley, Ducklow, Moeller, Fraser, Schofield, Steinberg, Garzio and Doney2013) or appear stable based on currently available census data (Henderson Reference Henderson1976, Fraser unpublished data), respectively. At these southern breeding sites, over-winter sea ice coverage remains a prominent physical oceanographic feature, particularly at Charcot Island (Ducklow et al. Reference Ducklow, Fraser, Meredith, Stammerjohn, Doney, Martinson, Sailley, Schofield, Steinberg, Venables and Amsler2013). This study adds to the current literature by assessing population genetic structure among breeding colonies that are located in regions along the WAP with extremely divergent sea ice dynamics unlike research by Clucas et al. (Reference Clucas, Dunn, Dyke, Emslie, Levy, Naveen, Polito, Pybus, Rogers and Hart2014) that sampled Adélie penguins primarily across the seasonal sea ice zone from Marguerite Bay north to the South Sandwich Islands (Fig. 1a & b). Additionally, no study to date has concurrently evaluated both nuclear and mtDNA markers of Adélie penguins to assess sex-biased patterns of dispersal given the differing modes of inheritance for these genetic markers. Finally, to our knowledge, the current report is a first effort to explicitly model Antarctic penguin gene flow using maximum likelihood methods.
Materials and methods
Field sampling
Adélie penguins nesting on several islands within the Palmer Archipelago west of the Antarctic Peninsula near Anvers Island (64°46′S, 64°03′W; Fig. 1) were studied during the summers of 2008/09 and 2009/10. Specifically, study nests were located on Biscoe Point (64°48′S, 63°46′W), Torgersen Island (64°46′S, 64°04′W) and Dream Island (64°43′S, 64°13′W) (Fig. 1c). Each study season, Adélie penguin study nests (n=30) were distributed equally between the three study islands, with ten nests located on each island. Each season, study nests, where pairs of adults were present, were individually marked and chosen before the onset of egg laying and monitored consistently. When study nests were found at the one-egg stage, both adults were captured to obtain blood samples used for genetic analysis. At the time of capture, each adult penguin was quickly blood sampled (~1 ml) from the brachial vein using a sterile 3 ml syringe and non-heparinized infusion needle. After handling, individuals at study nests were further monitored to ensure the pair reached clutch completion, i.e. two eggs. Final sample sizes of adults used in analyses (n=100) differ from the number of original study nests reported here as at times weather conditions hindered colony access resulting in some adults reaching clutch completion before sampling; therefore, these study nests were not sampled and were excluded from subsequent monitoring.
During annual oceanographic research cruises (January 2009–2011) aboard the ARSV Laurence M. Gould, as part of the Palmer Station, Antarctica, Long-Term Ecological Research programme (PAL-LTER), blood was sampled from five-week-old crèched Adélie penguin chicks for population genetic analysis from colonies at Prospect Point (n=15 in January 2011), Avian Island (n=46 between January 2009 and 2010) and Charcot Island (n=25 between January 2010 and 2011) (Fig. 1b). Blood samples from crèched chicks (~1 ml) were taken from the brachial vein using a sterile 3 ml syringe and non-heparinized infusion needle following sampling procedures used for adult penguins. All collected blood was stored in 1.5 ml microcentrifuge tubes containing 1 ml of blood preservation buffer (Longmire et al. Reference Longmire, Lewis, Brown, Buckingham, Clark, Jones, Meincke, Meyne, Ratliff, Ray, Wagner and Moyzis1988). Within 12 hours of field collection, tubes containing whole blood in buffer were stored at -80°C.
Laboratory genotyping and sequencing
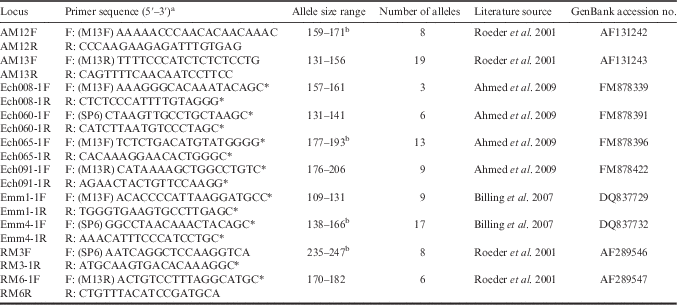
Blood samples in preservation buffer were extracted according to Medrano et al. (Reference Medrano, Aasen and Sharrow1990) using modifications reported in Sonsthagen et al. (Reference Sonsthagen, Talbot and White2004). Sex of all sampled individuals was determined genetically using methods outlined by Gorman et al. (Reference Gorman, Williams and Fraser2014). Genotype data from a total of 186 individuals were collected for ten polymorphic microsatellite loci using primers selected from the published literature (AM12, AM13, RM3, RM6 after Roeder et al. Reference Roeder, Marshall, Mitchelson, Visagathilagar, Ritchie, Love, Pakai, McPartlan, Murray, Robinson, Kerry and Lambert2001, Emm1, Emm4 after Billing et al. Reference Billing, Guay, Peucker and Mulder2007, and Ech008, Ech060, Ech065, Ech091 after Ahmed et al. Reference Ahmed, Hart, Dawson, Horsburgh, Trathan and Rogers2009). Primer sequences are identified in Table I, including those redesigned for this study. Polymerase chain reaction (PCR) amplification of microsatellite loci followed multiplex procedures similar to those described by Cronin et al. (Reference Cronin, Amstrup, Talbot, Sage and Amstrup2009). To obtain size standards for each locus, six individuals heterozygous at each locus were selected and scored against a fluorescently labelled M13 sequence ladder of known size. Individuals representing each locus were compared to an M13 sequence ladder of known size, and these samples were used in each subsequent gel as size standards, occupying at least six lanes across each gel. Based on these standards, genotypes for each individual were determined using GeneImagIR 4.05 software (Scanalytics). For quality control purposes, DNA from a minimum of 10% of the individuals representing each designated subpopulation was re-extracted, amplified and sequenced or genotyped again. Level of error due to allelic dropout, null alleles or scoring error was assessed for microsatellite loci using MICROCHECKER (van Oosterhout et al. Reference van Oosterhout, Hutchinson, Wills and Shipley2004).
Microsatellite loci used to assess population genetic structure of Adélie penguins breeding west of the Antarctic Peninsula. Primer sequence (universal tail in parentheses), allele size range in base pairs, number of alleles, literature source for primers and GenBank accession numbers are reported. Loci that were redesigned for this study are denoted with an asterisk.
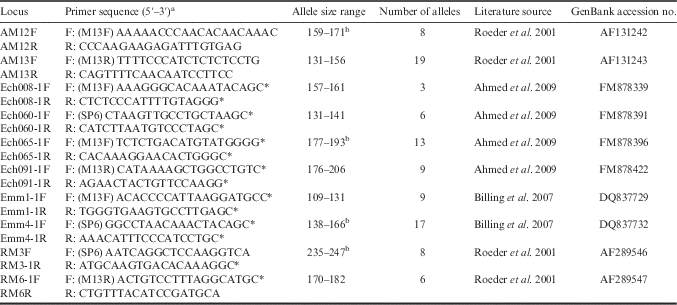
a Universal tail primer sequences: M13F (CACGACGTTGTAAAACGAC), M13R (GGATAACAATTTCACACAGG) and SP6 (GATTTAGGTGACACTATAG).
b Signifies the presence of one base pair repeat.
A fragment of approximately 467 nucleotide-pairs (nt) comprising a portion of domain I of the penguin mtDNA control region was amplified using the primers CR122 (5’-CAAGTACATTTAATGTACG-3’) and CR576 (5’-GAATGGTTGAATGTTGGGC-3’). the PCR products were purified using Exo-SAP-IT PCR Product Cleanup (Affymetrics, Cleveland, OH, USA). Purified products were cycle-sequenced via simultaneous bidirectional sequencing using a commercial kit (Sequitherm LCII 2.0, Epicentre Technologies, Madison, WI, USA) following protocols described in Sonsthagen et al. (Reference Sonsthagen, Talbot and White2004). Comparison of sequences with homologous sequences archived in GenBank (Ritchie et al. Reference Ritchie, Millar, Gibb, Baroni and Lambert2004) verified that the sequences generated were probably mitochondrial in origin, rather than from a nuclear pseudogene (Sorenson & Fleischer Reference Sorenson and Fleischer1996). For quality control purposes, DNA from two to five individuals representing each sampling colony were extracted, amplified and sequenced in duplicate. The mtDNA sequences were analysed using eSeq v2.0 (LI-COR, Lincoln, NE, USA) imaging software and aligned using AlignIR v2.0. Sequence data were archived in GenBank (Table S1 found at http://dx.doi.org/10.1017/S0954102017000293).
Estimation of genetic diversity
The number of alleles and private alleles were calculated using the Microsatellite Toolkit (Park Reference Park2001). Allelic richness and inbreeding coefficient (F IS ) were calculated using FSTAT version 2.9.3 (Goudet Reference Goudet1995). Observed and expected heterozygosity were calculated and deviations from Hardy–Weinberg equilibrium (HWE) and linkage disequilibrium were tested for each microsatellite locus in GENEPOP 3.1 (Raymond & Rousset Reference Raymond and Rousset1995). Estimates of average relatedness (rxy) were calculated using IDENTIX (Belkhir et al. Reference Belkhir, Castric and Bonhomme2002).
The mtDNA control region haplotypes were assigned based on at least a single nucleotide substitution (no insertions or deletions were observed) found within the segment sequenced. ARLEQUIN 3.11 (Excoffier et al. Reference Excoffier, Laval and Schneider2005) was used to estimate haplotype (h) and nucleotide (π) diversity. The hypothesis of selective neutrality was tested for mtDNA control region sequence data and for historical fluctuations in population demography using Fu’s F S (Fu Reference Fu1997) and Tajima’s D (Tajima Reference Tajima1989), implemented in ARLEQUIN. We applied critical significance values of 5%, which requires a P value of <0.02 for Fu’s F S (Fu Reference Fu1997). Relationships among haplotypes were reconstructed using the Network program (fluxus-engineering.com, Bandelt et al. Reference Bandelt, Forster and Rohl1999). To place the individuals assayed from each of the four sampling colonies (i.e. Prospect Point and Anvers, Avian and Charcot islands) within a larger context, a minimum evolution (ME) phylogenetic tree was also generated to show relationships based on our data relative to 105 haplotypes reported by Ritchie et al. (Reference Ritchie, Millar, Gibb, Baroni and Lambert2004) retrieved from GenBank. The ME tree was generated using MEGA (Tamura et al. Reference Tamura, Stecher, Peterson, Filipski and Kumar2013), under the Kimura two the parameter distance model (Kimura Reference Kimura1980).
Estimation of spatial genetic structure
Spatial variance in allelic and haplotypic frequencies, overall and between populations, was calculated (F ST , R ST and Φ ST , respectively) using ARLEQUIN. The Φ ST values were calculated using the Kimura two parameter model provided in ARLEQUIN. Because samples sizes varied between populations (Goudet et al. Reference Goudet, Raymond, de Meeus and Rousset1996), population differentiation based on chi-squared (χ 2 ) distributions of alleles and haplotypes was also determined using GENEPOP, applying the Bonferroni correction (α=0.05) for microsatellite data.
The Bayesian clustering program (STRUCTURE 2.3.3) was used to assign breeding individuals to clusters based on their microsatellite allelic frequencies to infer the occurrence of population structure (Hubisz et al. Reference Hubisz, Falush, Stephens and Pritchard2009). Data were analysed using an admixture model assuming correlated frequencies and assisted by sample group information with the number of possible populations (K) ranging from one to five (search strategy: 50000 burn-in period, 500000 Markov chain Monte Carlo iterations); the analysis was repeated five times.
Estimation of population demography
Genetic evidence for fluctuations in recent population demography was evaluated for all microsatellite loci using BOTTLENECK 1.2.02 (Cornuet & Luikart Reference Cornuet and Luikart1996). BOTTLENECK analyses were conducted under the infinite allele model (IAM; Maruyama & Fuerst Reference Maruyama and Fuerst1985), stepwise mutation model (SMM; Ohta & Kimura Reference Ohta and Kimura1973) and a two-phase model of mutation (TPM; DiRienzo et al. Reference DiRienzo, Peterson, Garza, Valdes, Slatkin and Freimer1994). Parameters for the TPM were set at 80% SMM with a variance of 9% (Piry et al. Reference Piry, Luikart and Cornuet1999); 1000 simulations were performed for each population. Significance was assessed using a Wilcoxon sign-rank test, which determines if the average of standardized differences between observed and expected heterozygosities are significantly different from zero (Cornuet & Luikart Reference Cornuet and Luikart1996). Significant heterozygosity deficiency values relative to the number of alleles indicate recent population growth, whereas heterozygosity excess relative to the number of alleles indicates a recent population bottleneck (Cornuet & Luikart Reference Cornuet and Luikart1996). BOTTLENECK compares heterozygosity deficiency and excess relative to genetic diversity, not to HWE expectation (Cornuet & Luikart Reference Cornuet and Luikart1996). For Anvers Island Adélie penguins, BOTTLENECK analyses were performed using only the seven loci that conformed to HWE (AM12, AM13, Ech008, Ech065, Ech091, Emm4 and RM6). In addition, a BOTTLENECK analysis was conducted using pooled data from all colonies to increase statistical power, but excluded the RM3 locus because it did not conform to HWE when data were pooled.
Evidence for fluctuations in recent and historical population demography was additionally evaluated using FLUCTUATE (Kuhner et al. Reference Kuhner, Yamato and Felsenstein1998). FLUCTUATE estimates a population growth parameter, g, incorporating coalescence theory (parameters: ten short chains with sampling increments of ten with 1000 steps per chain, ten long chains with sampling increments of ten with 20000 steps per chain, a random starting tree, and a starting value of g set to one). Data were analysed in five runs and parameters converged across runs. Positive values of g suggest population growth over time and negative values suggest population decline. As this method incorporates aspects of genealogy, it is sensitive to changes in demography and thus may be upwardly biased (Kuhner et al. Reference Kuhner, Yamato and Felsenstein1998). As a result, and because standard deviations (SD) are only approximate, we used g to indicate population growth if g>3 SD (g).
We tested for historical fluctuations in population demography using Fu’s F S (Fu Reference Fu1997) and Tajima’s D (Tajima Reference Tajima1989) described above. Mismatch distributions (Rogers & Harpending Reference Rogers and Harpending1992) were generated using ARLEQUIN to test whether individuals in each breeding colony deviated from the sudden expansion model.
Estimation of gene flow
Estimates of gene flow between Anvers Island and Avian Island breeding colonies were calculated in MIGRATE version 3.0.3 (Beerli & Felsenstein Reference Beerli and Felsenstein2001) as Avian Island is the largest breeding colony of Adélie penguins along the WAP (Poncet & Poncet Reference Poncet and Poncet1987) and is therefore considered a possible source for other regional colonies. MIGRATE uses a coalescent model of population differentiation that incorporates two parameters scaled to the mutation rate (μ): θ, the effective population size parameter (4N e μ), and M, the rate of gene flow (m/μ). MIGRATE gene flow estimates are averaged over the past n generations, where n equals the number of generations the populations have been at mutation-drift equilibrium.
MIGRATE analyses were conducted with microsatellite data and included a full migration model for which θ and M were estimated individually from the data. The full migration model was compared to a restricted model (θ was averaged and M was symmetrical between the two colonies) to test for asymmetry in gene flow between colonies. Gene flow was estimated using maximum likelihood search parameters, ten short chains (2500 used trees out of 500 000 sampled), five long chains (10 000 used trees out 2000000 sampled) and five static chains (temperatures: 1, 1.5, 3, 6 and 12; swapping interval=1). Models were run five times and parameters converged. The alternative model for goodness-of-fit was evaluated given the data using a log-likelihood ratio test (Beerli & Felsenstein Reference Beerli and Felsenstein2001).
Results
Genetic diversity
Unique genotypes were observed for all individuals in the study (n=186) based on data collected from ten polymorphic microsatellite loci. Average number of alleles and allelic richness per microsatellite locus ranged from 3 to 19 with an average of 9.80 alleles per locus, and 2.08 to 10.77 with an average of 5.38 per locus, respectively. For each breeding population, average number of alleles and allelic richness ranged from 49 to 90 and 4.90 to 5.52, respectively (Table II). Alleles only observed within a single population (i.e. private alleles) occurred within each breeding population and ranged from 1 to 16, with the Anvers Island breeding population holding the greatest number (Table II). Observed heterozygosity for each breeding population ranged from 56% to 63% with an average of 60% for all populations. Average relatedness ranged from -0.011 to -0.064 (Table II).
Estimates of genetic diversity of Adélie penguins breeding west of the Antarctic Peninsula. Number of alleles per breeding population (A), private alleles (PA), average allelic richness (AR), inbreeding coefficient (F IS ), observed and expected heterozygosities (H O and H E ), average relatedness (rxy) and its variance were calculated using ten microsatellite loci. Number of haplotypes (K), haplotype (h) and nucleotide (π) diversity, Fu’s F S and Tajima’s D values estimated from mitochondrial DNA (mtDNA) control region locus. Values in bold text are significant at α=0.05.

There was no evidence of deviations from HWE or linkage equilibrium (χ 2 =1.29–15.66, P>0.013) with one exception: Anvers Island deviated overall from HWE expectations (χ 2 =45.67, df=20, P (α: 0.005) =0.001) as a result of significant nonconformities at three loci (Ech060: P (α: 0.0125) =0.011, Emm1: P (α: 0.0125) =0.012 and RM3: P (α: 0.0125) =0.003). Among these loci, potential null alleles were identified by MICROCHECKER (Ech060, P (α: 0.05) <0.01). Inbreeding coefficient (F IS ) ranged from -0.029 to 0.067 (Table II) and was not significantly different from zero overall (F IS =0.015, 95% confidence intervals [CI]=-0.009, 0.040).
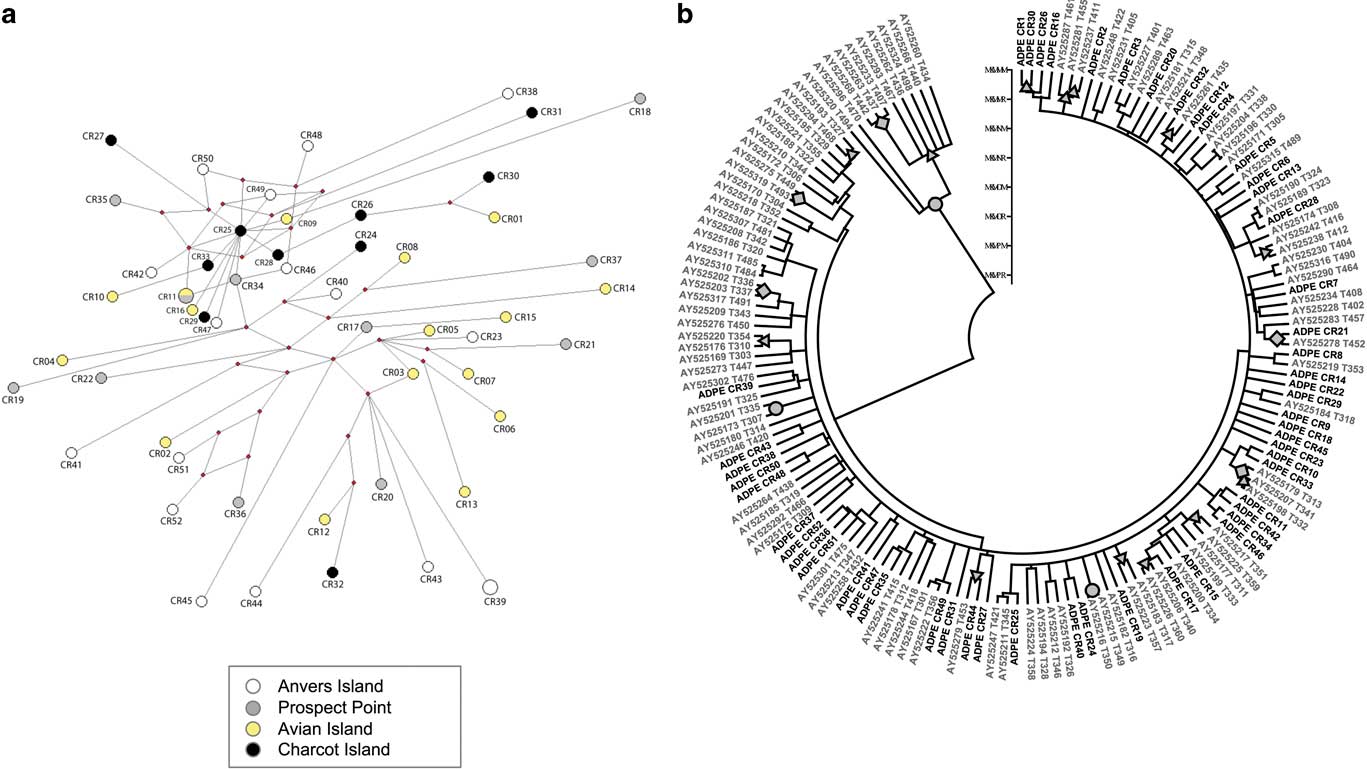
From 54 penguins sampled across the four study colonies, 52 mtDNA control region haplotypes were consistently retrieved and characterized by 79 polymorphic sites (all transitions) across a total of 415 nt (Anvers Island n=17, Prospect Point n=11, Avian Island n=16 and Charcot Island n=10). No mtDNA haplotypes were shared among locales, with one exception: haplotype 11 was shared between Prospect Point and Avian Island (Fig. 2a). Haplotype diversity (h) was very high, ranging from 0.99 (Anvers) to 1.00 (Prospect Point, Avian Island and Charcot Island), and nucleotide diversity (π) ranged from 0.016 to 0.021 (Table II). Fu’s F S and Tajima’s D were not significantly positive (Table II), suggesting the portion of the mitochondrial control region assayed did not deviate from neutrality.
Network and b. minimum evolution (ME) phylogenetic trees showing relationships among 52 mitochondrial DNA control region haplotypes (ADPE CR01-52) assayed from 54 Adélie penguins from among four major breeding colonies located west of the Antarctic Peninsula (see Fig. 1). The ME tree includes 105 haplotypes reported in Ritchie et al. (Reference Ritchie, Millar, Gibb, Baroni and Lambert2004) retrieved from GenBank for comparison. All haplotypes assayed were found to belong to the Antarctic clade A following Ritchie et al. (Reference Ritchie, Millar, Gibb, Baroni and Lambert2004). Filled circles indicate nodes with >90% bootstrap support, diamonds at nodes indicate 70–90% bootstrap support and triangles at nodes indicate 50–69% bootstrap support.
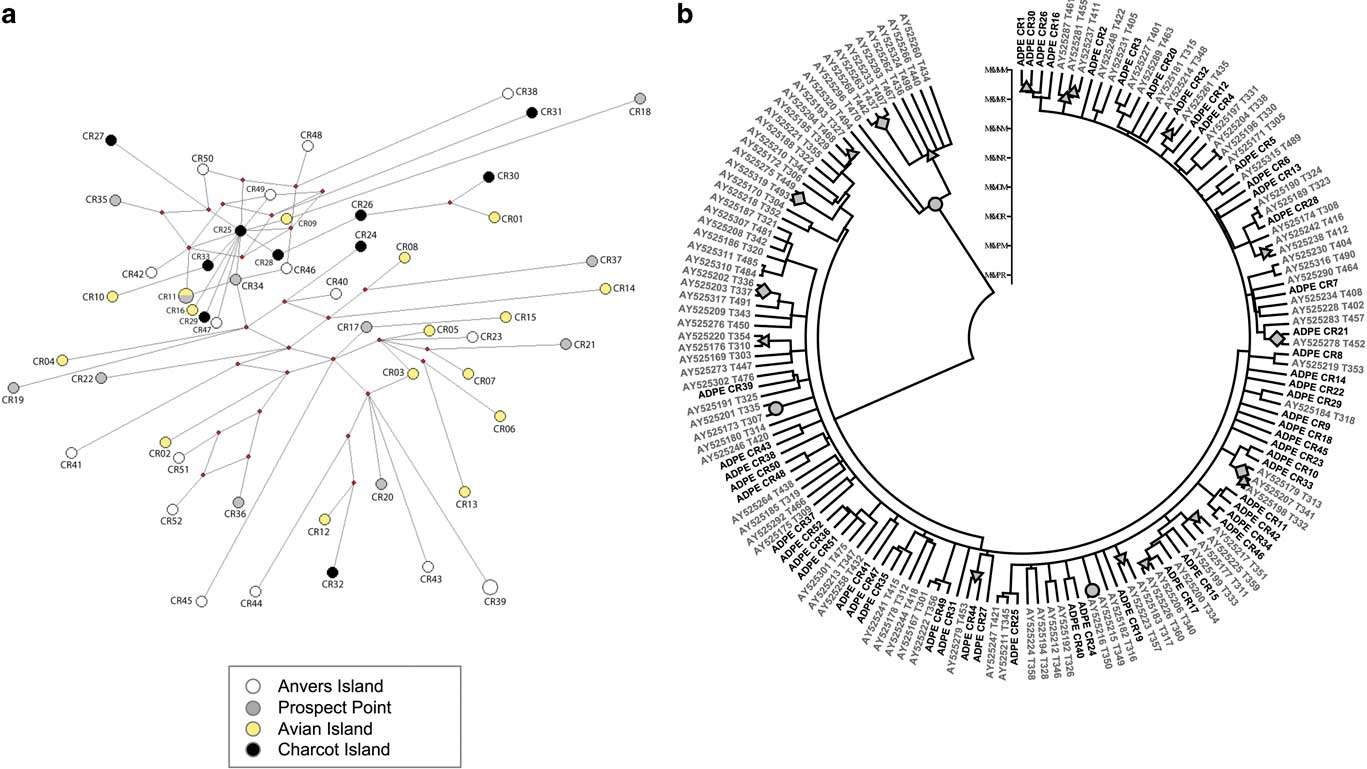
Phylogenetic analyses of our 52 haplotypes and sequences archived in GenBank (Fig. 2b) demonstrated that all haplotypes assayed from all four regional colonies belonged to the Antarctic lineage (A), one of the two monophyletic lineages of Adélie penguins observed in Antarctica.
Spatial genetic structure
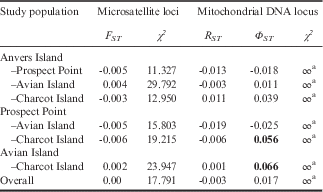
Spatial genetic structure based on overall (F ST =0.000, 95% CI=-0.003, 0.004) and population pairwise F ST values were not observed for microsatellite markers (Table III). Our analyses of microsatellite data in STRUCTURE further confirmed a lack of breeding population differentiation based on microsatellite loci as the likelihood was maximized when K=1 (LnP=-5034.7; population prior incorporated) and sample group information was not informative (r>8.5). Similarly, we observed no significant variance in mitochondrial haplotype frequency overall; only 1.67% of the variance was partitioned among populations (Φ ST =0.017, P=0.112). However, some population pairwise Φ ST values, which ranged from -0.018 to 0.066, were significant: Prospect Point was significantly differentiated from Charcot Island, and Avian Island was significantly differentiated from Charcot Island (Table III). For microsatellites, χ 2 ranged from 11.327 to 29.792 and were non-significant (Table III); while those for mtDNA all equalled infinity and were significant (∞, Table III).
Pairwise and overall estimates of population differentiation among Adélie penguins breeding west of the Antarctic Peninsula based on F ST and R ST calculated from ten microsatellite loci. Mitochondrial control region haplotypes were used to calculate Φ ST values. Results of chi-square analysis of the distribution of alleles and haplotypes also are given. Bold values are significant at α=0.05, Bonferroni corrections were applied for microsatellite data.
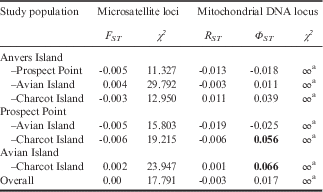
a α<0.000001, df=2.
Population demography
Genetic evidence for recent fluctuations in population demography was not detected for Prospect Point, Avian Island or Charcot Island colonies based on the IAM, SMM and TPM for all ten microsatellite loci (P (α:0.005) =0.065–0.980). For Anvers Island, the three loci previously identified as deviating from HWE for this population were removed from analyses and again did not detect any evidence for changes in population demography (P (α:0.007) =0.340–0.990). However, when the analysis was conducted by pooling data from all colonies and using the nine loci that conformed to HWE (excluding RM3), there was evidence for a population expansion under the SMM (one-tailed test for heterozygosity deficiency, P (α:0.005) =0.005). There is thus some evidence for recent (within the last several to hundreds of generations) fluctuations in population demography, but only across all study colonies of the WAP not within any colony. Similarly, analyses using FLUCTUATE uncovered a signal of population growth (g) in all populations (g ANVERS =519.87, SD=86.73; g PROSPECTPOINT =635.18, SD=54.32; g AVIAN =899.023, SD=20.30; g CHARCOT =969.96, SD=86.68). Mismatch distributions for mitochondrial DNA failed to deviate from the signal of sudden population expansion (mean sum of square deviations=0.011, SD=0.003, P=0.209) and were not significantly ragged (mean raggedness index=0.028, SD=0.006, P=0.563), and neutrality tests (Fu’s F S and Tajima’s D; Table II) were significantly negative, consistent with a more historical signal of population expansion.
Gene flow
Asymmetry in gene flow estimates was observed based on results from the two-population model, where number of immigrants (N e m) to the Anvers Island colony (8.9, 95% CI=7.8, 10.2) was significantly greater than the N e m from this population into Avian Island (6.2, 95% CI=5.4, 7.1). The full model (all parameters allowed to vary independently) had significantly higher likelihoods than the restricted model (symmetric interpopulation gene flow rates and θ) further indicating asymmetric gene flow (microsatellites LnL(full)=-1404, LnL(test)=-1551, P<0.001). MIGRATE analyses are coalescent-based and N e m values reflect the average number of migrants per generation across hundreds of generations.
Discussion
Our analyses contribute to a growing interest in understanding better the regional breeding population genetic structure of Pygoscelis penguins given ongoing climate-driven alterations in regional sea ice dynamics associated with breeding population changes among Antarctic penguins of the Scotia Sea and WAP (e.g. Clucas et al. Reference Clucas, Dunn, Dyke, Emslie, Levy, Naveen, Polito, Pybus, Rogers and Hart2014). Central to these current ecological issues, and especially to predicting the response of penguins to future environmental change, is discerning population units that reflect meaningful genetic and/or demographic independence. Demographic studies of Antarctic penguins have been conducted based on banded individuals to assess apparent survival, breeding success and movement (e.g. Dugger et al. Reference Dugger, Ainley, Lyver, Barton and Ballard2010, Reference Dugger, Ballard, Ainley, Lyver and Schine2014, Trivelpiece et al. Reference Trivelpiece, Hinke, Miller, Reiss, Trivelpiece and Watters2011). However, researchers have noted significant survival differences in banded versus un-banded penguins, particularly so within certain years (Gauthier-Clerc et al. Reference Gauthier-Clerc, Gendner, Ribic, Fraser, Woehler, Descamps, Gilly, Le Bohec and Le Maho2004, Dugger et al. Reference Dugger, Ballard, Ainley and Barton2006), which has raised questions regarding the ethics and biases introduced by these techniques. In some cases where breeding colonies are in severe decline, researchers have entirely forfeited penguin-banding efforts given the apparent negative consequences (Fraser, personal communication 2017). Furthermore, banding studies are difficult to conduct over the large spatial scales typically needed to assess parameters relevant to the demographic structure of highly mobile wildlife such as penguins, especially in remote regions such as Antarctica. Given the limitations of traditional demographic studies, population structure was assessed from a molecular evolutionary perspective. Although there is considerable debate regarding the criteria used for defining population and subpopulation units important to conservation (Moritz Reference Moritz1994), genetic distinctiveness is widely appreciated as a critical component of population delineation as nuclear and mtDNA signatures ultimately reflect variation in the demographic processes of reproduction, survival and dispersal at various temporal scales related to coalescence as a function of effective population size (Zink & Barrowclough Reference Zink and Barrowclough2008). We recognize that molecular approaches to understanding population delineation also have limitations, primarily because contemporary demographic independence cannot necessarily be inferred from population genetic data as a consequence of the different spatial and temporal scales captured by genetic versus demographic studies (e.g. Esler et al. Reference Esler, Iverson and Rizzolo2006). However, we feel our study is important for understanding historical demographic processes that have shaped breeding population genetic structure at the regional scale, which may allow us to more accurately predict future Adélie penguin demographic responses to environmental change.
Genetic diversity at nuclear loci (H O =56–63%) was similar to many avian taxa considered at lower extinction risk (Evans & Sheldon Reference Evans and Sheldon2008). High mtDNA diversity (h=0.99–1.00, π=0.016–0.021) was observed, which corroborates recent findings by Clucas et al. (Reference Clucas, Dunn, Dyke, Emslie, Levy, Naveen, Polito, Pybus, Rogers and Hart2014). Our estimates of higher genetic diversity across all breeding colonies accord with some evidence for a population expansion as indicated by our data; had we detected any notable population bottleneck among our study colonies, we would have expected to observe reduced diversity indices. The high genetic diversity observed across sampling colonies is consistent with Ritchie et al. (Reference Ritchie, Millar, Gibb, Baroni and Lambert2004), who analysed mtDNA control region diversity (based on 594 nt) in 557 Adélie penguins from 16 breeding areas representing three regions in Antarctica, including the WAP, as well as fossil bones from 17 locations along the coast of the Ross Sea. Ritchie et al. (Reference Ritchie, Millar, Gibb, Baroni and Lambert2004) reported haplotype diversity ranges in modern Adélie penguins from 0.957 to 1.000, and nucleotide diversity from 0.021 to 0.060, similar to the results reported here. Two monophyletic lineages (clades) of Adélie penguins in Antarctica were observed (Ritchie et al. Reference Ritchie, Millar, Gibb, Baroni and Lambert2004). One lineage was recorded mostly in the Ross Sea (Ross Sea lineage, RS); the other lineage (Antarctic lineage, A) was present across the continent, including the WAP. Comparison of our 52 haplotypes with data accessioned in GenBank (Fig. 2) demonstrated that all haplotypes assayed from our study colonies belonged to the A lineage as would be expected.
An overall lack of genetic structure was detected among regional breeding colonies of Adélie penguins based on both marker types (Table III), as well as our Bayesian clustering analysis. Therefore, our data confirm a panmictic population, which was also reported by Clucas et al. (Reference Clucas, Dunn, Dyke, Emslie, Levy, Naveen, Polito, Pybus, Rogers and Hart2014) based on analyses of mtDNA only of Adélie penguins also of this region, as well as a circumpolar study of Adélie penguin nuclear markers (Roeder et al. Reference Roeder, Marshall, Mitchelson, Visagathilagar, Ritchie, Love, Pakai, McPartlan, Murray, Robinson, Kerry and Lambert2001). A recent review of population differentiation in seabirds indicates that genetic structure is highly variable across many seabird species, and that more population genetic research is particularly needed for the penguins (Friesen et al. Reference Friesen, Burg and McCoy2007). The genetic survey reported here is representative of breeding colonies not sampled by Clucas et al. (Reference Clucas, Dunn, Dyke, Emslie, Levy, Naveen, Polito, Pybus, Rogers and Hart2014); therefore, our combined results offer a more complete understanding of Adélie penguin population genetic structure of the region, which should help fill knowledge gaps for the sphenisciforms. However, one important distinction between our work and that reported by Clucas et al. (Reference Clucas, Dunn, Dyke, Emslie, Levy, Naveen, Polito, Pybus, Rogers and Hart2014) is that our data were obtained from individuals specifically associated with breeding colonies (i.e. reproductive adults or their chicks). Clucas et al. (Reference Clucas, Dunn, Dyke, Emslie, Levy, Naveen, Polito, Pybus, Rogers and Hart2014) collected genetic data primarily from the calamus of shed feathers found at colonies as late as May, well after the summer breeding season. Adélie penguins are known to moult on the pack ice, as well as on land, after having migrated from breeding colonies to fatten as the moult process is energetically expensive (Ainley Reference Ainley2002). In many cases, Adélie penguins do not necessarily seek out moult sites at their breeding colony (Ainley Reference Ainley2002). Thus, it is possible that the shed feathers collected by Clucas et al. (Reference Clucas, Dunn, Dyke, Emslie, Levy, Naveen, Polito, Pybus, Rogers and Hart2014) do not represent individuals that reproduced at sampling locations, but more likely those that moulted there. We suggest that future population genetic studies of breeding penguins collect DNA from individuals of known reproductive status.
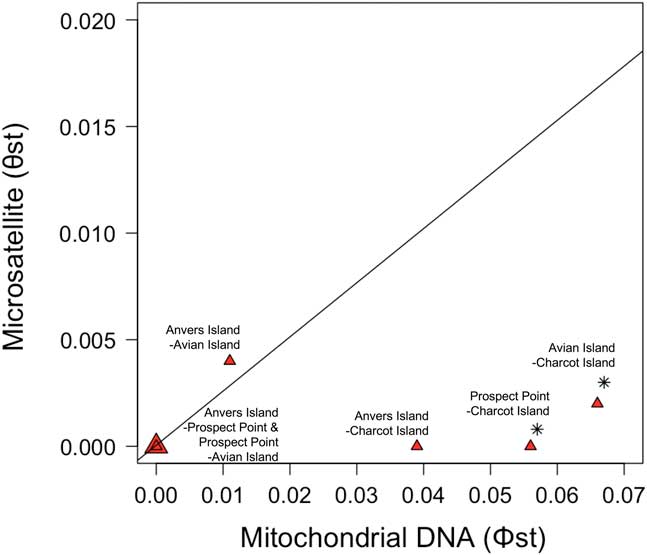
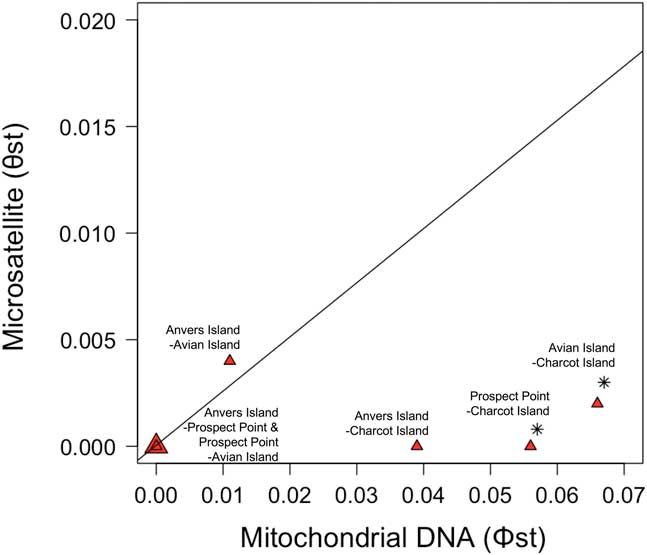
Significant population differentiation was detected at two of the three pairwise comparisons with Charcot Island based on mtDNA analyses only (Table III). As pairwise population comparisons based on nuclear markers were all non-significant (Table III), these results are interpreted as being suggestive of sex-biased dispersal strategies occurring at Charcot Island only. The effective population size of nuclear markers is four-times that of mtDNA markers; therefore, it would be expected that more population structure be observed based on mtDNA markers in comparison with nuclear markers due to the inherent differences in coalescence times (Zink & Barrowclough Reference Zink and Barrowclough2008). When pairwise estimates of colony genetic differentiation were compared to expected levels of nuclear structure given that observed in mtDNA (to establish equivalence between the two approaches) all pairwise comparisons, not including Charcot Island, were found to closely match expected equivalence values (Fig. 3). However, all pairwise comparisons, including Charcot Island, fell notably outside the expected equivalence values of population differentiation between nuclear and mtDNA markers (Fig. 3). Many studies have interpreted such results as being reflective of sex-biased dispersal where females are philopatric, while males disperse (see Zink & Barrowclough Reference Zink and Barrowclough2008 for review and references therein for examples). Interestingly, female-biased philopatry and male-mediated dispersal is generally more typical of mammalian than avian systems (Greenwood Reference Greenwood1980, Clarke et al. Reference Clarke, Saether and Roskaft1997). These issues raise the question as to why sex-biased philopatry/dispersal would be more evident at Charcot Island when no such patterns of population structure were detected among other colony comparisons along the WAP. Charcot Island is one of the most southern Adélie penguin colonies in this region of Antarctica (Lynch & LaRue Reference Lynch and LaRue2014). The marine environment here probably represents more suitable ecological conditions for the species similar to those found elsewhere around the continent that are characterized by more predictable, persistent sea ice conditions throughout the year (Ainley Reference Ainley2002), unlike more northern regions along the WAP (Ducklow et al. Reference Ducklow, Fraser, Meredith, Stammerjohn, Doney, Martinson, Sailley, Schofield, Steinberg, Venables and Amsler2013). We speculate that female-biased philopatry and male-mediated dispersal may be a more characteristic element of breeding colonies located at higher southern latitudes with more suitable ecological conditions. No other study to date has concurrently examined both marker types to lend insight on whether sex-biased philopatry/dispersal is a general feature of the Adélie penguin system that may be decoupled where environmental conditions are less stable such as the northern WAP where the species exists at its northern range limit (Fraser et al. Reference Fraser, Trivelpiece, Ainley and Trivelpiece1992, Williams Reference Williams1995).
Comparison of pairwise estimates of colony differentiation among Adélie penguins breeding west of the Antarctic Peninsula based on mitochondrial DNA Φ ST and microsatellite FST (Φ ST ) values. Regression line indicates the level of genetic structure expected at nuclear loci given the level of structure observed at mtDNA markers. Colony pairwise comparisons located below the regression line are suggestive of female-biased philopatry or male-biased dispersal. Significant pairwise comparisons are noted by an asterisk.
Estimates of gene flow based on a two-population coalescent model (MIGRATE) were asymmetrical from the species regional core at Avian Island to its northern range at Anvers Island. Gene flow estimates for Adélie penguins have not been reported previously. Our result of asymmetrical gene flow may reflect the fact that the Anvers Island breeding colony is located at the species northern range margin along the WAP and therefore has historically always operated as a population sink. As such, it is not surprising that as climate dramatically warms along the WAP, Adélie penguin colonies at their northern range would be the first to show declines. A growing body of literature has highlighted Adélie penguin population response to Southern Ocean climate variability over geological time scales noting that during glacial retreat, particularly in association with warming trends following the Last Glacial Maximum (~18 000 years ago) and before and after the Little Ice Age (~150–300 years ago), numbers of individuals tended to increase and occupy new terrestrial breeding areas along the WAP (Emslie et al. Reference Emslie, Fraser, Smith and Walker1998, Reference Emslie, Ritchie and Lambert2003, Emslie & McDaniel Reference Emslie and McDaniel2002) and other regions of the Antarctic (Millar et al. Reference Millar, Subramanian, Heupink, Swaminathan, Baroni and Lambert2012, Younger et al. Reference Younger, Emmerson, Southwell, Lelliott and Miller2015), mainly driven by the exposure of new terrestrial breeding sites and favourable foraging conditions. The current extreme warming regime along the WAP, which has been associated with notable increases in snow precipitation, appears to be similar to historical periods of glacial advance, when numbers of penguins were smaller, as suitable terrestrial nesting habitats have diminished as a result of increased snow cover (Fraser et al. Reference Fraser, Patterson-Fraser, Ribic, Schofield and Ducklow2013).
Regarding our study’s relevance to predicting future responses of Adélie penguins to ocean–climate warming, Adélie penguins of the WAP may hold a reasonable capacity to adapt to new environmental conditions given our observations of high genetic diversity. It would be fruitful to assay levels of genetic diversity at functional genes, such as the MHC genes, so that adaptive capacity can be directly tested. However, it is likely that Adélie penguins would simply disperse to regions where environmental conditions are more suitable as the species is known to have considerable dispersal ability based on annual migratory patterns, demographic studies and a lack of genetic structuring as our study and others have reported. Within this context, the likelihood that Adélie penguins would respond to new environmental conditions via adaptation is made much more difficult by their long generation times.
Acknowledgements
We thank three anonymous reviewers and Professor D. Walton (editor) for comments that greatly improved the manuscript. This work was made possible through an Antarctic Science Bursary award to KBG. Fieldwork was conducted in accordance with Antarctic Conservation Act permits to WRF, in addition to Canadian Committee on Animal Care guidelines (SFU Animal Care Permit 890B-08 to KBG and TDW). J. Blum provided invaluable help in the field. D. Patterson-Fraser provided critical logistical support. H. Lucas, R. Smaniotto, T. Morgan, K. Yeager, S. Farry and J. Mannas assisted with fieldwork. Research was conducted as part of the PAL-LTER programme (http://pal.lternet.edu) supported by grants #0217282 and #0823101 through the National Science Foundation (NSF), Office of Polar Programs (OPP) through subawards to WRF. Supplemental funds for this project were received by a separate grant #0741351 to WRF, also funded by NSF-OPP. Additional funding was provided by the Detroit Zoological Society. KBG was partially supported by SFU Graduate Fellowships and the Glen Geen Graduate Scholarship in Marine Biology, in addition to Canada Natural Sciences and Engineering Research Council Discovery Grants to TDW. Raytheon Polar Services Company and Edison Chouest Offshore provided logistical support. Any use of trade names is for descriptive purposes only and does not imply endorsement by the US Government.
Author contribution
The concept for this study was developed by KBG, SLT, WRF and TDW. Fieldwork was conducted by KBG and WRF. Laboratory work was conducted by GKS and MCG. Data analysis was conducted by KBG, SLT, SAS, GKS and MCG. All authors contributed to writing and editing of the manuscript.
Data management
Microsatellite data reported here are publicly available within the PAL-LTER data system (dataset #239): http://oceaninformatics.ucsd.edu/datazoo/data/pallter/datasets. These data are additionally archived within the US LTER Network’s Information System Data Portal (https://portal.lternet.edu/). Individuals interested in using these data are therefore expected to follow the US LTER Network’s Data Access Policy, Requirements and Use Agreement (http://www.lternet.edu/policies/data-access). Sequence data have been archived in GenBank (see Table S1 for accession numbers). For information regarding laboratory cross-validation contact kgorman@pwssc.org.
Supplementary Material
A supplemental table will be found at http://dx.doi.org/10.1017/S0954102017000293.