Introduction
Dementia is a clinical syndrome characterized by progressive cognitive impairment. Alzheimer's disease (AD) is the most common cause of dementia characterized by cognitive decline severe enough to disrupt daily life activities. Neurodegenerative disorders such as AD will affect a growing number of people as our populations age. Approximately 14–18% of individuals aged 70 years and older have MCI, with 10–15% of these individuals annually progressing to dementia, particularly AD (Petersen et al., Reference Petersen2009). DLB is a neurodegenerative disorder characterized by progressive, fluctuating cognitive and behavioral disturbance, visual hallucinations, and Parkinsonism. It is the second most common cause of dementia after AD in some reports (McKeith, Reference McKeith2004). PD is the second most common neurodegenerative disorder after AD (Tokuda et al., Reference Tokuda, Qureshi and Ardah2010); as many as 85% of patients with PD develop cognitive impairment to within 15 years after diagnosis that is severe enough to meet diagnostic criteria for dementia (Emre, Reference Emre2007). MSA is characterized by fibrillary aggregates of α-synuclein protein in the cytoplasm of selective populations of neurons and glia. Dementia is not a feature of MSA, patients with MSA commonly exhibit depression or emotional lability (Marti et al., Reference Marti, Tolosa and Campdelacreu2003). Abnormalities in α-synuclein are associated with the neurobiology of several of the above conditions. Although, α-synuclein measurement in CSF is not useful clinically in predicting progression of motor symptoms, it might predict cognitive decline (Stewart et al., Reference Stewart, Liu and Carmen2014).
AD dementia is often difficult to differentiate from that caused by other neurodegenerative disorders, because clinical presentations may overlap (Jellinger and Attems, Reference Jellinger and Attems2008; Irwin et al., Reference Irwin, White and Toledo2012). Analysis of CSF biomarkers is increasingly applied to the diagnostic work-up of neurodegenerative disorders. AD is associated with a CSF biomarker profile of decreased beta-amyloid 42, and increased total tau and phosphorylated tau when compared to cognitive normal persons or those with other dementias (Tang et al., Reference Tang, Huang, Wang, Wang and Yao2014a; Reference Tang, Huang, Wang, Wang and Yao2014b). These CSF biomarkers reflect the main neuropathological features of AD, but the ability of these markers to distinguish AD from DLB is limited (Parnetti et al., Reference Parnetti, Lanari, Amici, Gallai, Vanmechelen and Hulstaert2001; Mollenhauer et al., Reference Mollenhauer2005). Since α-synuclein is found in CSF and plasma, several studies suggest that α-synuclein may serve as a biomarker to differentiate AD from other neurodegenerative disorders (including DLB, PD, and MSA). Previous studies evaluated associations between CSF α-synuclein and neurodegenerative disorders, including AD, DLB, PD, and MSA, but findings are inconsistent. In order to summarize findings across studies, we conducted a meta-analysis to examine whether CSF α-synuclein can help discriminate AD from other neurodegenerative disorders.
Methods
Data sources, search strategy, and section criteria
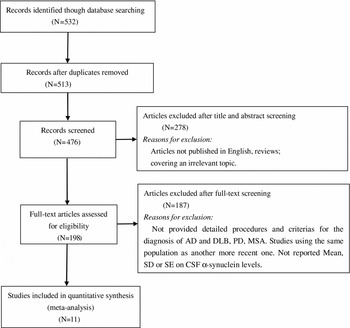
PubMed, Elsevier, Springer Link, and the Cochrane Library were searched by using key words and medical subject headings (Alzheimer's disease, α-synuclein, dementia, cerebrospinal fluid) to identify relevant articles. All searches were limited to the published English literature. We also performed a hand search of references of retrieved as well as published reviews to identify additional eligible articles. Article selection was carried out in two steps. The first step screened only the title and abstract of each article, and the second step reviewed the full text. The eligible articles fulfilled three criteria: (1) Reported detailed criteria for the diagnosis of AD, DLB, PD, and MSA. (2) Reported mean, standard deviation, or standard error of CSF α-synuclein levels. (3) Included both females and males. Irrelevant or duplicate publications were excluded. If studies contained overlapping samples, only the largest sample size was included in this meta-analysis. A total of 11 articles met these criteria and are included in the meta-analysis: ten studies for AD versus DLB, five studies for AD versus PD, three studies for AD versus MSA, and ten studies for AD versus neurological normal control (Figure 1).
Flow diagram of the study selection process.

Data extraction
The following information from all eligible studies was extracted by two researchers: author, year of publication, number of patients, age of patients, and measurement method of CSF α-synuclein levels.
Statistical analyses
All analyses were performed using the Stata 11.0 statistical software, with a significance level set to P < 0.05. We estimated SMDs, with 95% CI, comparing AD to the other conditions for each study. Pooled SMD and corresponding 95% CI were calculated by using the inverse variances method. Random effects models were estimated to calculate the overall effect. We evaluated study heterogeneity using I-square tests and Q-statistics. P < 0.05 in combination with I 2 > 50% indicates significant heterogeneity (pooled SMD with 95% CI are given in Table 1). Sensitivity analyses assessed the stability of the meta-analyses by removing single studies from the study iteratively. Finally, we use funnel plots to assess for possible publication bias (Egger et al., Reference Egger, Smith, Schneider and Minder1997). The asymmetry of the funnel plot suggests publication bias.
Summary of pooled SMDs with confidence intervals (CIs) from the meta-analyses

Model* = model of meta-analysis; R = Random effect model.
Results
Included studies
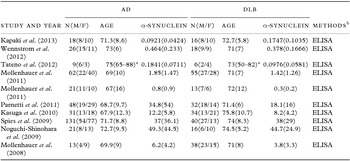
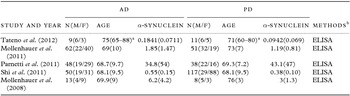
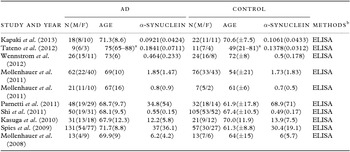
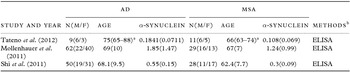
Ten studies, with a total of 648 patients, compared concentrations of CSF α-synuclein in AD to DLB (380 with AD, 268 with DLB) (Table 2). Five studies compared concentrations of CSF α-synuclein in AD to PD (Table 3), with a total of 407 patients (182 AD, 225 PD) (Table 4). Three studies compared concentration of CSF α-synuclein in AD to MSA (Table 5), with a total of 189 patients (121 AD, 68 MSA). Ten studies compared concentrations of CSF α-synuclein in AD to cognitively normal neurological controls with a total of 777 patients (409 AD, 368 controls).
Articles included in the comparisons of α- synuclein between AD and DLB

Data are presented as mean ± SD. AD = Alzheimer's disease; DLB = dementia with Lewy bodies; N = sample size; M = male; F, female.
a Data are presented as mean(range).
b ELISA, ELISA kit (Innotest, Innogenetics, Ghent, Belgium). CSF α- synuclein (pg/μl).
Articles included in the comparisons of α- synuclein between AD and PD

Data are presented as mean ± SD. AD = Alzheimer's disease; PD = Parkinson disease; N = sample size; M = male; F = female.
a Data are presented as mean(range).
b ELISA, ELISA kit (Innotest, Innogenetics, Ghent, Belgium). CSF α- synuclein (pg/μl).
Articles included in the comparisons of α-synuclein between AD and controls

Data are presented as mean ± SD. AD = Alzheimer's disease; N = sample size; M = male; F = female.
a Data are presented as mean(range).
bELISA, ELISA kit (Innotest, Innogenetics, Ghent, Belgium). CSF α-synuclein (pg/μl).
Articles included in the comparisons of α- synuclein between AD and MSA

Data are presented as mean ± SD. AD = Alzheimer's disease; MSA = multiple system atrophy; N = sample size; M = male; F = female.
a Data are presented as mean(range).
b ELISA, ELISA kit (Innotest, Innogenetics, Ghent, Belgium). CSF α- synuclein (pg/μl).
Concentration of CSF α-synuclein in AD and DLB
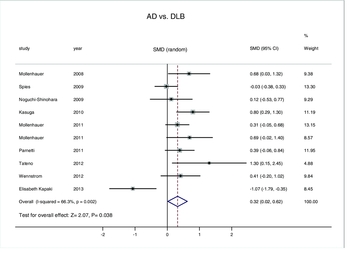
Figure 2 contains a forest plot demonstrating significantly higher mean concentrations of CSF α-synuclein in patients with AD compared to DLB [SMD: 0.32, 95% CI: (0.02, 0.62), z = 2.07, P < 0.05]. As I 2 was 66.3% suggesting moderate heterogeneity, the random effects model was used. Mean values of α-synuclein ranged from 0.092 to 49.3 pg/μl in 380 AD patients and 0.0976 to 44.7 pg/μl in 268 controls.
Forest plots for CSF α-synuclein levels in AD and DLB with random effects model.

Concentration of CSF α-synuclein in AD and PD
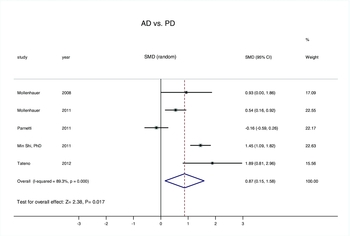
Figure 3 contains a forest plot demonstrating significantly higher mean concentrations of CSF α-synuclein in patients with AD compared to PD [SMD: 0.87, 95% CI: (0.15, 1.58), z = 2.38, P < 0.05]. As I 2 was 89.3%, suggesting heterogeneity, the random effects model was used. Mean values of α-synuclein ranged from 0.1841 to 34.8 pg/μl in 182 AD and from 0.0942 to 43.1 pg/μl in 225 PD patients.
Forest plots for CSF α-synuclein levels in AD and PD with random effects model.

Concentration of CSF α-synuclein in AD and MSA
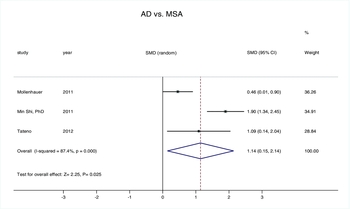
Figure 4 contains a forest plot demonstrating significantly higher mean concentrations of CSF α-synuclein in patients with AD compared to MSA [SMD: 1.14, 95% CI: (0.15, 2.14), z = 2.25, P < 0.05]. As I 2 was 87.4%, suggesting heterogeneity, the random effects model was used. Mean values of α-synuclein ranged from 0.1841 to 1.85 pg/μl in 121 AD and from 0.108 to 1.24 pg/μl in 68 MSA patients.
Forest plots for CSF α-synuclein levels in AD and MSA with random effects model.

Concentration of CSF α-synuclein in AD and neurological cognitively normal controls
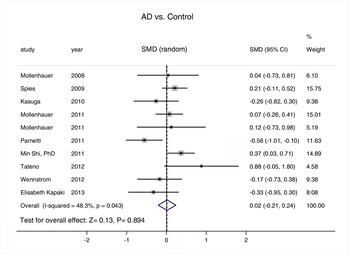
Figure 5 contains a forest plot demonstrating no significant difference in CSF concentrations between patients with AD and neurological cognitively normal controls [SMD: 0.02, 95% CI: (−0.21, 0.24), z = 0.13, P > 0.05]. Mean values of α-synuclein ranged from 0.092 to 37 pg/μl in 409 AD patients and from 0.1061 to 68.9 pg/μl in 368 controls.
Forest plots for CSF α-synuclein levels in AD and control with random effects model.

Assessment of publication bias
Begg and Egger tests were performed to assess for publication bias of the included studies. Results were symmetrical, suggesting a lack of publication bias for AD versus DLB (Begg's test: z = 0.54, P = 0.592; Egger's test: t = 0.60, P = 0.565), AD versus PD (Begg's test: z = −0.24, P = 1.000; Egger's test: t = 0.34, P = 0.755), AD versus MSA (Begg's test: z = 0.00, P = 1.000; Egger's test: t = 0.36, P = 0.779), or AD versus neurological normal controls (Begg's test: z = 0.00, P = 1.000; Egger's test: t = −0.52, P = 0.618).
Discussion
α-synuclein belongs to a family of small proteins (113–143 amino acids) that are highly expressed in nervous tissue with enrichment in presynaptic terminals (Jakes et al., Reference Jakes, Spillantini and Goedert1994; Irizarry et al., Reference Irizarry1996). α-synuclein is implicated in the pathogenesis of various neurodegenerative diseases. It might play a role in the regulation of synaptic plasticity involved in songbird learning (George et al., Reference George, Jin, Woods and Clayton1995), neuronal differentiation (Kholodilov et al., Reference Kholodilov1999; Stefanis et al., Reference Stefanis, Kholodilov, Rideout, Burke and Greene2001), up-regulation of dopamine release (van der Putten et al., Reference van der Putten, Wiederhold and Probst2000), or mitochondrial deficits (Mizuno et al., Reference Mizuno1998; Kakimura et al., Reference Kakimura, Kitamura, Takata, Kohno, Nomura and Taniguchi2001), Additionally, it has chaperone-like activity (Ostrerova et al., Reference Ostrerova1999; Souza et al., Reference Souza, Giasson, Lee and Ischiropoulos2000). Taken together, α-synuclein may be involved in aberrant synapse formation in the brain of AD patients (Brookes and St Clair, Reference Brookes and St Clair1994; Iwai et al., Reference Iwai1995).
Early diagnosis of neurodegenerative disorders is important for a number of reasons, including treatment initiation at the earliest stages (Santacruz and Swagerty, 2001). This meta-analysis evaluates the clinical significance of α-synuclein in discriminating AD from other neurodegenerative disorders, including DLB, PD, and MSA, based on the available published articles. The findings indicated that the concentration of CSF α-synuclein in AD was significantly higher than in all other neurodegenerative disorders assessed. The higher CSF α-synuclein levels observed in AD may be explained by the fragment of α-synuclein (termed the non-amyloid β component of AD amyloid) that is a constituent of AD amyloid plaques (Culvenor et al., Reference Culvenor, McLean and Cutt1999). There is also a body of evidence indicating an interaction of α-synuclein with tau-hyperphosphorylation involved in neurodegeneration. Since CSF levels of phosphorylated-tau are elevated in AD (Formichi et al., Reference Formichi, Battisti, Radi and Federico2006), the elevated CSF levels of α-synuclein in AD might be attributed to a tau-α-synuclein interaction (Esposito et al., Reference Esposito, Dohm, Kermer, Bahr and Wouters2007). The exact mechanism for the findings of possibly lowered CSF α-synuclein levels in DLB and MSA remains unanswered. A low CSF α-synuclein level is associated with low levels of CSF DJ-1, a protein that has protective roles against antioxidative stress and apoptosis (Hong et al., 2010). Hong et al. (2010) speculated that in patients with PD this might reflect a lack of adaptive response to the aging process. Alternatively, a decrease in CSF α-synuclein could be secondary to sequestration with DJ-1 in brain aggregates.
When we compared the concentration of CSF α-synuclein in AD to cognitively normal neurological controls there was no significant difference. Although the findings suggested a tendency toward higher CSF α-synuclein concentration in AD patients compared to controls, this was probably due to the heterogeneity of patients included in the control group.
Kapaki et al. (Reference Kapaki, Paraskevas, Emmanouilidou and Vekrellis2013) reported lower CSF α-synuclein levels in AD compared to DLB, in contrast to results from other studies. Spies et al. (Reference Spies, Melis, Sjogren, Rikkert and Verbeek2009) reported that CSF α-synuclein concentrations in AD and DLB patients were similar and CSF α-synuclein did not discriminate neurodegenerative disorders. Parnetti et al. (Reference Parnetti, Chiasserini and Bellomo2011) reported lower CSF α-synuclein levels in AD compared to PD. These conflicting results might be explained by heterogeneous inclusion criteria, limited patient numbers, and differences in α-synuclein quantification. Various factors may influence the balance between production, clearance, and solubility of CSF α-synuclein. Further studies are warranted to clarify the specific molecular mechanisms underlying these observations.
There are important limitations to widespread use of CSF α-synuclein in clinical routine screening. Given the need for a lumbar puncture to obtain the CSF sample, estimation of α-synuclein may be regarded as a moderately invasive process. However, the incidence of severe complication with this process is very low, with post-lumbar headache the most frequent complaint (Blennow et al., Reference Blennow, Wallin and Hager1993). Further, there are some methodological dilemmas: the cut-off values reported in different publications comparing AD to DLB, PD, or MSA are variable, because they were derived from the population under study as opposed to standardized values. It was also unclear which type of α-synuclein was being measured by the assays used. Three molecular forms of α-synuclein have been identified as expressed in the brain: α-synuclein 140 (full length), α-synuclein 126 (lacks exon 3), and α-synuclein 112 (lacks exon 5) (Beyer, Reference Beyer2006). The assays involved in each of the included studies measured different components of the α-synuclein mixture in CSF resulting in wide variations in levels reported. Additionally, differences in sample handling, pipetting, incubation modalities, washing procedures, curve fitting, and batch-to-batch variation of standards may have introduced assays variation. Meta-analysis can be an effective approach to addressing a variety of clinical problems by summarizing and reviewing published quantitative studies. This meta-analysis had several advantages: First, the number of total patients included was substantial (N = 1,338). Second, publication bias was not detected indicating that the pooled results might be unbiased. Third, the quality of included studies was satisfactory and met inclusion criterion. Several limitations of this meta-analysis should be considered when interpreting results. First, the cut-off values, sensitivity, and specificity of comparisons were not researched. Second, the number of studies in the MSA group was not sufficiently large to provide a precise estimate. Third, there may have been language bias as we only included publications in English.
Conclusion
The results of the present study suggest that the CSF α-synuclein may be a good biomarker for discriminating AD from other neurodegenerative diseases (PD, DLB, and MSA). CSF α-synuclein levels did not differ significantly between AD and neurological normal controls suggesting limited utility in comparing AD to cognitively normal persons. Further studies are needed to explore the underlying mechanism.
Conflict of interest
None.
Description of authors’ roles
All the authors have participated and have made substantial contributions to this paper. Zheng-Yu Wang initiated the research idea and designed this study. Zhen-Min Han and Zheng-Yu Wang advised in designing the study and supervised overall processes of it. Wei Tang, Kui Ye, Zhen-Min Han, and Zheng-Yu Wang managed literature searches and statistical analysis. Qi-Fei Liu and Zhen-Min Han supervised statistical work. Zheng-Yu Wang wrote the manuscript.
Acknowledgments
This study was supported by grants from the Natural Science Foundation of Anhui Province (grant no. 1208085MH145), Department of Anhui Province Education (grant no. KJ2011Z161).