


I. Introduction
The gender composition of corporate boards has attracted significant policy and investor attention. Many countries have responded with rules-based approaches mandating female board quotas. France, Italy, Belgium, the Netherlands, and Norway have imposed such quotas (Winters and Jacobs-Sharma (Reference Winters and Jacobs-Sharma2016)), and the European Union adopted a 40% quota set to take effect in mid-2026.Footnote 1 However, critics argue that one-size-fits-all mandates may be inefficient, as the costs and benefits of compliance vary across firms. In the U.S., such mandates have also encountered political resistance.Footnote 2 Moreover, while quotas have increased female board representation in places like Norway and California, the evidence of the effects on shareholder value is mixed at best (Ahern and Dittmar (Reference Ahern and Dittmar2012), Greene, Intintoli, and Kahle (Reference Greene, Intintoli and Kahle2020), Hwang, Shivdasani, and Simintzi (Reference Hwang, Shivdasani and Simintzi2020), Eckbo, Nygaard, and Thorburn (Reference Eckbo, Nygaard and Thorburn2022), and Allen and Wahid (Reference Allen and Wahid2023)).
An alternative to a prescriptive rules-based regulatory approach is a principles-based one in which firms publicly disclose their compliance with suggested “best practice” guidelines, and if their practices depart from guidelines, firms must explain their non-compliance. This approach recognizes that one-size-fits-all rules may not suit every firm and thus allows firms to tailor their governance practices to their specific circumstances, as long as they disclose the reasoning behind their choices.
In 2014, the Canadian government introduced a principles-based approach to improve board gender diversity,Footnote 3 which was implemented by the Ontario Securities Commission (OSC) as an amendment to National Instrument 58-101 (“Disclosure of Corporate Governance Practices”), effective Dec. 31, 2014. The OSC amendment includes three comply-or-explain provisions relating to board diversity, which require the disclosure of i) a diversity policy (or explain the absence of such a policy), ii) the board’s or nominating committee’s consideration of women in the director identification or selection process (or explain the absence of such consideration), and iii) whether the firm has adopted a target for the representation of women on the board (or explain the absence of such a target).
In this article, we examine the effectiveness of the OSC’s amendment on gender diversity in Canadian corporate boards.Footnote 4 A priori, it is not clear what effect this principles-based regulatory approach will have on board diversity. On one hand, by requiring firms to disclose their compliance or explain non-compliance, the amendment enables stakeholders to evaluate corporate diversity practices, potentially prompting increased pressure to diversify boards. On the other hand, because the amendment allows firms the option to explain their lack of board diversity, this approach may be too weak to increase the presence of females on corporate boards. Ultimately, this approach places the burden on investors to assess and respond to the adequacy of firms’ policies regarding female board representation (see, e.g., Hart and Zingales (Reference Hart and Zingales2017)).
The OSC amendment may influence firm behavior through several channels. Firms must report female representation, disclose whether they consider gender in board nominations and selections, and indicate whether they set targets for female representation. Even firms that choose not to adopt board diversity measures are required to articulate their stance, which may subject them to greater scrutiny. This can raise the cost of inaction, especially for firms concerned about investor and public perception. The requirement to formalize and disclose nomination procedures may also compel boards to reassess recruitment pipelines, renewal practices, and selection criteria, potentially leading them to identify structural barriers and encourage more inclusive policies. Greater transparency may reduce information costs for investors, enabling them to evaluate diversity performance and integrate it into Environmental, Social, and Governance (ESG) decisions. It may also foster peer benchmarking and help normalize gender diversity as a core element of good governance.
To shed light on the relative costs of this principles-based regulation for shareholders, we run an event study around the OSC’s first announcement that it would be introducing comply-or-explain requirements for board diversity. Firms most likely affected by the amendment—those without a voluntary female representation policy and those with an all-male board—exhibit positive and statistically significant cumulative abnormal returns (CARs) around the announcement, with 2-day abnormal returns of 1.4% and 2.0%, respectively. In multivariate regressions, we find that these firms exhibit 1.2% higher announcement returns than other firms, and returns increase with the proportion of male directors on the board.
Given that the Ontario government had already signaled its intent to regulate board and executive gender diversity in May 2013, the market likely anticipated some form of regulation before the July 30 announcement. Thus, the July 30 announcement clarified the nature of the regulation rather than its existence. Our results suggest that investors reacted favorably to the clarification that the forthcoming regulation would take a principles-based, disclosure-oriented form rather than impose prescriptive quotas. With some studies suggesting that board gender diversity mandates have significant compliance costs (Ahern and Dittmar (Reference Ahern and Dittmar2012), Greene, Intintoli, and Kahle (Reference Greene, Intintoli and Kahle2020), and Hwang, Shivdasani, and Simintzi (Reference Hwang, Shivdasani and Simintzi2020)), our event study results are consistent with investors perceiving a principles-based approach as mitigating some of the anticipated compliance costs associated with prescriptive board diversity mandates.
Consistent with investors viewing the proposal as economically meaningful, firms moved quickly to adopt and disclose diversity policies following the announcement of the amendment. To assess the impact of the amendment, we classify firms based on their compliance level (see Panel A of Table 1). “Full Compliers” fulfill the maximum level of compliance, adhering to all three provisions—they disclose a gender diversity policy for board nominations, consider the representation of women in the director identification and selection process, and set formal targets for the representation of women on the board. “Partial Compliers” disclose a gender diversity policy for board nominations and consider the representation of women in the director identification and selection process but do not set targets. “Explainers” meet the minimum compliance standard by disclosing a gender diversity policy without adopting targets or considering women’s representation in director selection. Their disclosures justify non-adoption rather than reflect meaningful integration of gender diversity into governance practices. Using these classifications, we assess firms’ responses to the OSC amendment.

TABLE 1 Long description
Panel A, Classification of Compliance with the O S C Amendment, defines three levels. Full Complier meets Item 2 (Diversity Policy), Item 3 (Consider Women in Selection), and Item 5 (Set Target) for a High commitment level. Partial Complier meets Items 2 and 3 only for a Moderate level. Explainer meets only Item 2 for a Minimal level.
Panel B, Time Series of Compliance with Key O S C Amendment Items, shows annual percentages from 2011 to 2018. Item 2 compliance rose from 10.3 percent to 100 percent. Item 3 rose from 9.2 percent to 93.1 percent. Item 5 rose from 0.7 percent to 40.7 percent. By compliance level in 2018, Full Compliers were at 40.7 percent, Partial Compliers at 53.0 percent, and Explainers at 6.3 percent.
Panel C, Time Series of Usage of Female Director Targets by Full Compliers, shows the number of firms with targets grew from 2 in 2011 to 102 in 2018. For these firms, the mean female director target started at 37.5 percent in 2011 and stabilized at 28.7 percent by 2018. The median and mode targets both settled at 30 percent from 2014 through 2018.
We find that firms moved quickly to adopt and disclose diversity policies (see Panel B of Table 1).Footnote 5 While in the 2 years preceding the amendment, only 12% of firms included a diversity policy in their proxy statements, by 3 years after the amendment, fully 100% of firms implemented a diversity policy. However, the tone and content of policies vary significantly. While some firms express a clear commitment to enhancing board gender diversity, others emphasize that appointments should be based solely on merit, with no consideration of gender. Thus, the mere act of disclosing a diversity policy does not necessarily reflect a substantive commitment to improving board diversity. Accordingly, we next examine the extent to which firms comply beyond merely disclosing a diversity policy.
Over our sample period, full compliance rose markedly: from just 3% of firms in the year before the OSC amendment to 15% in the year of its enactment, rising to nearly 41% by 2018. Full Compliers adopt female director targets averaging 28.9% and ranging from 12.5% to 50%. The most common target used before 2014 was 25%, while the most common target utilized after the amendment’s introduction is 30%. The average target is just under 29% each year since 2014, with the median at 30% since 2014. Partial compliance increased substantially from 21% pre-amendment to 72% in the post-amendment year, declining to 52% in 2018 as firms adopted targets and transitioned to full compliance. By 2018, fewer than 7% of firms remained as explainers, offering justifications for non-adoption rather than demonstrating meaningful integration of gender diversity into governance practices.
A key advantage of a principles-based regulatory approach is that it provides firms the flexibility to choose between compliance and explanation, allowing them to account for economic frictions that may affect the cost of compliance. However, this flexibility can also enable strategic non-compliance, for instance, due to agency costs. To distinguish between these two contrasting views on principles-based governance, we examine cross-sectional differences in the types of firms that choose to comply versus explain.
We find that firms are more likely to fully comply when they are located near a larger pool of qualified female directors and when their directors are connected to female directors through other board appointments or to peers at other fully compliant firms, highlighting the importance of local access and network ties. In addition, firms with greater media coverage are significantly more likely to fully comply, suggesting that public scrutiny may serve as a reputational incentive for adopting stronger gender diversity policies. Conversely, controlled corporations, which typically face weaker market and governance pressures, are less likely to fully comply, indicating that ownership structure may dampen responsiveness to regulatory and social expectations. Overall, firm responses to the OSC amendment, in particular with regard to setting a gender target, appear shaped by both structural barriers and strategic considerations.Footnote 6 This variation in compliance prompts a broader question: Has the amendment had a measurable impact on the representation of women on boards?
Despite the absence of a mandate, we find a meaningful increase in board diversity among firms affected by the amendment. The share of firms adding a female director doubled after the amendment, rising from 20% in 2011–2013 to 40% in 2015–2017. Multivariate regression results show that partial compliance is associated with a 2.8 percentage point increase in the female director ratio the following year, while full compliance corresponds to a 6.1 percentage point increase. To contextualize these findings, we compare Canadian firms to similar U.S.-listed firms that experienced no gender diversity regulation during the sample period. Difference-in-differences (DiDs) estimates show that Canadian firms increased the proportion of female directors by 3.8 to 4.3 percentage points in the 2 years following the amendment, representing a 38% to 43% increase relative to the pre-amendment average, in which women held 10% of board seats. Notably, this effect is comparable to the 40% rise in female directors observed in California following the SB 826 diversity mandate (Greene, Intintoli, and Kahle (Reference Greene, Intintoli and Kahle2020)). Importantly, these effects appear persistent rather than short-lived, as both female board representation and full compliance continue to increase through the end of our sample period.
Several aspects of our results point to a causal explanation that the amendment led to a meaningful increase in female director ratios. First, our matched U.S. control group offers a plausible counterfactual. U.S. firms are geographically proximate and more closely linked to Canadian firms in terms of board connections, culture, and business relationships relative to firms in other countries. Mitigating concerns that different trends in governance may drive our results, our results also hold when we restrict our sample to Canadian firms cross-listed in the U.S., which are thus subject to U.S. SEC governance regulation. Second, our matched U.S. control firms are similar to our Canadian treated firms pre-regulation. Third, the treated and control firms show parallel trends in female director ratio and the rate of change in female director ratio prior to the introduction of the amendment. Fourth, to mitigate potential concerns that our results could be due to contemporaneous trends that may have influenced institutional investors’ attitudes toward board diversity, we use Google Search Trends to construct an index of public attention to gender diversity. We find a high correlation (0.91) between societal attention to gender diversity between the two countries during our sample period. This high correlation suggests that both U.S. control firms and Canadian treated firms in our study are subject to similar societal trends. Therefore, our DiD specifications isolate the impact of the OSC regulation from broader societal trends and bolster our confidence that the observed increases in female director ratios are attributable to the regulation.
To ensure our results are not an artifact of our choice of using matched U.S.-based firms as a control group, we also examine year-on-year changes in female director ratios within Canada. We find a statistically significant increase in the year-on-year change in female director ratios for Canadian firms after 2014, confirming the existence of a kink in the trajectory of female director ratios following the amendment. Moreover, firms with all-male boards before the amendment—those most likely to be impacted by the OSC’s announcement—exhibited a significantly larger increase. These findings are further evidence that the pronounced increase in female director ratios is a result of the OSC amendment.
These findings are notable given that the OSC amendment did not mandate increased gender diversity on boards but instead required firms to disclose their policies regarding board representation. So, what precipitated these changes? In its consultation article proposing the amendment, the OSC stated that such disclosures provide investors and stakeholders with information on advancing women’s representation on boards, which may in turn impact investment and voting decisions.Footnote 7 Consistent with this, we find that when the firm’s disclosure dismisses gender targets as unnecessary or inappropriate, nominating committee chairs of all-male boards receive more votes withheld and against. This suggests that the increase in board diversity post-amendment may result from shareholder pressure. Thus, we examine institutional investor engagements and voting outcomes surrounding the regulation to gain insights into how shareholders respond to the enhanced disclosures. We find that institutional investor engagements on board diversity increase after the amendment, followed by increased board diversity and use of gender targets. Additionally, after the amendment, shareholders are increasingly likely to vote against nominating chairs (and committees) of firms with non-diverse boards. Overall, the evidence suggests that the required disclosure of diversity policies led to an increase in board diversity, at least partly via investor engagement and voting.
In sum, our findings suggest that a principles-based approach to director diversity regulation offers a viable alternative to rules-based governance when one prescription does not fit all. The choice between these two approaches ultimately depends upon regulators’ priorities. For a regulator that prioritizes increasing board diversity at any cost, a rules-based approach will undoubtedly be most effective, as it allows a regulator to prescribe and enforce a board diversity target quickly. Our results suggest a principles-based disclosure regulation can still have the desired effect of increasing board diversity, albeit to a lesser extent and at a slower pace. For a regulator that also prioritizes limiting compliance costs, a principles-based approach may thus be a compelling option, and key similarities between Canada and other markets such as the U.S. and the U.K. are likely to make our results generalizable to such markets. More generally, external validity is likely strongest in jurisdictions with similar enabling features such as active institutional investors, high proxy voting participation, and disclosure regimes that allow shareholders to compare governance practices across firms.
II. Related Literature
There is inconclusive evidence on the impact of board and management gender diversity on firm performance (Adams and Ferreira (Reference Adams and Ferreira2009), Dezso and Ross (Reference Dezso and Ross2012), Matsa and Miller (Reference Matsa and Miller2013), and Liu, Wei, and Xie (Reference Liu, Wei and Xie2014)). As a result, studies have hypothesized that regulation aimed at increasing female board representation can have both positive and negative effects on shareholder value.
Existing evidence on director gender diversity regulation largely focuses on prescriptive regulation enforcing director gender quotas. Our study differs in that we focus on the introduction of board gender diversity rules under a principles-based/comply-or-explain mandatory-disclosure approach that is far less prescriptive than a mandatory quota. Consequently, whereas an enforced mandatory quota may be assumed to result in increased female presence on boards, the effectiveness of a principles-based approach cannot be taken for granted. How effective principles-based regulation is at increasing director gender diversity, particularly relative to mandatory quotas, is thus an important and interesting question that is yet to be fully answered. Our article fills this gap, providing evidence showing that even principles-based regulation that only mandates disclosure of gender diversity policies is followed by measurable increases in female board representation and the use of female director targets.
Much of the existing evidence on the impact of mandatory director gender quotas is event-study-based. Event studies of mandatory quotas in Norway (Ahern and Dittmar (Reference Ahern and Dittmar2012)) and California (Greene, Intintoli, and Kahle (Reference Greene, Intintoli and Kahle2020), Hwang, Shivdasani, and Simintzi (Reference Hwang, Shivdasani and Simintzi2020)) point to a negative impact on shareholder value and are suggestive of high compliance costs. In contrast, Eckbo, Nygaard, and Thorburn (Reference Eckbo, Nygaard and Thorburn2022) find that the effect of the Norwegian director gender law on shareholder value is statistically insignificant. Their findings are echoed by Allen and Wahid (Reference Allen and Wahid2023), who show that the market reaction to the introduction of the California rules is also statistically insignificant and is, if anything, positive. Still, Matsa and Miller (Reference Matsa and Miller2013) report that the rules introduced in Norway are associated with a reduction in firm profitability. Overall, the evidence on the value effect of prescriptive regulatory approaches to gender diversity may be viewed as mixed. Our event study evidence points to an unambiguously positive market reaction for firms most affected by the principles-based regulation we study. Our evidence therefore suggests that principles-based regulation is perceived to be less costly for shareholders than more prescriptive regulation.
Our article is broadly related to studies that contrast an agency cost view of governance reform (e.g., Bebchuk and Fried (Reference Bebchuk and Fried2003), Schoar and Washington (Reference Schoar and Washington2011)), which contends that regulation is needed to override powerful managers to implement optimal governance practices, with a private ordering view (e.g., Demsetz and Lehn (Reference Demsetz and Lehn1985), Hermalin and Weisbach (Reference Hermalin and Weisbach1998), Larcker, Ormazabal, and Taylor (Reference Larcker, Ormazabal and Taylor2011)), which purports that firms’ chosen governance practices are optimal. Our findings suggest that a principles-based approach, which may be viewed as a hybrid between prescriptive regulation and private ordering, is likely to retain benefits of both approaches, such as broad compliance and flexibility, while mitigating many of their costs.
Our article contributes to the literature on the impact of a principles-based approach to governance reform more generally (see Dahya, McConnell, and Travlos (Reference Dahya, McConnell and Travlos2002), Broshko and Li (Reference Broshko and Li2006), Dahya and McConnell (Reference Dahya and McConnell2007), Ford (Reference Ford2008), Arcot and Bruno (Reference Arcot and Bruno2018), and Dahya, Golubov, Petmezas, and Travlos (Reference Dahya, Golubov, Petmezas and Travlos2019)). Consistent with Arcot, Bruno, and Faure-Grimaud (Reference Arcot, Bruno and Faure-Grimaud2010), who focus on the U.K., we find an increasing trend of compliance following the adoption of principles-based regulation (for director gender diversity in Canada) and that ownership structure is associated with the degree of compliance. In the context of principles-based regulation, we are the first to examine the effect of economic frictions on firms’ compliance. Our findings indicate that economic frictions that vary across firms (e.g., access to qualified female directors due to geographical proximity or board connections) are the main determinants of firms’ compliance. We are also the first to examine the mechanism through which principles-based regulation affects corporate policy. We show that principles-based regulation strengthens institutional investor engagement on board gender diversity, highlighting investor pressure as an important channel driving compliance.
Finally, our study also speaks to the issue of mandatory enhanced disclosure in the specific context of director diversity. In mandating firms to disclose a gender diversity policy or explain its absence, the form of the principles-based regulation we study resembles enhanced disclosure regulation, particularly given the absence of a best practice guideline. There is broad evidence on the benefits (Dye (Reference Dye1990), Healy and Palepu (Reference Healy and Palepu2001), Khurana, Pereira, and Martin (Reference Khurana, Pereira and Martin2006), Hope and Thomas (Reference Hope and Thomas2008), and Leuz and Wysocki (Reference Leuz and Wysocki2008)), costs (Harris (Reference Harris1998), Bushee and Leuz (Reference Bushee and Leuz2005)), and effectiveness (Perry and Zenner (Reference Perry and Zenner2001), Faulkender and Yang (Reference Faulkender and Yang2013), and Bakke, Mahmudi, and Newton (Reference Bakke, Mahmudi and Newton2020)) of mandatory enhanced disclosure. We present evidence showing that requiring Canadian-listed firms to disclose their director diversity policies created the benefit of increased female directorships while mitigating compliance costs associated with mandatory quotas. In the next section, we discuss the specifics of the OSC gender diversity policy that we study.
III. The Ontario Securities Commission’s Gender Diversity Policy
Government support for regulatory action on board gender diversity in Canada led the Ontario Government to signal its intention to introduce such regulation in May 2013.Footnote 8 This occurred when the government included the following statement in its annual budget: “the government strongly supports gender diversity on boards… the government will consider the best way for firms to disclose their approaches to gender diversity, with a view to increasing the participation of women on boards and in senior management.” Subsequently, in a move not publicly disclosed at the time (see Table 2), the OSC was asked to begin a consultative process regarding disclosure norms pertaining to gender diversity on June 14, 2013.

TABLE 2 Long description
The table consists of two columns: Date and Action.
* April 5, 2013: The Canadian government names a new committee to offer advice on gender diversity on Canada’s corporate boards.
* May 2, 2013: An Ontario budget document is released stating government support for broad gender diversity on boards and senior management.
* May 28, 2013: Ontario’s Minister responsible for Women’s Issues, Laurel Broten, provides remarks foreshadowing the regulation.
* June 14, 2013: The Minister of Finance and the Minister responsible for Women’s Issues request the O S C undertake a consultation process (not publicly announced).
* July 30, 2013: An O S C proposal is released detailing a proposed amendment to National Instrument Form 58-101 to include disclosure of gender diversity on the Board and in Executive Officer positions. This entry is bolded.
* January 16, 2014: A modified proposal is released with the addition of term limit disclosure.
* October 15, 2014: Notice of Implementation of Amendment to Form 58-101 is released.
* December 11, 2014: O S C announces approval of the amendment by the Minister of Finance on November 28, effective December 31, 2014.
* December 31, 2014: National Instrument 58-101, Disclosure of Corporate Governance Practices, is officially amended.
In response, the OSC issued a consultation article on July 30, 2013. The article proposed revisions to National Instrument 58-101 (Disclosure of Governance Practices) to incorporate the disclosure of gender diversity in a proposed “comply or explain” framework. Companies listed on the Toronto Stock Exchange (TSX) would be required to annually disclose policies—or their absence—pertaining to the representation of women on their boards and among executive officers. The OSC indicated that the proposed amendment was intended to bolster board effectiveness and corporate decision-making by requiring greater transparency for investors and other stakeholders regarding the representation of women on boards and in senior management positions of firms listed on the TSX. Notably, rather than compelling companies to diversify their boards and executive suites, the OSC’s proposed changes would drive diversity improvements within corporate leadership through the public disclosure of each firm’s diversity practices.
After the period for initial comments concluded, a revised version of the proposal was published on Jan. 16, 2014. This iteration included an additional requirement to disclose policies regarding director term limits—a feature not present in the original draft. This amendment was implemented on October 15, and the OSC made a declaration on Dec. 11, 2014, that the final amendment would come into force on Dec. 31, 2014.Footnote 9 The final amendment, which has been in place since Dec. 31, 2014, requires TSX-listed and certain other non-venture issuers in Ontario to include the following disclosure annually in their proxy circulars or annual information forms, as applicable:
-
1) whether there are any director term limits or an explanation for the absence of such limits;
-
2) the details of any policies regarding the identification and nomination of women directors or an explanation for the absence of such policies;
-
3) the board’s or nominating committee’s consideration of the representation of women in the director identification and selection process or an explanation for the absence of such consideration;
-
4) the consideration given to the representation of women in executive officer positions when making executive officer appointments or an explanation for the absence of such consideration;
-
5) targets (number or percentage) adopted regarding the representation of women on the board and in executive officer positions or an explanation for the absence of such targets;
-
6) the number and proportion of women on the board and in executive officer positions.
Although the OSC amendment requires disclosure of items 1–6, the amendment is notable in that it does not require—or even recommend—a gender target quota. In fact, the amendment only requires firms to disclose whether they have adopted gender targets. This is in sharp contrast to the quota mandates increasingly implemented in other jurisdictions. The OSC takes a subtler stance by neither recommending a particular gender balance nor compelling firms to establish targets or quotas. Rather, the OSC amendment relies on the power of transparency: the belief that through the open reporting of a firm’s diversity practices, stakeholders and investors are better equipped to assess and influence the diversity profile of corporate boards.
IV. The Conceptual Framework
Before the OSC amendment, firms’ board diversity practices were largely opaque. Gender representation was seldom tracked, standardized information for investors was limited, and expectations around board composition varied widely. The amendment changed this by requiring firms to disclose both their diversity policies—or their reasons for not having them—and numerical data on gender representation and targets. This disclosure regime provides investors with comparable annual data to inform proxy voting and investment decisions, while also shaping norms by elevating board diversity from a peripheral concern to a recognized element of corporate governance.
The OSC amendment may influence firm behavior through several key channels, as follows:
-
1. Disclosure Pressure: The amendment mandates that firms disclose their diversity policies, including whether they consider gender in director nominations. It also mandates firms to disclose whether they set targets for women on the board and requires firms to report board gender representation. The amendment’s public disclosure requirements force firms to internalize and articulate their stance on gender diversity. Even non-compliance must be explained, increasing reputational risk—especially for firms concerned about investor, media, or public perception. The result may be higher costs for firms that maintain inaction or implement only superficial policies.
-
2. Internal Policy Reevaluation: The amendment encourages boards and nominating committees to reexamine internal recruitment pipelines, renewal practices, and selection criteria. By requiring explicit articulation of these processes, the policy compels organizations to evaluate their board nomination procedures, which may uncover unconscious biases or structural barriers. Additionally, enhanced disclosure requirements incentivize firms to formalize their approach to gender diversity in board appointments. Together, these mechanisms may drive substantive changes in nomination practices and, ultimately, board composition.
-
3. Investor Influence: The standardized diversity data required by the OSC amendment reduces information costs, facilitates the identification of laggards, and heightens the reputational risks of inaction. This transparency thus allows investors to evaluate and compare firms based on diversity performance, incorporating these data into ESG analysis, voting, and engagement. Jennifer Coulson, Chair of the 30% Club Canada Investor Group, emphasized that the key impact of the OSC regulation was its role in making board composition data broadly accessible. “It becomes hard to implement [engagements] if we don’t have data [on board gender diversity],” she noted. By enabling investors to track progress on female representation, transparency may thus drive engagement and incentivize firms to strengthen diversity practices as a signal of good governance. Firms with robust diversity disclosures may, in turn, be viewed more favorably by investors, potentially attracting greater investment, benefiting from lower capital costs, or gaining inclusion in ESG indices.
-
4. Peer Benchmarking: With greater visibility into peer practices, firms can benchmark themselves against industry leaders, and institutional investors can better compare diversity practices across firms. As prominent firms adopt robust diversity policies, they help shape evolving norms and expectations, both among other firms and institutional investors, creating pressure on others to follow—even in the absence of regulatory enforcement.
-
5. Shifting Norms: The normalization of diversity metrics and target-setting can gradually reshape perceptions of board composition. Over time, stakeholders—directors, employees, and investors—may come to view gender diversity not as a compliance task but as a fundamental element of corporate responsibility.
In sum, the OSC amendment reshapes the firm-level cost–benefit trade-offs associated with board gender diversity by transforming disclosure into a governance mechanism. Increased transparency raises the expected costs for non-diverse boards through reputational exposure, investor scrutiny, and peer comparison, while enhancing the signaling value of diversity and its alignment with prevailing governance expectations. Importantly, the comply-or-explain structure preserves firm discretion: firms for which adoption costs exceed expected benefits may disclose non-adoption without formal penalty, while firms facing either lower implementation costs or higher reputational and governance-related benefits are incentivized to comply more substantively. Accordingly, the amendment operates through a sequence in which enhanced disclosure enables market-based enforcement mechanisms rather than direct regulatory enforcement. At the same time, because full compliance is an endogenous firm choice rather than a mandated outcome, firms that choose to comply more substantively may differ along both observable and unobservable dimensions from firms that continue to explain non-compliance.
A. Public Reaction to the OSC Proposed Amendment
The public first became aware that the OSC was considering legislation on board gender diversity in July 2013, when the OSC released Staff Consultation Paper 58-401, which proposed “comply or explain” disclosure requirements to encourage greater gender diversity on corporate boards and in senior management. The OSC invited feedback by September 2013 and received 89 comment letters from a wide range of stakeholders, including corporations, advocacy groups, investment firms, professional associations, academics, and individuals (see Table 3). The proposal received broad public support. Overall, 82% of submissions expressed a positive tone, 18% were neutral, and none were negative.Footnote 10 Corporate responses were largely favorable, with 74% in support and 26% neutral. The highest level of support came from advocacy groups, with 95% supporting the proposal and only 5% expressing a neutral stance.

TABLE 3 Long description
The table is divided into two panels. Each panel contains six columns: Entity Type, Total Number of Comment Letters, Percentage Negative, Percentage Neutral, Percentage Positive, and Average Polarity Score.
Panel A. Comment Letters due September 2013:
* Academics and think tanks: 4 letters, 0% negative, 25% neutral, 75% positive, 0.146 polarity.
* Advocacy groups: 22 letters, 0% negative, 5% neutral, 95% positive, 0.147 polarity.
* Government and public bodies: 3 letters, 0% negative, 33% neutral, 67% positive, 0.103 polarity.
* Individuals: 17 letters, 0% negative, 24% neutral, 76% positive, 0.153 polarity.
* Investment firms: 7 letters, 0% negative, 14% neutral, 86% positive, 0.147 polarity.
* Professional associations: 13 letters, 0% negative, 15% neutral, 85% positive, 0.141 polarity.
* Corporations: 23 letters, 0% negative, 26% neutral, 74% positive, 0.133 polarity.
* Total: 89 letters, 0% negative, 18% neutral, 82% positive, 0.142 polarity.
Panel B. Comment Letters due April 2014:
* Academics and think tanks: 1 letter, 0% negative, 0% neutral, 100% positive, 0.107 polarity.
* Advocacy groups: 7 letters, 0% negative, 14% neutral, 86% positive, 0.163 polarity.
* Individuals: 9 letters, 11% negative, 11% neutral, 78% positive, 0.128 polarity.
* Investment firms: 10 letters, 0% negative, 50% neutral, 50% positive, 0.113 polarity.
* Professional associations: 18 letters, 0% negative, 6% neutral, 94% positive, 0.160 polarity.
* Corporations: 7 letters, 0% negative, 43% neutral, 57% positive, 0.088 polarity.
* Total: 52 letters, 2% negative, 21% neutral, 77% positive, 0.135 polarity.
In January 2014, the OSC released a revised proposal, incorporating a single addition: the inclusion of director term limits. Stakeholders were again invited to submit feedback, with a deadline of April 2014. The response remained overwhelmingly positive: 77% had a positive tone about the amendment, with 21% neutral and 2% negative. The consistently strong support across both consultation periods indicated early on that the proposal was likely to proceed to implementation.
Beyond stakeholder comment letters, media coverage of the proposed amendment was also broadly supportive, reflecting and reinforcing the broad public and institutional approval of the initiative. Table 4 presents an analysis of 211 articles published between 2012 and 2016 in three major Canadian news outlets—Globe and Mail, Financial Post, and Toronto Star—that specifically discuss board gender diversity and the OSC’s initiative. Applying sentiment analysis, we classify 62% of the articles as positive in tone, 38% as neutral, and none as negative. Media sentiment was particularly favorable in 2014, the year the revised proposal was released and a second round of comments was invited: 71% of articles that year conveyed a positive tone.Footnote 11 This consistently supportive media environment suggests broad public acceptance of the amendment and reinforces the perception that its implementation was likely.

TABLE 4 Long description
The table consists of six columns: Year, Total Number of News Articles in the Press, Percent of News Articles in the Press Which are Negative, Neutral, or Positive, and Average Polarity Score.
* 2012: 6 total articles; 0 percent negative, 33 percent neutral, 67 percent positive; average polarity score 0.111.
* 2013: 35 total articles; 0 percent negative, 37 percent neutral, 63 percent positive; average polarity score 0.107.
* 2014: 52 total articles; 0 percent negative, 29 percent neutral, 71 percent positive; average polarity score 0.113.
* 2015: 57 total articles; 0 percent negative, 28 percent neutral, 72 percent positive; average polarity score 0.127.
* 2016: 61 total articles; 0 percent negative, 57 percent neutral, 43 percent positive; average polarity score 0.094.
* Total: 211 total articles; 0 percent negative, 38 percent neutral, 62 percent positive; average polarity score 0.110.
B. How Did the Market React to the Policy Announcement?
In this section, we study market reaction to the OSC policy to understand how the principles-based policy was perceived by shareholders.
1. Identifying the Event Date
In studying the market reaction to the OSC amendment, we primarily focus on the policy announcement released on July 30, 2013. Although the Ontario Government publicly announced its intention to consider regulating gender diversity on boards in May 2013, it provided no details, leaving the market uncertain about key issues such as the prescriptiveness of the regulation and whether targets for female directorships would be required. This uncertainty was compounded by the OSC’s shift from a “comply or explain” policy on majority voting for director elections to a mandatory policy in June 2013. This policy shift for majority voting is likely to have contributed to uncertainty over whether the OSC’s board gender diversity regulation would be principles- or rules-based. The July 30 announcement was pivotal as it confirmed that the gender diversity regulation would follow a “comply or explain” format, resolving uncertainty. The final rules adopted on Dec. 31, 2014, were largely consistent with the July 30 consultation article, with the only addition being requirements for director term limits. The July 30 announcement was also covered by the Globe and Mail (a prominent Canadian news outlet), underscoring the significance and interest in the proposed policy.Footnote 12 We conduct an event study around the OSC’s release of its proposed rules on July 30, 2013. We compute CARs around the announcement following standard event study methodology (see, e.g., Campbell, Lo, and MacKinlay (Reference Campbell, Lo and MacKinlay2012)). The data requirements for computing CARs result in a sample of 274 firms.Footnote 13
2. Identifying Firms Most Affected by the OSC Amendment
We posit that firms with all-male boards and those that did not disclose gender diversity policies before the OSC’s July 2013 announcement are likely to be most impacted by the amendment. In contrast, firms that had already disclosed a gender diversity policy or had at least one female director may have been seen as being already compliant with the diversity disclosure requirement and thus less impacted. Using BoardEx, we identify 127 firms with all-male boards in 2013, while the remaining 147 firms had at least one female director. We determine which firms had a voluntary gender diversity policy by reviewing proxy circulars for the 2013 fiscal year. Given the lack of guidelines before the amendment, we classify firms that explicitly state that they have a board gender diversity policy or express a commitment to board gender diversity as having such a policy. In 2013, 61 firms disclose having a gender diversity policy or consider gender diversity in director nominations, while the remaining 213 firms do not.
3. Announcement Returns
Panel A of Table 5 reports the average CARs in the (0,0), (0,+1), and (−1,+1) announcement windows, along with t-statistics and p-values for testing whether the average CARs are statistically different from 0, following Kolari and Pynnönen (Reference Kolari and Pynnönen2010).Footnote 14 While the average CAR during these windows is positive but not statistically significant, firms without a disclosed voluntary female representation policy and those with all-male boards exhibit positive and mostly statistically significant announcement CARs (at the 5% and 1% level, respectively). Specifically, the 2-day (0,+1) CAR is 1.4% for firms without a female director policy and 2.0% for firms with all-male boards.Footnote 15 Other firms do not exhibit significant announcement CARs. Panel B shows that 63% of firms without a female representation policy and 72% of those with all-male boards have positive (−1,+1) CARs, suggesting the results are not driven by outliers. Table 6 presents ordinary least squares (OLS) regressions of the CARs, focusing on the (0,+1) window following MacKinlay (Reference MacKinlay1997).Footnote 16 We include an indicator for firms without a disclosed voluntary female representation policy (models 1 and 2), an indicator for firms with all-male boards (models 3 and 4), and the proportion of male directors on the board (models 5 and 6). All specifications control for total assets and 1-digit SIC industry, with models 2, 4, and 6 also controlling for market-to-book assets, return-on-assets, and debt/assets. The coefficients on our key explanatory variables of interest align with the univariate analysis in Table 5. In models 1 and 2, firms without a disclosed female representation policy have CARs that are 1.2 percentage points higher than those that disclose such a policy. Similarly, in models 3 and 4, firms with all-male boards have CARs that are 1.2 percentage points higher than for those with female directors.Footnote 17

TABLE 5 Long description
Panel A reports Mean C A R for five groups across three time windows: (0,0), (0,+1), and (-1,+1).
1. All Firms (N = 274): Mean C A R ranges from 0.543% to 1.016% with p-values between 0.233 and 0.527.
2. No Female Director Policy in 2013 (N = 213): Mean C A R is 0.786% (p = 0.045) for (0,0) and 1.387% (p = 0.038) for (0,+1).
3. Female Director Policy in 2013 (N = 61): Mean C A R is 0.346% for (0,0) and becomes negative for (0,+1) at -0.277% and (-1,+1) at -0.401%.
4. All-Male Board in 2013 (N = 127): Shows statistically significant positive returns across all windows: 1.115% (p = 0.006), 2.001% (p = 0.003), and 1.290% (p = 0.031).
5. >0 Female Directors in 2013 (N = 147): Mean C A R is 0.319% for (0,0), 0.165% for (0,+1), and -0.103% for (-1,+1).
Panel B reports the Percentage of Firms with Positive C A R s for the (0,+1) window:
* All Firms: 58%
* No Female Director Policy: 63%
* Female Director Policy: 43%
* All-Male Board: 72%
* >0 Female Directors: 47%

TABLE 6 Long description
A regression table with eight columns labeled 1 through 8. The dependent variable is C A R (0, +1).
Key independent variables and their coefficients (standard errors in parentheses):
* No Female Director Policy sub 2013: Model 1 is 0.012** (0.005); Model 2 is 0.013*** (0.005).
* All-Male Board sub 2013: Model 3 is 0.012** (0.005); Model 4 is 0.015*** (0.005); Model 7 is 0.014*** (0.005); Model 8 is 0.014*** (0.005).
* Male Director Ratio sub 2013: Model 5 is 0.055** (0.022); Model 6 is 0.065*** (0.024).
* All-Male Board through 2017: Model 7 is -0.011 (0.008); Model 8 is -0.007 (0.008).
Control variables include Institutional Ownership, Media Coverage, Log(Assets), Market-to-Book Assets, and R O A. All models include Industry fixed effects.
Model Statistics:
* Number of observations: Ranges from 234 to 274.
* Adjusted R-squared: Ranges from 0.078 to 0.127.
Significance levels: *** p < 0.01, ** p < 0.05, * p < 0.10.
Despite the insignificant CARs for firms with some female directors in Table 5, models 5 and 6 of Table 6 show that the CARs are increasing in the proportion of male directors on firms’ boards. Combined with the fact that firms with female directors added more women post-regulation, albeit at a lower rate than firms with all-male boards (see Supplementary Material Figure C.1), these results suggest the following: having female directors at the time of the event announcement may signal a firm’s willingness to add more women to its board, even without regulation. In contrast, all-male boards may be perceived as less likely to do so. This does not imply that the regulation has no effect on firms with female directors, but rather that the behavioral shift expected of them is smaller compared to firms with all-male boards.
The results in Tables 5 and 6 contrast sharply with the negative abnormal returns documented for firms subject to California’s SB-826 law mandating gender diversity, as shown by Hwang, Shivdasani, and Simintzi (Reference Hwang, Shivdasani and Simintzi2020) and Greene, Intintoli, and Kahle (Reference Greene, Intintoli and Kahle2020), though these findings have been challenged by Allen and Wahid (Reference Allen and Wahid2023). One might hypothesize, based on these prior studies, that the positive returns we observe reflect relief that the regulation would not force changes on firms.Footnote 18 If this were true, we would expect the positive abnormal returns to be concentrated among firms that continued to have all-male boards post-regulation. In models 7 and 8, we re-estimate models 3 and 4, adding an indicator for firms with all-male boards in 2013 that still had all-male boards in 2017. The coefficient on this indicator is negative and not statistically significant, contradicting this hypothesis. Coupled with our Section VI findings that the regulation led to an increase in female director representation, these results suggest it is highly unlikely that the positive CARs for firms with all-male boards reflect an expectation that the principles-based regulation would not lead to real change.
A potential concern is that the non-random assignment of firms to treated and control groups (e.g., all-male vs. non-all-male boards) might be correlated with our event returns. We address this issue by using two approaches suggested by Roberts and Whited (Reference Roberts, Whited, Constantinides, Harris and Stulz2013). First, we compare observable characteristics between firms with all-male boards and firms with female directors (see Supplementary Material Table C.2). Both groups have similar proportions of female top-five executives (6.6% vs. 6.8%), confirming that our results in Tables 5 and 6 are related to OSC rules on female directors, but not executives. We find similar patterns when we compare firms with and without a voluntary director gender diversity policy. Second, we conduct a placebo test using 500 “placebo” event dates around the actual event (see Supplementary Material Figure C.2 and Supplementary Material Table C.3). This test shows that the regression coefficients in Table 6 fall far in the right tail of the distribution of the placebo distribution, indicating that results are not driven by persistent differences between treatment and control groups and are unlikely to be due to chance.
In untabulated tests, we do not find statistically significant market reactions to female director nominations. Because standalone announcements of female director appointments are rare, we identify nominations using proxy filing dates; however, proxy statements bundle considerable market-relevant information, making it difficult to isolate the valuation effect of a director nomination. Moreover, many appointments were likely anticipated following the OSC’s proposed ruling and, for some firms, the adoption of female director targets.
4. Interpreting the Market Reaction to the OSC’s Announcement
Given that the Ontario government had already signaled its intent to regulate board and executive gender diversity in May 2013, coupled with a broader societal focus on board diversity (see Supplementary Material Figure C.3), the market likely anticipated some form of regulation before the July 30 announcement. Thus, the July 30 announcement clarified the nature of the regulation rather than its existence. Our event study analysis shows that, amidst uncertainty about the prescriptiveness of the new rules, the market responded positively to the news that compliance would not be prescriptive, instead allowing firms to define and implement their own diversity policies. Given the spectrum of potential regulation, ranging from relatively weaker forms of comply or explain to stringent gender mandates, the OSC’s rules were relatively mild compared to more stringent regulations in other jurisdictions such as Norway and California, with no requirements to increase board gender diversity or to adopt “best practices” guidelines or diversity targets. For example, Nasdaq’s (Fried (Reference Fried2021)) comply-or-explain board diversity rules were more prescriptive in defining compliance as having at least two diverse directors.Footnote 19
When combined with existing evidence of potentially high compliance costs associated with board gender diversity mandates (Ahern and Dittmar (Reference Ahern and Dittmar2012), Greene, Intintoli, and Kahle (Reference Greene, Intintoli and Kahle2020), Hwang, Shivdasani, and Simintzi (Reference Hwang, Shivdasani and Simintzi2020)), our event study results are more consistent with investors perceiving the OSC’s principles-based approach as less costly than a prescriptive mandate, rather than as value-enhancing relative to no regulation at all. The event study evidence, therefore, speaks to investors’ relative valuation of regulatory designs, rather than whether any diversity regulation is welfare-enhancing.
5. Market Reactions to Other Relevant Announcements
In this section, we examine key events preceding the July 30, 2013 announcement (see Table 2 for a timeline): the Canadian government’s Apr. 5, 2013 announcement of a committee to advise the government on board gender diversity; the Ontario budget statement released on May 2, 2013, which expressed support for gender diversity on corporate boards and senior management; remarks by the Ontario’s Minister Responsible for Women’s Issues, Laurel Broten, on May 28, 2013, indicating the province’s cooperation with the OSC on this issue; and a request on June 14, 2013 (not publicly disclosed at the time) by the Minister of Finance, Charles Sousa, and then Minister Responsible for Women’s Issues, Laurel Broten, for the OSC to undertake a public consultation on gender diversity disclosure requirements. We examine the 2-day (0,+1) CARs around these four events and find no statistically significant CARs overall, nor for firms without a disclosed voluntary female representation policy in 2013 or for firms with all-male boards in 2013 (see Supplementary Material Table C.4). This suggests that the events preceding the July 30, 2013 announcement did not significantly reduce uncertainty regarding the OSC’s subsequent diversity regulation.
On Jan. 16, 2014, the OSC added the disclosure of director term limits to the requirements of the proposed regulation, not originally included in the July 30, 2013 consultation article. We do not find statistically significant CARs around this news (see Supplementary Material Table C.4) for all firms in our sample, for firms with all-male boards, for firms without a disclosed voluntary diversity policy, or for firms without a disclosed director term limit policy. Similarly, there are no significant CARs around the final adoption of the new rules by the OSC on Oct. 15, 2014. These findings suggest that subsequent announcements did not provide additional value-relevant information beyond the July 30, 2013 announcement.
Allen and Wahid (Reference Allen and Wahid2023) find that several events leading up to the final adoption of California’s board gender diversity mandate elicited statistically significant market reactions, highlighting the need to evaluate these events collectively. In contrast, the only event in our study with a significant market reaction is the unveiling of the proposed OSC rules on July 30, 2013.
In addition to board gender diversity policies, the OSC amendment on July 30, 2013, also included an executive gender diversity policy (see Section III for details). We analyze the market reaction for firms with all-male top five named executives (i.e., the CEO and the next four executives ranked according to their compensation per firms’ proxy circulars) using univariate and multivariate analyses (see Supplementary Material Tables C.5 and C.6). We do not find statistically significant abnormal returns around any of the release dates mentioned earlier. This aligns with our findings of no statistically significant increase in the prevalence of female top executives (see Section VI.A.3). The results suggest that the market reaction to the July 30th amendment was driven by the board gender diversity provisions rather than the executive gender diversity provisions.
C. Incentives for Firms to Comply Early
The high visibility and favorable framing of the proposed OSC regulation may have prompted firms to adjust their governance practices in advance of formal implementation, particularly for those sensitive to reputational concerns. Consistent with this view, the market reaction results indicate that little new economically material information was released after the July 30, 2013 proposal. Among the major regulatory milestones, only the July 30, 2013 proposal generates statistically and economically significant abnormal returns, while we observe no significant reaction to the Jan. 16, 2014 revision or the Oct. 15, 2014 formal adoption (see Section IV.B.5 and Supplementary Material Table C.4). This pattern suggests that the informational content of the amendment was largely incorporated at the initial proposal, consistent with firms beginning anticipatory adjustments prior to formal implementation.
By adopting governance changes in anticipation of the proposed amendment, firms could influence the evolution of emerging best practices, signal readiness for regulatory change, and mitigate the risks associated with a last-minute compliance rush. Some firms may have also aimed to influence the final form of the regulation by demonstrating the practical feasibility of disclosure-based requirements, thereby positioning voluntary compliance as a credible alternative to more prescriptive interventions, such as mandatory quotas. This concern was salient in the policy debate: several comment letters expressed concerns that the proposed amendment might be insufficient and suggested that quotas could be necessary to achieve more meaningful progress. By taking early action and nominating female directors during the spring 2014 proxy season, firms also positioned themselves to secure qualified female candidates ahead of anticipated competition following the rule’s formal adoption.
V. Evolution of Compliance: How Does Disclosure Change Over Time?
The adoption of the OSC’s disclosure-based framework did not produce uniform responses across firms. While some issuers embraced comprehensive diversity practices, others limited their disclosures to the minimum required or resisted setting measurable goals altogether. This section examines how firms responded to the amendment, traces changes in disclosure practices over time, categorizes firms by their level of compliance, and analyzes the conditions under which companies shifted from minimal disclosure toward more robust commitments to board gender diversity.
A. Assessing Compliance with the OSC Amendment
To analyze firms’ choices of whether to comply or explain with disclosures on board diversity, we manually collect data from annual proxy statements for 2011–2018 of firms’ disclosed policies regarding female board representation. For each firm, we record whether it has a diversity policy (item 2), whether it considers women in the director identification or selection process (item 3), and whether it has implemented a target for the number or percentage of women directors (item 5). We categorize firms into three distinct groups based on their adherence to these three aspects of the OSC amendment (see Panel A of Table 1).
Full Compliers meet all three key provisions—they disclose a gender diversity policy for board nominations (item 2), consider the representation of women in the director identification and selection process (item 3), and set formal targets for the representation of women on the board (item 5). These firms show the highest level of engagement with the regulation, complying with all provisions regarding board diversity.
Partial Compliers satisfy items 2 and 3 but do not adopt a formal target. These firms indicate that they take gender into account in the director identification and selection process, acknowledging gender diversity as a factor in board appointments. However, they stop short of setting quantitative benchmarks or targets.
Explainers fulfill the minimum level of compliance. They disclose a gender diversity policy but do not adopt a formal target, nor do they consider the representation of women in the director identification and selection process. Their disclosures offer explanations for non-adoption rather than demonstrating active integration of gender diversity into governance practices.
B. Incentives for Compliance Choice
Full compliance, particularly when firms adopt more ambitious female director targets, sends a stronger signal to investors, analysts, and regulators that the firm is genuinely committed to gender diversity. This can enhance its attractiveness to long-term institutional investors and strengthen public messaging around diversity leadership. However, full compliance requires a strong internal commitment and may require structural changes. We posit that full compliers are more likely to be larger firms with lower relative compliance costs and firms with greater access to qualified female directors.
Partial compliance enables firms to signal a commitment to good governance and avoid the perception of inaction without adopting quantitative targets that might constrain board decisions. For these firms, such targets may be seen as overly prescriptive or may generate internal tensions, including concerns about tokenism or challenges to merit-based selection. In some cases, partial compliance may also reflect a desire to align with peers that have not yet widely adopted gender targets.
Explainers may emphasize managerial discretion in board appointments, signaling a strategic resistance to external accountability mechanisms and prevailing normative expectations regarding board composition. For these firms, disclosing formal diversity policies may risk exposing a lack of progress or creating unwanted future accountability. In contrast, offering explanations enables them to retain control over the narrative without making binding commitments. Among smaller firms, tracking and reporting on board gender representation may be perceived as administratively burdensome. In contexts where investor scrutiny is minimal, the firm operates within male-dominated industries, or public visibility is low, the incentives to comply with diversity expectations are significantly reduced. Moreover, explainers may face greater frictions in appointing female directors—for example, due to fewer network connections to female candidates, a limited local pool of potential female directors, or higher recruitment costs. Under these conditions, the perceived benefits of aligning with normative standards may be outweighed by the costs. Moreover, some firms may view diversity initiatives as externally imposed, politically motivated, or fundamentally misaligned with their corporate identity and values.
C. Levels of Compliance
Panel B of Table 1 illustrates the evolution in compliance with the OSC’s board diversity disclosure requirements. Prior to the OSC’s initial public call for commentary on board diversity in July 2013, only about 12% of firms disclosed a diversity policy. However, in the wake of the OSC announcement, there was a notable upswing, with 23% of firms reporting the existence of a diversity policy by the end of 2013, sharply increasing to 95% by 2014. Compliance became nearly universal after the official effective date of the amendment at the end of 2014, with all but two firms disclosing a diversity policy. By 2017, all firms disclosed a diversity policy, with compliance of item 2 at 100%. Notably, though all firms disclosed a diversity policy, not all firms embraced board diversity. While some show a clear commitment to board gender diversity in their diversity policies, others are vocal in their reluctance to consider gender in board appointments, stating that they give precedence to the role of skills and experience in selecting board members. Such firms often maintain that they make board appointments based on merit without considering gender or racial attributes.
The trend for firms disclosing their consideration of women in the director identification or selection process (item 3) displays a similar upward trajectory over the sample period. Prior to the OSC’s announcement, only about 11% of companies took gender into account when identifying or selecting directors. Following the 2013 announcement, this figure rose to 21%, indicating a growing awareness and response to the upcoming implementation of the amendment. With the OSC’s policy implementation in 2014, compliance increased significantly to 89%. This high level of compliance persists through the end of the sample period, with 93% of firms disclosing their consideration of gender in the director identification or selection process in 2018.
Item 5 calls for companies to disclose whether they have set targets for female board representation. As shown in Panel C of Table 1, it was rare for firms to have gender targets in place before 2014. However, coinciding with and following the amendment’s introduction in 2014, target adoption rose from eight firms in 2013 to 40 firms in 2014, to 77 firms by 2017, and to 102 firms (41% of all firms) by 2018. This indicates a notable escalation in the embrace of quantifiable goals for the inclusion of women on corporate boards.
While the amendment did not mandate the form of these targets, whether as a percentage or a specific number, most firms that implement a target utilize a percentage. Common benchmarks include female director targets of 25%, 30%, and 33%. Over the entire sample period, the mean target among firms adopting targets is 28.9%, while the median target is 30%, with targets ranging from 12.5% to 50%. Panel C of Table 1 reports the evolution of the female director targets adopted by Full Compliers. As indicated by the mode, the most common target used before 2014 was 25%, while the most common target utilized after the amendment’s introduction is 30%. The average target is just under 29% each year since 2014, with the median at 30% since 2014. Notably, firms rarely scale back existing targets once adopted, suggesting that target adoption reflects persistent rather than symbolic commitments to board gender diversity.Footnote 20
The targets adopted by Canadian firms under the OSC’s principles-based framework differ from the quota structures implemented in several other jurisdictions. Norway requires that at least 40% of board members be of each gender, while the European Union adopted a 40% quota for women on corporate boards set to take effect in mid-2026. California’s now-invalidated SB 826 mandate similarly imposed minimum numerical requirements based on board size, requiring two female directors for five-member boards and three female directors for boards with six or more directors. While the voluntarily adopted targets in our sample are on average somewhat lower than the quotas imposed under mandatory regimes, they nevertheless represent meaningful commitments to increasing female board representation. More broadly, the variation in targets under the OSC framework is consistent with the idea that a principles-based regime allows firms flexibility in determining target levels rather than converging toward a single mandated threshold.
Among Partial Compliers and Explainers that do not employ targets, 75% offer a rationale. The most frequently cited reasons are as follows:
-
• Appointments are based on merit/Skills and experience are most important (63.2%).
-
• Targets are not necessary or advisable/Targets are arbitrary (10.3%).
-
• We are too small for a diversity policy or to consider targets (3.5%).
-
• Targets are not an appropriate method to increase diversity (2.6%).
-
• Targets do not result in identifying or selecting the best candidate (2.5%).
-
• Infrequent turnover makes targets impractical (1.0%).
Figure 1 shows the proportions of firms that fall into one of the three compliance categories. The solid line illustrates the full sample, with the long-dashed line representing firms with female directors in 2013, and the short-dashed line representing firms with all-male boards in 2013. Graph A shows the proportion of firms with a gender diversity policy (item 2). Graph B indicates a significant surge in the proportion of firms classified as Partial Compliers around the amendment, from 19% in 2013 to 74% in 2014. Firms with all-male boards in 2013 are more likely than firms with a female director in 2013 to fall into the Partial Complier category after the OSC amendment. However, the percentage of Partial Compliers diminishes for both groups after 2014 as firms advance to full compliance status. Indeed, over the sample period, Panel C shows a notable increase in Full Compliers: with just 6% in 2014, this figure rises to 30% by 2017 and then to 41% in 2018. Notably, the proportion of Full Compliers increases more substantially for firms that had all-male boards in 2013, exhibiting a ninefold increase from 2014 to 2018, compared to a twofold increase for firms that had at least one female director in 2013.
Figure 1 presents data on Gender Diversity Policy for Canadian firms included in the S&P TSX Composite Index, with directorship data in BoardEx and financial data in Compustat, over the 2011–2018 period. The sample is split by whether the firm had female directors in 2013. Graph A plots the average fraction of firms with a gender diversity policy each year (complying with item 2 in OSC’s regulation). Graph B plots the average fraction of Partial Compliers—firms that consider gender diversity in their director nomination process but do not disclose a targeted number of women directors (complying with items 2 and 3 but not 5 in OSC’s regulation). Graph C plots the average fraction of Full Compliers—firms that consider gender diversity in their director nomination process and disclose a targeted number of women directors each year (complying with items 2, 3, and 5 of OSC’s regulation). Graph D plots the average fraction of Explainers—firms that comply with 2 by disclosing a gender diversity policy but do not comply with 3 and 5. The solid lines represent the full sample, the short dashed line represents firms with all-male boards in 2013, and the long dashed lines represent firms with at least one female director in 2013.

FIGURE 1 Long description
A four-panel line graph set. Each graph shares a horizontal x-axis representing years from 2010 to 2018. The vertical y-axis represents percentages. Three data series are present in each: a solid line with squares for the Full Sample, a short dashed line with circles for All-Male Board in 2013, and a long dashed line with triangles for firms with greater than 0 Female Directors in 2013.
* Graph A, Percent with a Gender Diversity Policy (Item 2): The y-axis ranges from 0 to 100 percent. All three lines remain below 20 percent until 2013, then show a sharp vertical increase to nearly 100 percent by 2014, plateauing through 2018.
* Graph B, Percent with Partial Compliance (Items 2 and 3): The y-axis ranges from 0 to 100 percent. Lines show a sharp spike from under 20 percent in 2013 to approximately 70 to 80 percent in 2014, followed by a steady decline toward 50 to 60 percent by 2018.
* Graph C, Percent with Full Compliance (Items 2, 3, and 5): The y-axis ranges from 0 to 50 percent. All lines are near 0 until 2013. From 2014 to 2018, there is a steady linear increase. The triangles (firms with female directors) lead, reaching nearly 50 percent, while circles (all-male boards) lag, reaching approximately 30 percent.
* Graph D, Percent with Explanation (Item 2, but not 3 or 5): The y-axis ranges from 0 to 50 percent. Trends remain low, peaking around 2016. The all-male board group (circles) shows the highest rate of explanation at approximately 15 percent, while the group with female directors (triangles) remains the lowest, near 5 percent.
Graph D shows that the proportion of Explainers, firms with only a diversity policy (item 2), increases from 6% in 2014 to 8% between 2015 and 2017, then declines to 7% by 2018. After adopting a diversity policy, many firms begin to add items 3 and 5 (considering women in the director identification or selection process and setting targets for female board representation), moving from Explainers to Partial or Full Compliers. This progression underscores a shift toward increased adoption of structured gender diversity policies in board governance over time, even among firms that initially had no women directors. We find similar trends toward more supportive language regarding board gender diversity used in the proxy statements post-amendment (see Supplementary Material Table C.7 and Supplementary Material Figure C.4).
1. Multivariate Analyses of Determinants of Compliance
We next study cross-sectional differences that explain varying levels of compliance with the OSC amendment. We posit that firms facing greater frictions in identifying and appointing female directors are less likely to adopt more female-friendly diversity policies. We measure these frictions using two proxies capturing a firm’s access to female directors: i) the number of female directors on corporate boards for all firms within 100 km of the firm’s headquarters that are from the same 1-digit SIC industry, and ii) the average number of interlocks between the board’s directors and female directors on other firms’ boards. We expect higher values for both proxies to predict a greater likelihood of adopting more friendly gender diversity policies post-amendment.
Building on the idea that a firm’s culture can be influenced by its connections with other firms, we posit that firms with directors who are interlocked with directors of other firms that have already implemented board diversity practices will be more likely to adopt such practices themselves. Specifically, we use the following network variables to measure the influence of director networks on board diversity policy: i) the number of board interlocks with directors at firms that consider gender diversity in board nominations, and ii) the number of board interlocks with directors at firms with female director targets.
Finally, we posit that firms whose management is insulated from market pressures are more likely to eschew board diversity practices, opting to explain rather than comply. To capture whether management is shielded from market pressures, we consider whether the firm is a controlled corporation, measured by dual-class voting shares or closely held shares exceeding 30% of shares outstanding, and we also control for board independence. In the same vein, we posit that firms with greater media coverage are more likely to comply, as they are likely subject to more external scrutiny. We measure media coverage by the number of times a firm is cited in the Financial Times, Financial Post, and Toronto Star during the year. Additionally, we control for board characteristics such as size; average age and tenure of directors; average degree centrality of a board’s directors based on the number of other directorships ever held; and firm characteristics such as total assets, market-to-book assets, return-on-assets, institutional ownership, and debt/assets. All specifications include year and 1-digit SIC industry fixed effects. When constructing industry fixed effects, we use a 1-digit SIC classification rather than a finer 2-digit classification because, although Canada has the same industries as the U.S., finer categories often contain few firms, leading to sparse counts.
We report the results of linear probability regressions in Table 7.Footnote 21 Model 1 examines the determinants of full compliance for the entire sample, with the dependent variable indicating whether the firm is a Full Complier (i.e., complies with items 2, 3, and 5). Thus, model 1 compares Full Compliers with the remainder of the sample (Partial Compliers and Explainers). The results show that firms headquartered in regions with a higher concentration of local female directors within the same 1-digit SIC industry are significantly more likely to fully comply.Footnote 22 Similarly, firms with more board interlocks to companies that have female directors or to Full Compliers are also more likely to fully comply. In addition, greater media coverage is associated with a higher likelihood of full compliance, while firms with concentrated ownership structures (i.e., controlled corporations) are significantly less likely to fully comply.

TABLE 7 Long description
A regression table with four columns representing different models.
Header Information:
* Column 1: Dependent Variable is Full Compliance; Sample is Full Compliers vs. Partial Compliers and Explainers.
* Column 2: Dependent Variable is Full Compliance; Sample is Full Compliers vs. Partial Compliers.
* Column 3: Dependent Variable is Partial Compliance; Sample is Partial Compliers vs. Explainers.
* Column 4: Dependent Variable is Target Magnitude percentage; Sample is Full Compliance.
Key Regression Coefficients (Standard Errors in parentheses):
* No. of Local Female Industry Directors: 0.003* (0.001) in Model 1; 0.002* (0.001) in Model 2.
* Interlock with Female Directors: 0.039** (0.019) in Model 1; 0.046** (0.022) in Model 2.
* Interlock with Full Compliance: 0.606*** (0.113) in Model 1; 0.645*** (0.115) in Model 2.
* Controlled Corporation: -0.118*** (0.041) in Model 1; -0.112** (0.043) in Model 2.
* Institutional Ownership: 0.0006** (0.0003) in Model 4.
* Media Coverage: 0.062*** (0.020) in Model 1; 0.061*** (0.020) in Model 2.
Summary Statistics:
* Other firm controls, Year fixed effects, and Industry fixed effects are included (Yes) for all models.
* Number of observations: 1,269 (Model 1), 1,151 (Model 2), 959 (Model 3), 309 (Model 4).
* Adjusted R-squared: 0.309 (Model 1), 0.310 (Model 2), 0.074 (Model 3), 0.317 (Model 4).
The economic significance of these effects is substantial. A 1-standard-deviation increase in the number of female directors in the same industry and geographic area raises the probability of full compliance by 5.9 percentage points. Given that only 25% of firms in the sample are Full Compliers, this translates to a 23.4% increase relative to the baseline compliance rate, highlighting the importance of local access to qualified female directors. Similarly, a 1-standard-deviation increase in board interlocks with female directors is associated with a 5.9 percentage point increase in the likelihood of full compliance, a 23.4% relative increase. Connections appear especially influential: firms with more interlocks to other fully compliant firms see an 11.3 percentage point higher probability of full compliance, a 45% increase over the baseline. In contrast, controlled corporations are 11.8 percentage points less likely to fully comply. This suggests that agency concerns or resistance to external pressure may play a role in discouraging adoption of comprehensive diversity practices.
Model 2 examines the determinants of full compliance by comparing Full Compliers with Partial Compliers, excluding Explainers. The results closely mirror those in model 1, which compares Full Compliers to both Partial Compliers and Explainers, suggesting that Partial Compliers and Explainers behave similarly along observable dimensions. To further explore this, model 3 focuses specifically on distinguishing Partial Compliers from Explainers—the two groups that do not adopt female director targets. Model 3 shows limited explanatory power (Adjusted R 2 = 0.074), and none of the predictors are statistically significant. This likely reflects the narrow behavioral distinction between these two groups. Variables that effectively explain full compliance—such as board interlocks, proximity to potential female directors, connections to full compliers, or media attention—do not meaningfully differentiate firms that opt out of targets. The choice to partially comply versus explain may instead be shaped by unobserved or qualitative factors, such as disclosure preferences or organizational culture. Alternatively, this is consistent with the notion that partial compliance is essentially similar to explaining from a cost perspective: access to female director proxies or governance mechanisms does not predict whether a firm partially complies versus provides an explanation for non-compliance. In other words, partial compliance does not appear to be systematically driven by these observable determinants, in sharp contrast to full compliance.
More broadly, the results suggest that firms’ responses to the OSC amendment are heterogeneous rather than uniformly substantive. While some firms appear to embrace the spirit of the amendment through more comprehensive diversity disclosures and policies, some firms may instead respond in a more symbolic manner by limiting compliance to disclosures that avoid measurable commitments. The observational similarity between Partial Compliers and Explainers is consistent with this interpretation.
Model 4 examines the determinants of the magnitude of self-adopted female director targets, restricting the sample to firms that fully comply (i.e., those that set a target). In this specification, the dependent variable is continuous, capturing cross-sectional variation in the level of the target rather than the decision to adopt one. The results indicate that the observable factors that strongly predict the adoption of targets in models 1 and 2—such as director supply, board interlocks, and exposure to other compliant firms—do not explain variation in the size of the targets once a firm chooses to set one. Most coefficients are small and statistically insignificant, with the exception of institutional ownership, which is positive and significant, suggesting that firms with greater institutional ownership adopt marginally higher targets. Overall, the findings imply that while network connections, local supply of female directors, and external visibility are important for the extensive margin (whether to adopt a target), they do not meaningfully shape the intensive margin (how ambitious the target is). This pattern suggests that the level of self-adopted targets is likely influenced by pressure from institutional investors and other unobserved factors, rather than the observable governance and network characteristics considered here.
Overall, the results in Table 7 suggest that access-related frictions and external visibility significantly influence firms’ compliance with the OSC’s gender diversity amendment. Firms are more likely to fully comply when they are located near a larger pool of qualified female directors and when their directors are connected to female directors or to peers at other fully compliant firms, highlighting the importance of local access and network ties.Footnote 23 In addition, firms with greater media coverage are significantly more likely to fully comply, suggesting that public scrutiny may serve as a reputational incentive for adopting stronger gender diversity policies. Conversely, controlled corporations, which typically face weaker market and governance pressures, are less likely to fully comply, indicating that ownership structure may dampen responsiveness to regulatory and social expectations.
VI. The Effects of the Policy: Did Canadian Firms Add Women to Their Boards?
Unlike mandates that enforce increased diversity, it is uncertain whether the OSC’s principles-based approach will have a meaningful effect on board diversity. On the one hand, by requiring firms to disclose their compliance or explain non-compliance, the OSC amendment enables capital markets to evaluate the effectiveness of a firm’s diversity policies, potentially increasing stakeholder pressure to improve board diversity.Footnote 24 On the other hand, the amendment may be too weak to increase the presence of women on corporate boards, as it permits firms to choose whether to comply with the disclosure requirements. Ultimately, the onus is on investors to judge the adequacy of a firm’s policies on social issues like female representation in the boardroom (see, e.g., Hart and Zingales (Reference Hart and Zingales2017)). In this section, we assess the impact of the OSC amendment on board gender diversity by analyzing changes in the gender composition of Canadian boards before and after the amendment’s introduction. Our sample consists of Canadian-listed firms in the S&P TSX Composite Index at any point during our sample period, with directorship data in BoardEx and financial data in Compustat, resulting in 296 unique firms.
A. Changes in Board Composition
During the 3 years prior to the OSC amendment (2011–2013), only 20% of firms appointed a female director. In contrast, more than half of all firms (51%) appointed a female director in the 3 years after the amendment (2015–2018). The response was particularly strong among firms with all-male boards in 2013: ~59% added a female director within 4 years post-amendment, compared to 48% of firms that already had at least one female director in 2013 (see Supplementary Material Figure C.1).
These data demonstrate that Canadian firms increasingly added women to the boards post-amendment. However, it remains unclear whether this increase is directly attributable to the OSC amendment or part of a broader trend. To address this, Figure 2 shows the annual trend in the average proportion of female directors on Canadian boards from 2011 to 2018, compared with various samples of U.S. firms as controls. For Canadian-listed firms, the solid line in Graph A reveals a noticeable kink—a steepening of the upward trend—after 2013, suggesting that the amendment prompted firms to accelerate the appointment of female directors, raising the average rate at which women are added to boards. This increased rate persists for the remainder of our sample period. For comparison, Graph A also tracks U.S. firms in the S&P 500 index at any point between 2010 and 2016. The U.S. firms, which are not subject to any such regulation during our sample period, do not exhibit the same trend after 2014, reassuring us that this phenomenon is unique to Canadian firms and is thus plausibly a consequence of the OSC’s amendment.
Figure 2 presents data on female directorships for Canadian firms included in the S&P TSX Composite Index and a comparison group of U.S. firms, with directorship data in BoardEx and financial data in Compustat, over the 2011–2018 period. The graphs plot the average fraction of firms’ boards consisting of female directors each year. Graph A reports data for Canadian firms and U.S. firms that were included in the S&P 500 index. Graph B reports data for Canadian firms and a matched sample of U.S. firms, each selected from within the same 3-digit SIC industry and closest in total assets to the corresponding Canadian firm in 2013 (only Canadian firms with a match available are included). Graph C reports data for Canadian firms that are cross-listed on a U.S. stock exchange and a matched sample of U.S. firms, each selected from within the same 3-digit SIC industry and closest in total assets to the corresponding Canadian firm in 2013 (only Canadian firms with a match available are included).

FIGURE 2 Long description
A multi-panel figure containing three line graphs labeled A, B, and C. All graphs share a common Y-axis titled Average Female Director Ratio ranging from 0 percent to 30 percent in 5 percent increments, and an X-axis titled Year ranging from 2011 to 2018. A legend below each graph identifies a solid line for Canada and a dashed line for the U.S.
* Graph A. Comparison of Canadian S P T S X Firms and U.S. S P 500. The U.S. dashed line starts at approximately 16 percent in 2011 and rises steadily to 25 percent in 2018. The Canadian solid line starts lower at 9 percent, remains relatively flat until 2013, then rises sharply to 22 percent by 2018, narrowing the gap with the U.S.
* Graph B. Comparison of Canadian S P T S X and U.S. Matched Firms. The Canadian solid line is identical to Graph A, starting at 9 percent and rising to 22 percent. The U.S. dashed line for matched firms starts lower at 7 percent and rises more slowly to 14 percent in 2018, showing Canada significantly outperforming the matched U.S. sample.
* Graph C. Comparison of Canadian S P T S X A D Rs and U.S. Matched Firms. The Canadian solid line represents cross-listed firms, starting at 10 percent in 2011 and rising to 21 percent in 2017. The U.S. dashed line starts at 6 percent and rises to 13 percent in 2017. Similar to Graph B, the Canadian ratio remains consistently higher than the U.S. matched sample throughout the period.
In Graph B, we compare Canadian firms to U.S. firms matched on total assets and 3-digit SIC industry.Footnote 25 U.S. firms are geographically proximate and more closely linked to Canadian firms in terms of board connections, culture, and business relationships relative to firms in other countries and thus present a plausible control group. Prior to the amendment, the average female director ratio moves in parallel fashion for both groups, but after the OSC amendment, an upward kink appears for the Canadian sample. In Graph C, we compare Canadian firms cross-listed on a U.S. stock exchange (and thus subject to both Canadian and U.S. exchange regulations) to matched U.S. firms (subject only to U.S. regulations). Despite being governed by U.S. SEC regulations, cross-listed Canadian firms display an upward kink and an increased trajectory post-amendment, a pattern not observed in their U.S.-based counterparts. These findings further support the conclusion that the kink in the female director ratio on Canadian boards is driven by the OSC amendment.
Next, we compare pre-treatment firm characteristics of the treated and control firms used in the analyses in Graph B (full sample) and C (Canadian cross-listed firms) to make sure that the two groups are similar prior to OSC’s rule. As shown in Supplementary Material Table C.9, the Canadian treated and matched U.S. control groups are similar, as we find only a couple of statistically significant differences between the means of observable characteristics of the two groups (return on assets (ROA) and institutional ownership are higher for the matched U.S. control group). Prior literature suggests that higher institutional ownership may lead to increases in board gender diversity, but we observe higher institutional ownership in the U.S. matched control firms, suggesting that differences in institutional ownership are unlikely to explain our findings. Importantly, the two groups are similar in female director ratio and the rate of change in this ratio, suggesting parallel trends in the outcome variable prior to the amendment. The overall similarity in observable firm characteristics is reassuring because it makes it less likely that unobserved differences between the groups are driving our results.
The regressions in Table 8 confirm the statistical significance of the patterns shown in Figure 2. The unit of observation is firm-year, with the dependent variable being the proportion of a firm’s board consisting of female directors. The sample period is 2011–2018. Control variables include the level of compliance in the prior year, institutional ownership, media coverage, total assets, market-to-book assets, return-on-assets, and debt/assets. All specifications include firm fixed effects and focus exclusively on Canadian-listed firms. In model 1, the coefficient on the post-2014 indicator is significantly positive, indicating that the representation of female directors increased by about 7.4 percentage points, on average, following the 2014 OSC amendment.

TABLE 8 Long description
The table presents the Female Director Ratio as the dependent variable across three O L S regression models.
Independent Variables and Coefficients:
* Post-2014: Model 1 is 0.074 triple asterisk (0.004); Model 2 is 0.047 triple asterisk (0.007).
* Partial Compliance sub t minus 1: Model 2 is 0.028 triple asterisk (0.008); Model 3 is 0.020 double asterisk (0.008).
* Full Compliance sub t minus 1: Model 2 is 0.061 triple asterisk (0.012); Model 3 is 0.038 triple asterisk (0.013).
* Institutional Ownership: Model 2 is 0.021 (0.023); Model 3 is 0.030 (0.021).
* Media Coverage: Model 2 is minus 0.001 (0.022); Model 3 is minus 0.002 (0.041).
* Log Assets: Model 1 is 0.017 double asterisk (0.007); Model 2 is 0.014 double asterisk (0.007); Model 3 is 0.0001 (0.007).
* Market-to-Book Assets: Model 1 is 0.0005 (0.002); Model 2 is 0.0001 (0.0001); Model 3 is 0.0002 (0.0005).
* Return-on-Assets: Model 1 is 0.009 (0.006); Model 2 is 0.009 (0.006); Model 3 is 0.006 (0.004).
* Debt/Assets: Model 1 is 0.034 double asterisk (0.012); Model 2 is 0.033 double asterisk (0.013); Model 3 is 0.012 (0.015).
* Constant: Model 1 is minus 0.042 (0.055); Model 2 is minus 0.030 (0.58); Model 3 is minus 0.008 (0.062).
Fixed Effects and Statistics:
* Year fixed effects: No for Models 1 and 2; Yes for Model 3.
* Firm fixed effects: Yes for all models.
* Number of observations: Model 1 is 2,254; Models 2 and 3 are 2,030.
* Adjusted R-squared: Model 1 is 0.747; Model 2 is 0.767; Model 3 is 0.798.
Statistical significance is indicated by triple asterisk for 1 percent, double asterisk for 5 percent, and single asterisk for 10 percent levels.
In model 2, we include independent variables for partial and full compliance and find that the post-2014 indicator remains statistically significant, though the magnitude of the effect is slightly reduced compared to model 1. Model 2 shows that partial compliance is associated with a 2.8 percentage point increase in the female director ratio the following year,Footnote 26 while full compliance, which includes disclosing a director gender diversity target, is associated with a 6.1 percentage point increase. Given that female directors accounted for an average of 10% of directors in Canadian firms before the amendment, these results imply that partial compliance leads to a 28% increase in female director representation, with full compliance leading to a 61% increase. In model 3, these findings remain statistically significant when we replace the post-2014 indicator variable with year dummies.
1. DiD with U.S. Control Sample
The increase in board gender diversity observed in the previous section may reflect a broader positive trend in female representation rather than a direct response to the OSC amendment. To better isolate the effect of the OSC amendment, we employ a DiD approach in Table 9.Footnote 27 In model 1, we compare Canadian firms with all U.S. listed firms in the S&P 500 index (similar to Graph A of Figure 2). The coefficient on “Canadian Firm×Post-2014” in model 1 suggests that following the amendment, Canadian firms increased female director representation by about 3.3 percentage points more, on average, than U.S. firms during the same period. In model 2, we match U.S. firms to Canadian firms based on total assets and 3-digit SIC industry, and in model 3, we match Canadian firms cross-listed on a U.S. exchange with firms listed only in the U.S. In both cases, we find a similar relative increase in female director representation for Canadian firms (4.3 and 3.8 percentage points, respectively). Since female directors accounted for an average of 10% of directors in Canadian firms before 2014, the coefficients imply that the OSC amendment is associated with a 38%–43% increase in female director representation.

TABLE 9 Long description
The table presents O L S regression results for the Female Director Ratio across three sample models.
Header Information:
* Model 1: Canada and U. S. S & P 500 Index.
* Model 2: Canada and U. S. Matched.
* Model 3: Canada A D R and U. S. Matched.
Regression Coefficients (Standard Errors in parentheses):
* Canadian Firm times Post-2014: Model 1 is 0.033*** (0.006); Model 2 is 0.043*** (0.008); Model 3 is 0.038*** (0.011).
* Institutional Ownership: Model 1 is 0.031** (0.013); Model 2 is 0.048*** (0.016); Model 3 is 0.026 (0.022).
* Log Assets: Model 1 is 0.002 (0.005); Model 2 is 0.006 (0.002); Model 3 is 0.008 (0.008).
* Market-to-Book Assets: Model 1 is 0.001 (0.002); Model 2 is 0.003** (0.001); Model 3 is 0.002 (0.001).
* Return-on-Assets: Model 1 is 0.001** (0.001); Model 2 is 0.000 (0.001); Model 3 is 0.002 (0.004).
* Debt/Assets: Model 1 is 0.002 (0.011); Model 2 is 0.034** (0.016); Model 3 is 0.097*** (0.031).
* Constant: Model 1 is 0.033*** (0.006); Model 2 is 0.020 (0.050); Model 3 is 0.013 (0.067).
Model Statistics:
* Year and Firm fixed effects are included (Yes) for all models.
* Number of observations: Model 1 is 5,819; Model 2 is 2,787; Model 3 is 1,071.
* Adjusted R-squared: Model 1 is 0.756; Model 2 is 0.802; Model 3 is 0.828.
Statistical significance levels: *** 1 percent, ** 5 percent, * 10 percent.
2. Societal Trends
Are the observed changes in board gender diversity attributable to the OSC amendment, or could they be attributable to other contemporaneous trends? For example, societal trends that led to the OSC regulation may have also influenced institutional investors’ attitudes toward board diversity. Consistent with this conjecture, studies such as Giannetti and Wang (Reference Giannetti and Wang2023) show that U.S. firms are more likely to appoint women to their boards during periods of heightened public attention to gender equality. For societal trends to explain the increase in female board representation, these trends would need to affect our treatment group (Canadian firms) differently from our control group (matched U.S. firms). To better assess this, we construct a measure of societal trends using Google Search Trends to construct an index of public attention to gender diversity.Footnote 28
We argue that Search Volume Indices (SVI) are a strong indicator of societal trends for several reasons. First, as Da, Engelberg, and Gao (Reference Da, Engelberg and Gao2011) argue, SVIs capture millions of users’ collective interest in an issue better than news coverage. Second, SVIs have proven useful in various contexts. For example, Google searches accurately estimate influenza epidemics across different countries (Ginsberg, Mohebbi, Patel, Brammer, Smolinski, and Brilliant (Reference Ginsberg, Mohebbi, Patel, Brammer, Smolinski and Brilliant2009)) and can forecast useful economic indicators like home sales and automotive sales, etc. (Choi and Varian (Reference Choi and Varian2012)). Additionally, Google searches for specific firms are reliable proxies for investors’ demand for information about them (Drake, Roulstone, and Thornock (Reference Drake, Roulstone and Thornock2015)). Finally, directly related to our purpose, Giannetti and Wang (Reference Giannetti and Wang2023) use SVI data to measure public attention to gender equality and show that firms are more likely to appoint women directors during periods of heightened public focus on gender issues.
We plot the 12-month moving average of the monthly Google SVI for the term “Gender Diversity” from January 2011 to December 2018 in Canada and the U.S. (see Supplementary Material Figure C.3). Public attention to gender diversity rises sharply in the latter part of our sample, with a similar pattern in both countries. The correlation between the SVI time series for the U.S. and Canada is 0.91, indicating that societal attention to gender diversity was highly correlated between the two countries during this period. This high correlation suggests that both the U.S. control firms and Canadian treated firms in our study are subject to similar societal trends, which the DiD specification differences out, isolating the impact of the OSC regulation from contemporaneous shifts in attitudes toward board diversity. Combined with the market reaction and the rapid adoption of diversity policies in 2014, this evidence indicates that firms responded to the OSC’s July 2013 proposal rather than a continuation of pre-existing trends.
3. Changes Within the Canadian Sample
To ensure that our results are not an artifact of our choice to use U.S. firms as control groups, we next examine changes in the female director ratio within Canada alone. Specifically, we focus on the trajectory of female director ratios of Canadian firms as shown in Figure 2, where there is a visible kink in 2014 when the new OSC rules were passed, indicating an increased rate of change in female director ratios post-regulation. To verify the statistical significance of this kink, we examine the year-on-year change in the female director ratios of Canadian firms over the 2011–2018 sample period by estimating the following regression specification:

Observations are at the firm-year level, with i indexing firms and t indexing calendar years. The dependent variable is the percentage point change in the proportion of a firm’s board consisting of female directors between the current year, t, and the previous year, t-1. Control variables include Log(Assets), Market-to-Book Assets, ROA, and Debt/Assets. Firm fixed effects (
$ {\gamma}_i\Big) $
 are included, and
$ {\varepsilon}_{i,t} $
 is an error term. The variables of interest are year indicator variables, with the omitted year being 2011 (the benchmark year). Results are presented in Graph A of Figure 3, which plots the coefficient estimates,
$ {\theta}_j $
 , of the percentage point change in the female director ratio in each year, relative to 2011, with error bars that indicate 95% confidence intervals for the coefficient estimates.
Figure 3 plots coefficient estimates and the 95% confidence intervals from the following regression specifications:


The sample consists of firms that are included in the S&P TSX Composite Index, with directorship data in BoardEx and financial data in Compustat, over the 2011–2018 period. The observations are at the firm-year level, with i indexing firms and t indexing calendar years. The dependent variable is the percentage point change in the fraction of a firm’s board consisting of female directors between the current year, t, and the previous year, t–1. “All-Male Board2013” is an indicator equal to 1 if a firm has no female directors in 2013. Control Variables consist of Log(Assets), Market-to-Book Assets, ROA, and Debt/Assets. All variables are defined in the Appendix. Firm fixed effects (
$ {\gamma}_i) $
 are included. The omitted year in the specifications, and thus the benchmark year, is 2011. The graph in Graph A displays the coefficient estimates
$ {\theta}_j $
 of the percentage point change in the female director ratio in each year, relative to 2011. The graph in Panel B displays the coefficient estimates
$ {\beta}_j $
 of the difference between the change in the female director ratio for firms with all-male boards and firms with female directors, relative to 2011. The post-regulation period is years 2015 onward. The error bars indicate 95% confidence intervals for the coefficient estimates.

FIGURE 3 Long description
The figure contains two panels.
Graph A: Year-on-Year Change in Female Director Ratio.
The x-axis represents Year from 2011 to 2018. The y-axis represents Percentage Point Change in Female Director Ratio, ranging from -1.00 percent to 3.50 percent. A horizontal dashed line marks the 0.00 percent baseline. The graph is divided into Pre-Regulation (2011 to 2014) and Post-Regulation (2014 to 2018).
* From 2011 to 2013, the change is near zero.
* In 2014, there is a sharp increase to approximately 2.1 percent.
* From 2015 to 2018, the change stabilizes between 1.5 percent and 2.0 percent.
Vertical error bars indicate 95 percent confidence intervals, which are wider in the post-regulation period.
Panel B: Difference in Year-on-Year Change in Female Director Ratio between Firms with All-Male Boards and Firms with Female Directors.
The x-axis is Year (2011 to 2018) and the y-axis is Percentage Point Change ranging from -3.00 percent to 6.00 percent.
* In the Pre-Regulation period, the difference dips below zero, reaching approximately -1.2 percent in 2013.
* In 2014, it rises sharply to 1.5 percent.
* In the Post-Regulation period, the difference fluctuates but shows an upward trend, peaking near 2.8 percent in 2018.
Error bars are significantly larger than in Graph A, particularly from 2014 onward.
Graph A of Figure 3 shows that in the pre-regulation period (2012 and 2013), changes in Canadian firms’ female director ratios are not statistically different from the benchmark year, 2011. However, in 2014, there is a distinct and statistically significant increase of about 2 percentage points in the annual change in female director ratios relative to 2011. The elevated rate of change persists at a similar magnitude of between 1.5 and 2 percentage points and remains statistically significant through 2018. These findings confirm a statistically significant increase in the rate of change in female director ratios for Canadian firms following the OSC amendment, validating the kink observed in Figure 2.
We next examine variations within the sample of Canadian firms to investigate whether the rate of change in female director ratios differs for firms with all-male boards. We augment the regression from Graph A by adding an interaction between the year indicator and an indicator for firms with all-male boards as of 2013 as follows:

Graph B of Figure 3 displays the coefficient estimates,
$ {\beta}_j $
 , of the difference between the change in the female director ratio for firms with all-male boards and firms with female directors, relative to 2011.Footnote
29 The figure indicates that following the amendment in 2014, firms with all-male boards in 2013 increased their female director ratios by about 1.5 percentage points more than firms with female directors in 2013 (the difference is statistically significant at the 10% level). The increase persists with similar magnitudes (of between 1 and 3 percentage points) through 2018 and is statistically significant (at the 5% level) in all subsequent years except 2016. The results indicate that, between the pre- and post-regulation periods, firms with all-male boards exhibited a larger increase in the rate of change in female director ratios than did firms with female directors. This pattern is consistent with Graph B of Supplementary Material Figure C.1, which showed that firms with all-male boards were more likely to add female directors in the post-regulation period. These results, which are akin to examining how a DiD coefficient changes dynamically over time, help address our concerns that our findings in Table 9 are driven by another Canada-specific event that also affects female ratios. That is, the results shown in Figure 3 make it less likely that the results in Table 9 are an artifact of the choice of using U.S. firms as a control group.
A potential concern is that the increase in female board representation reflects the same women being appointed to multiple boards, increasing the number of busy female directors, rather than an expansion in the pool of female directors. However, we find little evidence consistent with this interpretation. As shown in Supplementary Material Figure C.5, the number of unique female directors in our sample increases substantially following the OSC amendment, rising from 246 in 2013 to 430 in 2018. At the same time, the average number of board seats held by a female director declines from 3.09 in 2013 to 2.78 in 2018, and the percentage of female directors in our sample holding three or more board seats falls from 54.1% to 46.5% over the sample period. Together, these patterns suggest that firms increasingly drew from a broader pool of female directors rather than relying on the same women to fill multiple board positions.
In addition to board representation, the OSC amendment requires listed firms to disclose policies regarding female representation in the top executive team. Although the focus of our study is board representation, we also examine changes in the composition of the top named executives (from annual proxy circulars) in the years surrounding the OSC amendment. In practice, female executive targets are substantially less common than female director targets: during 2014–2018, only 27 firms in our sample adopt female executive targets compared to 111 firms adopting female director targets, and all firms adopting female executive targets also adopt female director targets.
The increase in the annual average proportion of female top executives at Canadian firms between the pre- and post-regulation periods is much smaller than for female directors, increasing from 6% to 8.9% between 2011 and 2018 (vs. 10% to 22% for directors). Moreover, similar analyses to those in Table 9 do not show substantial evidence of an increase in female executive ratios among Canadian firms relative to U.S. firms (see Supplementary Material Table C.10). We suggest the reason the OSC regulation impacted board gender diversity but not executive gender diversity is due to the higher costs associated with replacing top executives. Directors are up for election annually and can be added without displacing an existing board member. Moreover, unlike directorships, executive positions are not easily scalable, as a single executive typically cannot serve comparable executive roles across multiple firms, potentially making supply constraints more binding and slowing the development of a broader pipeline of female executives. Furthermore, institutional investors who acted upon the regulation appear to have been focused on improving female board representation (see Section VII), and media coverage of the regulation’s initial announcement appears to be more focused on board composition rather than that for executives.Footnote 30
VII. Mechanisms
Our analysis thus far shows that firms increasingly implement gender diversity policies following the OSC amendment. Moreover, even though the amendment contained no explicit requirement to increase board gender diversity nor did the OSC propose “best practices” guidelines for board gender diversity, female board representation significantly increased post-amendment (an economically significant 38% increase relative to U.S. firms). Additionally, we observe a positive association between a firm’s diversity disclosures and its female director ratio in subsequent years, suggesting a link between disclosure and board diversity. These findings are thus somewhat surprising, given that the only requirements of the amendment are with regard to disclosure of the firm’s gender diversity policy and female ratios. In fact, this was a point of contention among some institutional investors who felt the OSC amendment should have gone further. In its 2014 response to the amended OSC Consultation Paper, the Canadian Coalition for Good Governance (CCGG), an association comprised of large Canadian institutional investors, argued that the amendment should include “best practices” guidelines rather than just disclosure requirements: “We believe establishing positive guidelines with which companies can comply or explain why they chose not to comply, which is a true “comply or explain” regime, is more likely to promote change than simple disclosure requirements.”Footnote 31 CCGG’s position was that the OSC policy fell short by not providing clear guidelines for good gender diversity practices.
Given that the OSC amendment neither required firms to diversify their boards nor provided explicit guidance on “best practices” for board diversity, what prompted Canadian firms to increase board diversity after the amendment? The OSC’s initial consultation article offers insights: “These types of disclosures are intended to provide investors and other stakeholders with information on the issuer’s approach to advancing the representation of women on boards and in senior management, which in turn may impact investment and voting decisions.”Footnote 32 This suggests that shareholder pressure, particularly from institutional investors, may have been a key channel driving the increase in board diversity after the OSC amendment. Indeed, Gormley, Gupta, Matsa, Mortal, and Yang (Reference Gormley, Gupta, Matsa, Mortal and Yang2023) find that campaigns launched in 2017 by “The Big Three” institutional investors in the U.S., aimed at increasing gender diversity on corporate boards, led to a significant rise in the number of female directors.
To gain insight into how enhanced disclosure required by the OSC amendment may have empowered shareholders to influence board diversity in Canada, we examine engagements by a major coalition of institutional investors in Canada: the CCGG. We also analyze voting outcomes for nominating committee chairs to determine whether shareholders became more likely to express dissatisfaction with a lack of board diversity through their votes after the amendment.
A. Institutional Investor Engagement
The CCGG was established in 2003 by institutional investors to promote improved corporate governance practices among Canadian public companies. CCGG currently represents 51 major institutional investors in Canada, accounting for approximately 22% of the total institutional ownership of Canadian firms in our sample, with $5.5 trillion in assets under management. Since 2008, CCGG has engaged directly with Canadian public company boards on various governance issues. These board engagement meetings offer a private forum for dialogue and exchange of views between independent directors and institutional investors.Footnote 33 The CEO of CCGG stated, “Board engagements are the appropriate forum to discuss a company’s governance practices, including shareholder rights, board composition, executive compensation, and board oversight of corporate strategy and material business risks….”Footnote 34
We obtained proprietary data from CCGG on all its engagement meetings with Canadian companies from 2008 to 2018. Panel A of Table 10 summarizes these engagements. On average, CCGG engages about 40 companies annually. We received a summary report for each engagement, allowing us to categorize what was discussed and, particularly, whether board gender diversity was among the issues raised. Notably, there was no discussion of board gender diversity in any engagement meeting before 2012. While the topic of diversity began to surface in 2012 and 2013, there was a marked increase after 2013 in discussions of board gender diversity. For example, of the 36 engagements in 2014, 27 (75%) included discussions on board gender diversity. Gender diversity continued to be a popular topic, representing about 59% of all engagements in 2015 and about 40% in 2016 and 2017. Interestingly, many of these discussions on board gender diversity were not initiated by CCGG; instead, firms themselves often used these meetings to inform CCGG of their actions regarding board diversity.Footnote 35 Forty-two percent (15 out of 27) of gender diversity discussions were proactively initiated by firms in 2014, with 62% of gender diversity discussions being proactively initiated by firms in 2015. These statistics suggest that OSC amendment’s disclosure requirements may have heightened boards’ focus on diversity, particularly in the years immediately following the amendment. The last 2 columns show the number of engagements in which CCGG commends or questions the firm on the gender diversity of its board. Examples of questions asked by CCGG include whether the board has considered the issue of gender diversity, whether the board considers gender when adding new directors, whether directors believe it makes sense to have one or more females on the board, what the board is doing to identify appropriate female candidates, or asking directors to comment on the lack of gender diversity on their board.

TABLE 10 Long description
Panel A. Summary of C C G G Engagements.
This table tracks engagement data across six columns: Year, Total Number of C C G G Engagements on any Subject, Percentage of Engagements with Discussion of Board Gender Diversity, and three sub-columns under Number of Gender Diversity Engagements in Which: Firm Initiates Discussion, C C G G Commends Firm, and C C G G Questions Firm.
- 2008 to 2011: Total engagements grew from 5 to 41, but gender diversity discussion remained at 0 percent.
- 2012: 40 total engagements, 5 percent gender discussion, 1 firm-initiated, 0 commended, 1 questioned.
- 2013: 48 total engagements, 29 percent gender discussion, 6 firm-initiated, 0 commended, 8 questioned.
- 2014: 36 total engagements, 75 percent gender discussion, 15 firm-initiated, 5 commended, 7 questioned.
- 2015: 41 total engagements, 59 percent gender discussion, 15 firm-initiated, 3 commended, 6 questioned.
- 2016: 45 total engagements, 40 percent gender discussion, 11 firm-initiated, 5 commended, 2 questioned.
- 2017: 44 total engagements, 41 percent gender discussion, 8 firm-initiated, 6 commended, 4 questioned.
- 2018: 36 total engagements, 31 percent gender discussion, 9 firm-initiated, 0 commended, 2 questioned.
Panel B. Regressions of Changes in Female Directorships Following C C G G Engagements.
The dependent variable is Female Director Ratio across four models.
- C C G G Post-Engagement: Coefficients are 0.051 (significant at 1 percent), 0.033 (significant at 10 percent), 0.032 (significant at 10 percent), and 0.025.
- C C G G Engagement Fixed Effect: Coefficients are minus 0.0385 (significant at 10 percent) and minus 0.033 (significant at 5 percent).
- C C G G Ownership: Coefficients are 0.0009 and 0.0007.
- Controls: Models 1 and 3 have no other controls; Models 2 and 4 include other controls.
- Fixed Effects: All models include Year fixed effects. Models 1 and 2 include Industry fixed effects. Models 3 and 4 include Firm fixed effects.
- Observations: Range from 2,155 to 2,239.
- Adjusted R-squared: Ranges from 0.313 to 0.784.
Panel B estimates the impact of CCGG’s activism on female corporate board representation. The dependent variable is the proportion of a firm’s board made up of female directors. The CCGG Engagement Fixed Effect is an indicator equal to 1 if CCGG questioned the firm on director gender diversity in any year in our sample (between 2011 and 2018). CCGG Post-Engagement is an indicator variable that equals 1 if CCGG questioned the firm on director gender diversity in a prior year (i.e., equals 1 in year t and all subsequent years if a firm was engaged in year t–1). All models are linear probability models and include year fixed effects. Models 1 and 2 include 1-digit SIC industry fixed effects, while models 3 and 4 include firm fixed effects. Models 2 and 4 also include observable firm characteristics and governance controls.
The coefficient of our main explanatory variable (CCGG Post-Engagement) indicates the change in the female director ratio following CCGG’s engagement, relative to firms not engaged on gender diversity during this period. The coefficient is positive and statistically significant in three of the four models, demonstrating that CCGG engagements on gender diversity lead to a higher subsequent female director ratio. In terms of economic significance, the coefficient in model 2 suggests an increase of about 3 percentage points in the female director ratio following CCGG’s engagement. The negative and statistically significant coefficient on CCGG Engagement Fixed Effect indicates that firms targeted by CCGG have a female director ratio that is, on average, 3 percentage points lower. This suggests that CCGG targets firms with lower female board representation and that these engagements result in an increase in female board representation. Our findings are consistent with Doidge, Dyck, Mahmudi, and Virani (Reference Doidge, Dyck, Mahmudi and Virani2019), who study CCGG engagements related to the adoption of majority voting, say on pay, and specific compensation policies—but not diversity policies—and find that firms engaged by CCGG are more likely than non-engaged firms to adopt CCGG’s specific governance proposals.
We acknowledge potential caveats to these findings. First, firms engaged by CCGG are not randomly selected, raising concerns about causal interpretation. Engaged firms might have improved board gender diversity even without these engagements. However, consistent with a causal interpretation, CCGG are unlikely to expend scarce resources to engage firms that already plan to make these governance changes. Moreover, we show that CCGG targets firms with lower female board representation (without a gender diversity target), and we find that these engagements are followed by increases in female board representation. Second, it’s possible that an omitted variable (e.g., the same societal trends that spurred the OSC regulation) affected institutional investors’ attitudes toward board diversity around 2014 and led to their engagements. While we acknowledge this possibility, our discussions with CCGG suggest enhanced disclosure of the OSC amendment facilitated their engagement efforts. Catherine McCall, CEO of CCGG, noted that the OSC amendment provided their institutional investor members “meaningful information and disclosure, allowing them to express their disapproval of a lack of diversity by voting against one or more directors.”Footnote 36
B. Voting Outcomes
The OSC stated that its gender disclosure regulation aimed to provide investors and stakeholders with information on a company’s efforts to advance women’s representation on boards and in senior management, suggesting these disclosures might influence investment and voting decisions. Notably, CCGG indicates that its members may withhold votes based on diversity considerations. CCGG’s Gender Diversity Policy notes, “Investors are looking to see the extent of diversity when evaluating a company and boards are increasingly facing investors’ higher expectations in this area,” and also mentions that “several of CCGG’s members have proxy voting guidelines that recommend voting to withhold from some directors in certain circumstances where gender diversity is considered to be inadequate.”
The OSC amendment requires firms to disclose their stance on board diversity, giving investors additional data upon which to act. This increased post-amendment disclosure provides investors with information that may allow them to express dissatisfaction with board diversity. We posit that investors will be more likely to express such dissatisfaction via votes against the chair of the nominating committee post-amendment when firms must disclose their stance on board diversity. To analyze whether the OSC regulation impacted voting decisions in director elections, we obtain shareholder voting data from Institutional Shareholder Services (ISS) and from the Johnston Centre for Corporate Governance Innovation at the University of Toronto.Footnote 37 Since the ISS data for Canadian firms start in 2013, our analysis in Table 11 covers 2013–2018 (2 years pre- and 4 years post-regulation). The dependent variable is the percentage of votes withheld and against, reflecting the lack of support for the chair of the nominating committee. The main explanatory variables are the interaction of female director ratio and a post-regulation dummy (Post-2014 × Female Director Ratio) in models 1 and 3 and the interaction between gender diversity target dummy and post-regulation (Post-2014 × Female Director Target) in models 2 and 4. All specifications are OLS regressions with year fixed effects. Models 2 and 4 also include firm characteristics and governance controls. Models 1–4 include 1-digit SIC industry fixed effects, while models 5 and 6 include firm fixed effects.

TABLE 11 Long description
A table titled Gender Diversity and Changes in Chair of Nominating Committee Voting Support. The dependent variable is Chair of Nominating Committee Voting: Withheld and Against. The table presents six O L S regression models.
Key independent variables and coefficients:
* Female Director Ratio: Model 1 is -16.580 (significant at 1%), Model 4 is -12.817 (significant at 5%).
* Female Director Target: Model 2 is -1.560, Model 3 is -0.607.
* Post-2014 times Female Director Ratio: Model 1 is -19.420 (significant at 5%), Model 3 is -19.610 (significant at 5%), Model 5 is -30.128 (significant at 1%).
* Post-2014 times Female Director Target: Model 2 is -5.586 (significant at 1%), Model 4 is -4.469 (significant at 5%), Model 6 is -5.163 (significant at 1%).
Control variables include Institutional Ownership, Media Coverage, Controlled Corporation, Independent Board, Log(Assets), Market-to-Book Assets, Return-on-Assets, Debt/Assets, Board Size, Board Degree Centrality, Board Tenure, and Board Age.
Fixed Effects and Statistics:
* Year fixed effects: Yes for all models.
* Industry fixed effects: Yes for models 1 through 4; No for models 5 and 6.
* Firm fixed effects: No for models 1 through 4; Yes for models 5 and 6.
* Number of observations: 1,187 for models 1 and 2; 1,120 for models 3 through 6.
* Adjusted R-squared: Ranges from 0.050 in Model 2 to 0.318 in Model 5.
In Table 11, the coefficient on Post-2014 × Female Director Ratio is negative and statistically significant in models 1 and 3, indicating that after the OSC amendment, firms with lower female director ratios receive less voting support for the chair of their nominating committee than they did before the amendment. Similarly, the negative and statistically significant coefficient on Post-2014 × Female Director Target in models 2 and 4 suggests that after the amendment, not having a director gender target is associated with less voting support for the nominating chair than it was before the amendment.Footnote 38 These results are consistent in models 5 and 6 with firm fixed effects. In terms of economic significance, the coefficient in model 5 implies that after the OSC amendment, a 1-standard-deviation lower female director ratio results in 3.7% lower voting support for the nominating committee chair, while the coefficient in model 6 suggests that not having a gender target results in 5.2% lower voting support relative to the pre-amendment period. In untabulated regressions, we find similar results using the average votes withheld and against the nominating committee as the dependent variable (as opposed to the nominating chair).Footnote 39
Table 11 shows that shareholders were more likely to vote against the nominating committee chair at firms with low female board representation after the OSC amendment, but not before. This suggests that the amendment increased shareholder attention to gender diversity on boards. Importantly, the OSC amendment also required firms to disclose their position on board gender diversity. Accordingly, Table 12 examines voting outcomes for nominating committee chairs based on common justifications provided by explainers and partial compliers for not setting gender diversity targets. Among firms with all-male boards, we find that the chair receives 7% more votes withheld or cast against when the firm claims that targets are unnecessary or inadvisable, and 8.4% more when the firm states that targets are not an appropriate tool to improve diversity. In contrast, we find no similar effect for firms citing merit-based appointments, firm size, or board turnover constraints. These findings suggest that shareholders distinguish between firms perceived as dismissing board diversity initiatives and firms providing more substantive or operational explanations for not adopting targets. More broadly, the evidence indicates that investors respond not only to the presence or absence of diversity disclosures but also to their specific content and framing in proxy statements.

TABLE 12 Long description
The table presents O L S regression results with ‘Chair of Nominating Committee Voting: Withheld and Against’ as the dependent variable.
* Column Headers: Six models numbered 1 through 6.
* All-Male Board: Coefficients range from 3.164 to 4.000, with statistical significance in models 2, 3, 4, and 6.
* Interaction Terms:
- Appointments Based on Merit/Skills cross All-Male Board: 0.883 (Model 1).
- Targets Not Necessary or Advisable cross All-Male Board: 7.030 with 5 percent significance (Model 2).
- Too Small for Target cross All-Male Board: minus 5.174 (Model 3).
- Targets Not Appropriate cross All-Male Board: 8.440 with 5 percent significance (Model 4).
- Targets Do Not Result in Best Candidate cross All-Male Board: 1.438 (Model 5).
- Turnover too Infrequent for Target cross All-Male Board: 4.460 (Model 6).
* Controls and Fixed Effects: All models include Other controls, Year fixed effects, and Industry fixed effects.
* Model Statistics:
- Constant: Values range from minus 3.017 to 0.555.
- Number of observations: 707 for all models.
- Adjusted R-squared: Ranges from 0.092 to 0.095.
Standard errors are provided in parentheses below each coefficient. Asterisks indicate significance levels: three for 1 percent, two for 5 percent, and one for 10 percent.
In Supplementary Material Table C.11, we focus on firms that fully comply and examine whether the adopted female director target is associated with voting support for the chair of the nominating committee. The coefficient on the Female Director Target is negative and statistically significant, indicating that firms adopting higher targets receive lower percentages of withheld or against votes. Using the estimate from model 2, a 1-standard-deviation increase in Female Director Target (0.056) is associated with approximately a 2.4% reduction in withheld or against votes. We do not find evidence that this relation differs for firms with all-male boards. Overall, the evidence suggests that, among Full Compliers, shareholders respond more favorably to firms adopting more ambitious female director targets.
C. Summary of Mechanisms
Although the OSC amendment did not explicitly provide “best practices” guidelines, it was designed to give investors insights into firms’ board diversity practices, potentially influencing investment and voting decisions. Following the regulation, the OSC facilitated access to this information by mandating the disclosure of firms’ board diversity practices. The evidence suggests that the OSC’s reasoning was correct: board diversity increased even without an explicit mandate. This increase appears to be driven at least in part by investor pressure: post-amendment, institutional investor engagements on board diversity increase, and investors are more likely to vote against nominating chairs and committees of firms with non-diverse boards. Moreover, investors respond to diversity disclosures through voting. Overall, our evidence suggests that the disclosure of diversity policies required by the amendment contributed to increased board diversity through investor engagement and voting.
VIII. Conclusion
This article finds that firms responded to the OSC amendment by increasing board gender diversity, despite the amendment’s flexible, non-mandatory design. Following the OSC’s disclosure-based approach, the share of firms with at least one female director rose from 56% prior to the announcement to 94% by 2018, and the ratio of female directors increased significantly more in Canada than among comparable U.S. firms over the same period. Importantly, firms that did not increase board diversity are those facing economic constraints in identifying qualified female director candidates, consistent with director supply frictions rather than regulatory inattention. That firms respond to a regulation that does not mandate board diversification, but instead relies on disclosure and explanation, highlights the power of market-based enforcement mechanisms.
These findings also speak directly to ongoing policy debates about the relative merits of quota-based mandates versus principles-based disclosure regimes. Unlike quotas, which require firms to meet fixed numerical thresholds within prescribed timeframes, the OSC amendment allows firms discretion over both the timing and form of compliance. As a result, changes in board composition following the amendment are smaller on average and more heterogeneous across firms than those documented under quota regimes. This outcome reflects policy design rather than weaker effectiveness. Prior studies of binding quotas show that large, discrete adjustments—particularly among firms far from mandated thresholds—can require costly board restructuring and exacerbate director supply constraints, contributing to negative or mixed valuation effects. In contrast, the OSC’s principles-based framework permits firms to adjust both the timing and level of female director targets based on investor demand and candidate availability, mitigating the costs associated with forced board restructuring and convergence toward a single mandated quota.
Consistent with this mechanism, we find that firms most affected by the OSC amendment—those with all-male boards or without pre-existing diversity policies—exhibit a directly linked sequence of responses: positive announcement returns, enhanced disclosure, increased investor engagement and voting pressure, and subsequent increases in female board representation. These results suggest that investors anticipate net benefits when diversity objectives are pursued through flexible, disclosure-based regulation rather than binding mandates.
Our findings also inform the broader applicability of “comply or explain” regulation. While such regimes vary in their stringency, the OSC amendment represents a particularly light-touch version: it does not prescribe a “best practice” target for female board representation but instead requires firms to disclose whether they have set a target and to explain if they have not. This structure emphasizes transparency and accountability rather than mechanical compliance. In contexts where legal or political constraints limit the feasibility of binding mandates, principles-based disclosure regulation may offer a viable alternative. Its effectiveness, however, may depend on the institutional environment. Because our findings point to a mechanism based on investor scrutiny and reputational pressure, the external validity of our findings is likely strongest in markets with similarly active institutional investors, high proxy voting participation, and disclosure regimes that make firm-level governance practices comparable across issuers. Where these conditions are weaker, such as settings with limited investor engagement or less transparent proxy disclosure, principles-based regulation may have more muted effects.
Overall, our evidence suggests that enhanced disclosure combined with “comply or explain” regulation can meaningfully increase board gender diversity while potentially imposing lower costs on firms than quota-based approaches. Given the leniency of the OSC amendment, our estimates may represent a lower bound on the level of female board representation achievable under comply-or-explain regulation, benchmarked against a more prescriptive regime that sets a target. We note, however, that a more prescriptive regime need not produce greater representation: if its target were set sufficiently low, it could anchor firms at or below the levels they adopt voluntarily under disclosure alone, in which case our estimate would not be a lower bound. At the same time, our findings caution that such approaches may not be sufficient in all contexts: while the OSC amendment applies to executive diversity disclosure, we do not observe any effect on executive diversity outcomes, suggesting that when adjustment costs are high, disclosure alone may not induce change.
Appendix. Variable Definitions
Definition of the variables used in the article (in alphabetical order).
- All-Male Board2013:
-
Equals 1 if a firm has no female directors on its board in 2013, and 0 otherwise (source: BoardEx).
- Board Age:
-
The mean age of the directors on a firm’s board (source: BoardEx).
- Board Degree Centrality:
-
The number of other directorships ever held by the firm’s directors until and including the current year (source: BoardEx).
- Board Size:
-
The number of directors on a firm’s board (source: BoardEx).
- Board Tenure:
-
The mean tenure of the directors on a firm’s board (source: BoardEx).
- Board Too Small for Targets:
-
Equals 1 if a firm states that its board is too small to consider a female director target (source: SEDAR).
- Canadian Firm:
-
Equals 1 if the firm is listed on the Toronto Stock Exchange (source: Worldscope).
- CAR(i,j):
-
The cumulative abnormal return from day i to j around the Ontario Securities Commission’s announcement on July 30, 2013, of a proposed rule amendment regarding a policy relating to the representation of women in boards and in executive officer positions. The cumulative abnormal returns are computed using a 4-factor return model (Fama and French (Reference Fama and French1993), Carhart (Reference Carhart1997)) with a 250-day estimation window ending 30 days before the announcement with at least 60 observations (Source: Datastream).
- CCGG Engagement Fixed Effect:
-
Equals 1 if a firm is engaged by the Canadian Coalition for Good Governance (CCGG) on director gender diversity in any year in our sample (between 2011 and 2018) (Source: Canadian Coalition for Good Governance)
- CCGG Ownership:
-
The percentage of a firm’s shares owned by institutional investors who are members of the CCGG (source: CCGG, Factset).
- Log(1 + CCGG $ Ownership):
-
Natural logarithm of 1 plus the total dollar value of CCGG members’ holdings in a firm in a given year. (Source: CCGG, FactSet)
- CCGG Post-Engagement:
-
Equals 1 if a firm is engaged on director gender diversity by CCGG in the previous year(s) in our sample (Source: Canadian Coalition for Good Governance)
- Chair of Nominating Committee Voting Withheld and Against:
-
Equals 1 minus the voting support as a percentage of the voting base for the chair of the nominating committee (Source: ISS voting analytics data and Johnston Centre for Corporate Governance Innovation).
- Controlled Corporation:
-
Equals 1 if a firm has multiple voting share classes and/or it has closely held shares exceeding 30% of its shares outstanding, and 0 otherwise (source: SEDAR, Worldscope).
- Debt/Assets:
-
Long-term debt plus debt in current liabilities divided by total assets (source: Compustat).
- Female CEO Indicator:
-
Equals 1 if the firm has a female CEO (source: SEDAR).
- Female Executive Ratio:
-
The fraction of a firm’s top five named executive officers disclosed in their proxy circular who are female (source: SEDAR).
- Full Compliance:
-
Equals 1 if a firm meets all three criteria of OSC’s board gender diversity regulation, complying with items 2, 3, and 5 (source: SEDAR).
- Independent Board:
-
The fraction of a firm’s board consisting of Non-executive directors (source: BoardEx).
- Infrequent Turnover to Have Targets:
-
Equals 1 if a firm states that its board has infrequent director turnover to be able to consider a female director target (source: SEDAR).
- Interlock with Partial Compliance:
-
The mean number of board interlocks that directors of a firm that is a Partial Complier. Partial Compliers adhere to items 2 and 3 of the regulation but fall short of implementing a female director target (i.e., they do not comply with 5). (source: BoardEx, SEDAR).
- Institutional Ownership:
-
The percentage of a firm’s shares owned by institutional investors (source: Factset).
- Interlock with Female Directors:
-
The mean number of board interlocks that directors of a firm have with female directors, excluding the female directors of the firm itself (source: SEDAR).
- Interlock with Full Compliance:
-
The mean number of board interlocks that directors of a firm that is a Full Complier. Full Compliers meet all three criteria of the regulation, complying with items 2, 3, and 5 (source: BoardEx, SEDAR).
- Lagged Change in Votes:
-
Lagged change (from t-1 to t-2) in votes withheld or against tthe chair of the nominating committee as a percentage of the voting base. (Source: ISS voting analytics data and Johnston Centre for Corporate Governance Innovation).
- Log(Assets):
-
Natural logarithm of total assets (source: Compustat).
- Male Director Ratio:
-
The fraction of the firm’s directors consisting of male directors (source: BoardEx) in 2018.
- Market-to-Book Assets:
-
Fiscal year-end market capitalization plus book value of preferred stock (liquidation value or redemption value if liquidation value is missing) plus deferred taxes and investment tax credit plus long-term debt plus debt in current liabilities, all divided by total assets (source: Compustat).
- Media Coverage:
-
Number of times a firm is cited in Financial Times, Financial Post, and Toronto Star divided by 100 (source: Nexis).
- No Female Director Policy2013:
-
Equals 1 if a firm does not voluntarily include a gender diversity policy in its proxy circular in 2013, and 0 otherwise (source: SEDAR).
- No Term Limit:
-
Equals 1 if a firm does not impose a limit on the duration a director may serve on the board, and 0 otherwise (source: SEDAR).
- Number of Local Female Industry Directors:
-
The number of female directors on corporate boards for all firms headquartered within 100 km of the firm’s headquarters that are from the same 1-digit SIC industry (source: BoardEx, Worldscope).
- Partial Compliance:
-
Equals 1 if a firm adheres to items 2 and 3 of OSC’s board gender diversity regulation but falls short of implementing a female director target (i.e., they do not comply with 5). (source: SEDAR).
- Return-on-Assets:
-
Operating income before depreciation divided by total assets (source: Compustat).
- Selects Directors Based on Skill and Merit:
-
Equals 1 if a firm states that it nominates directors based on skill, merit, and experience. (source: SEDAR).
- Targets Do not Result in Best Directors:
-
Equals 1 if a firm states that a female director target does not result in best directors (source: SEDAR).
- Targets Not Necessary or Advisable:
-
Equals 1 if a firm states that a female director target is not necessary or advisable or it is arbitrary (source: SEDAR).
- Targets are not Needed to Increase Diversity:
-
Equals 1 if a firm states that a female director target is not needed to increase board gender diversity (source: SEDAR).
Supplementary Material
To view supplementary material for this article, please visit http://doi.org/10.1017/S0022109026103238.
Funding Statement
This work was supported by the University of Delaware Alfred Lerner College of Business and Economics Research Grant.
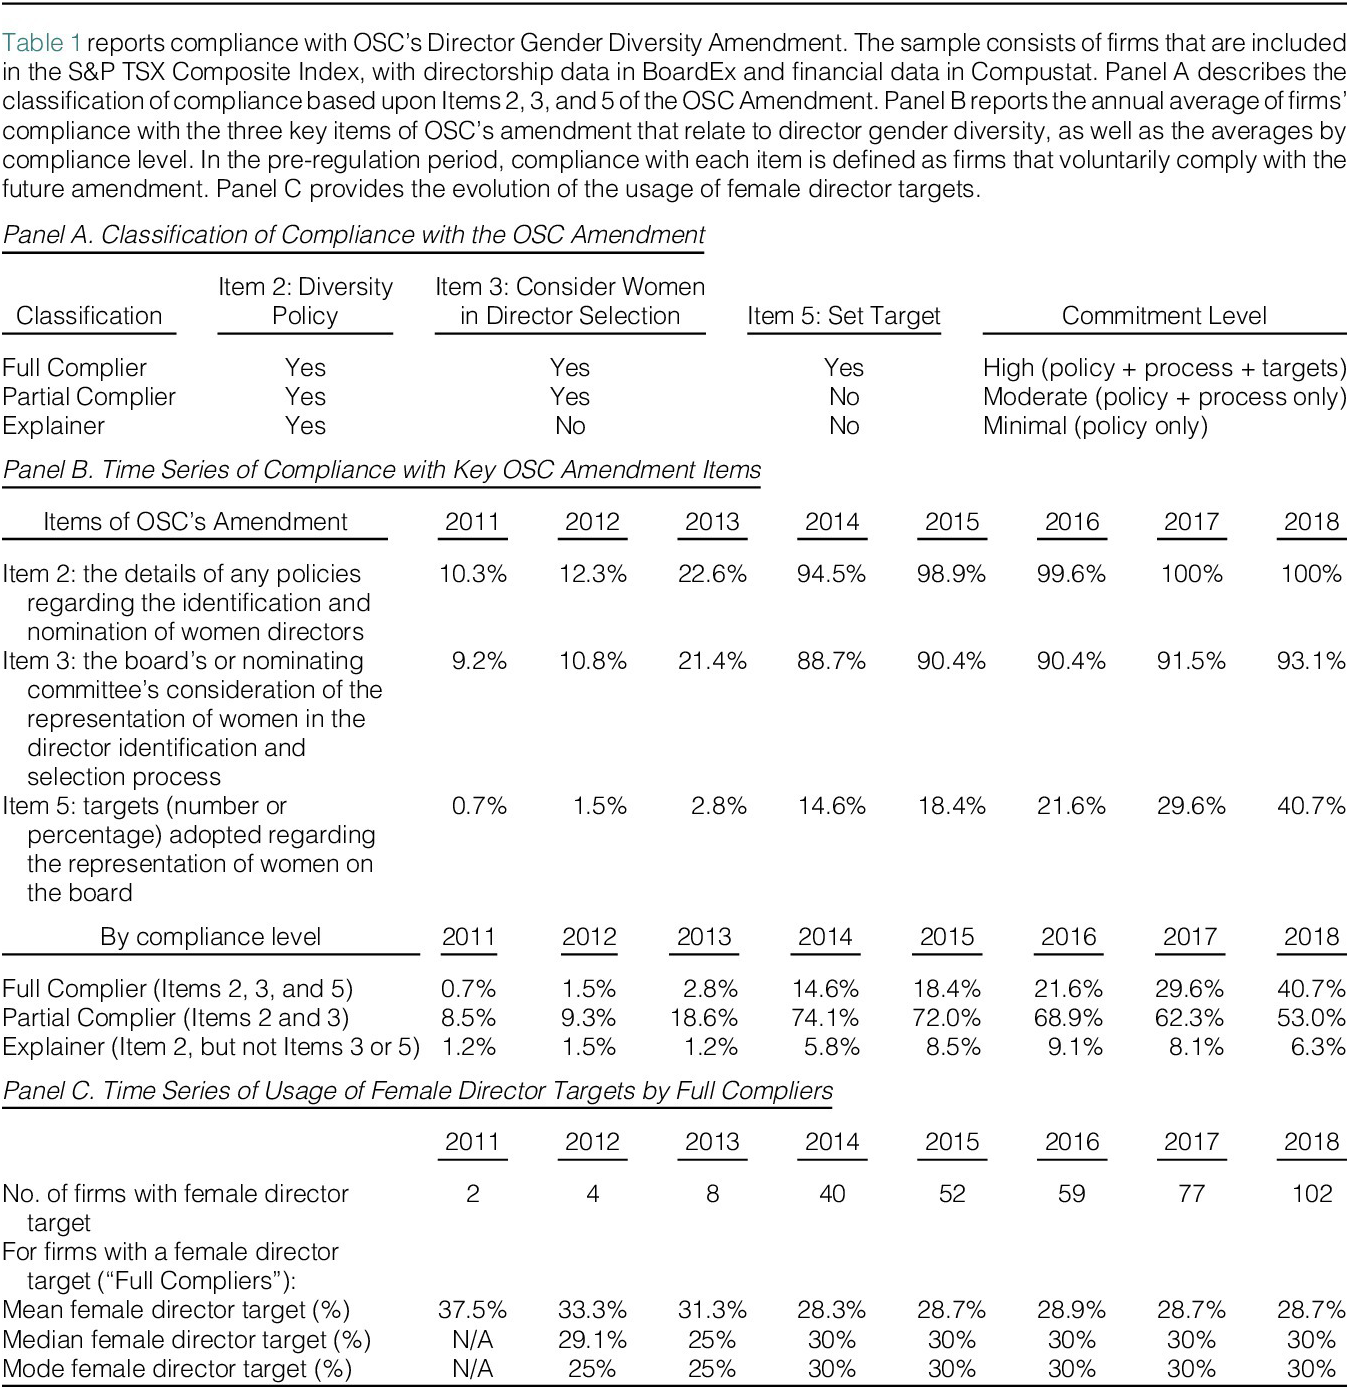

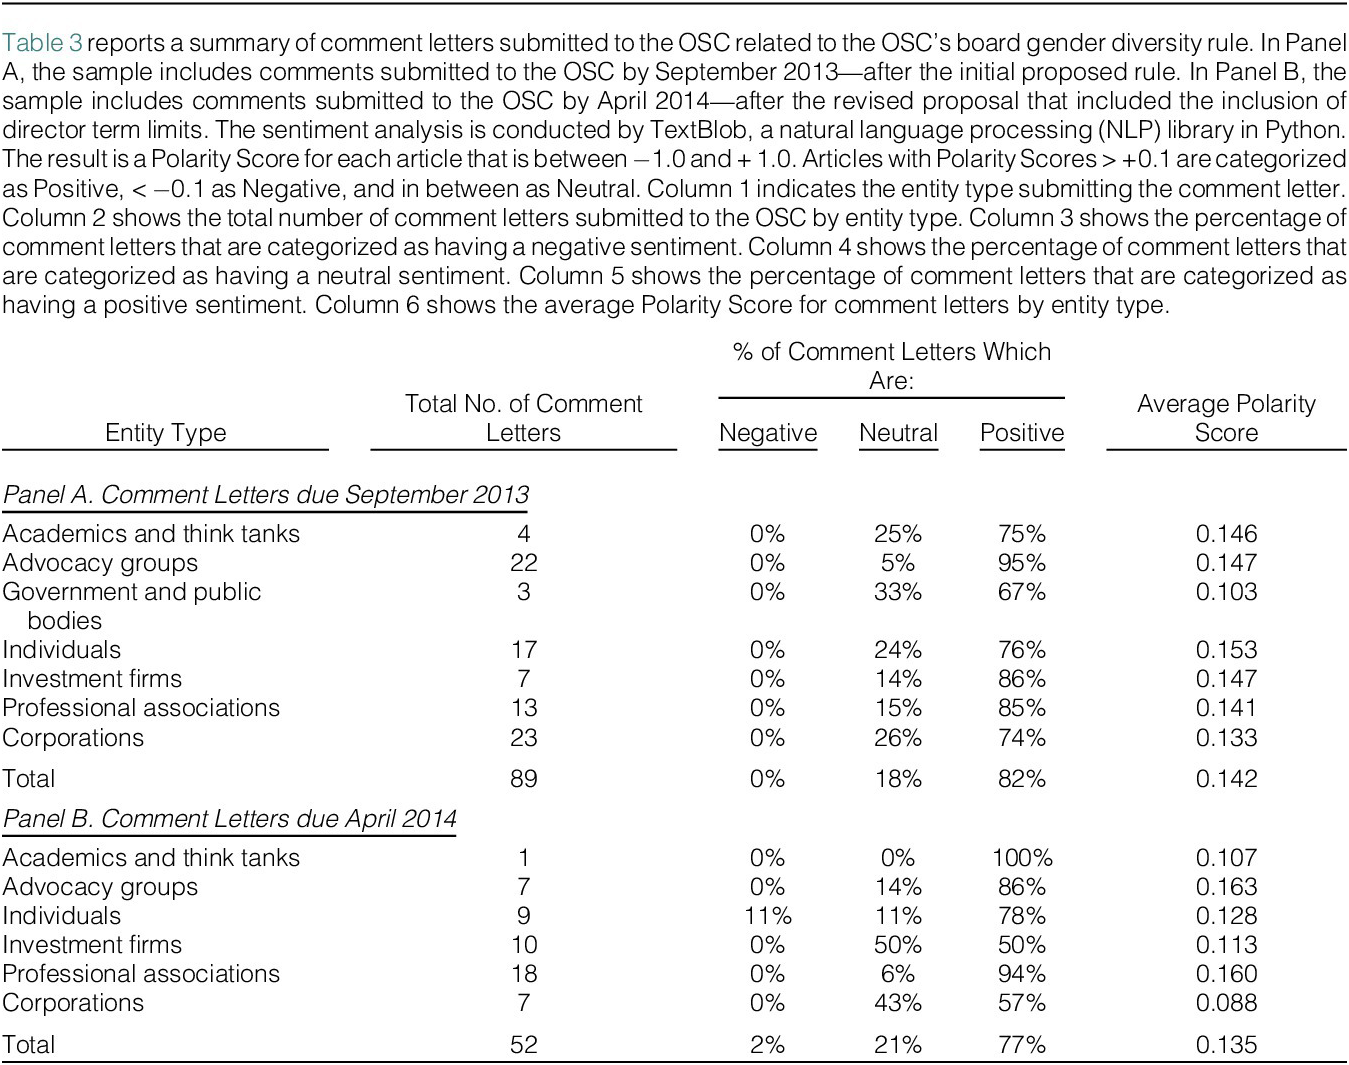
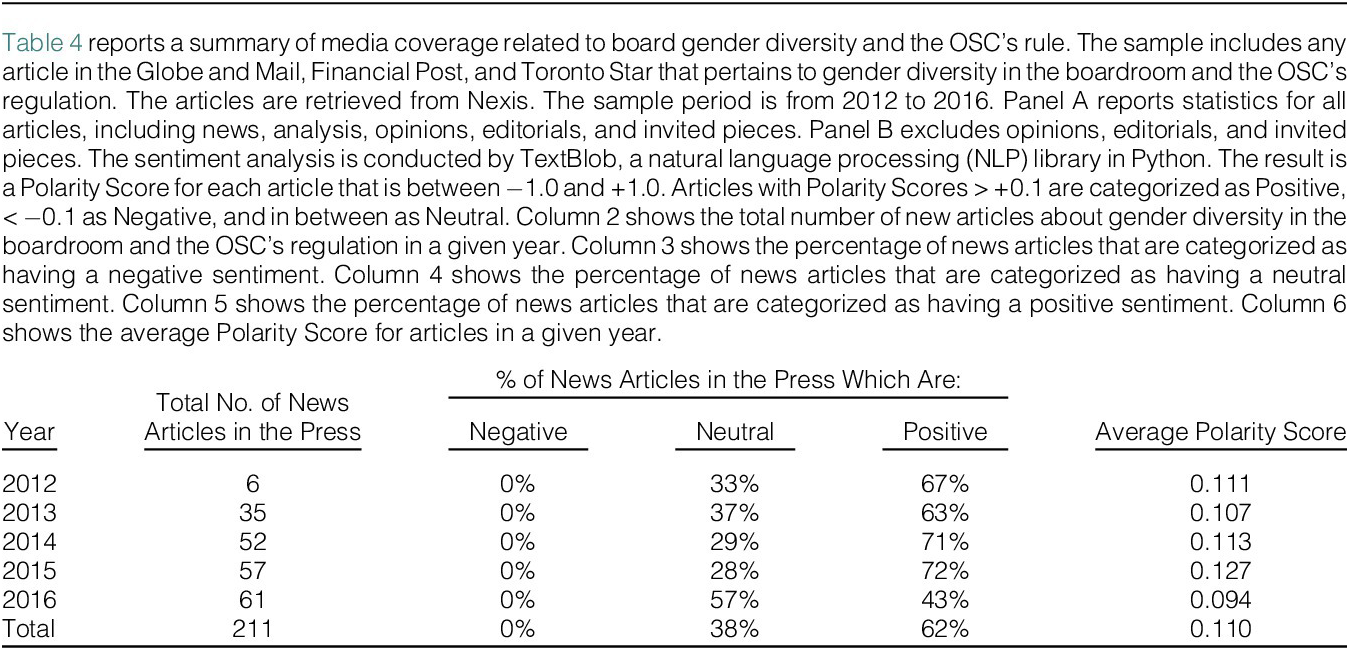
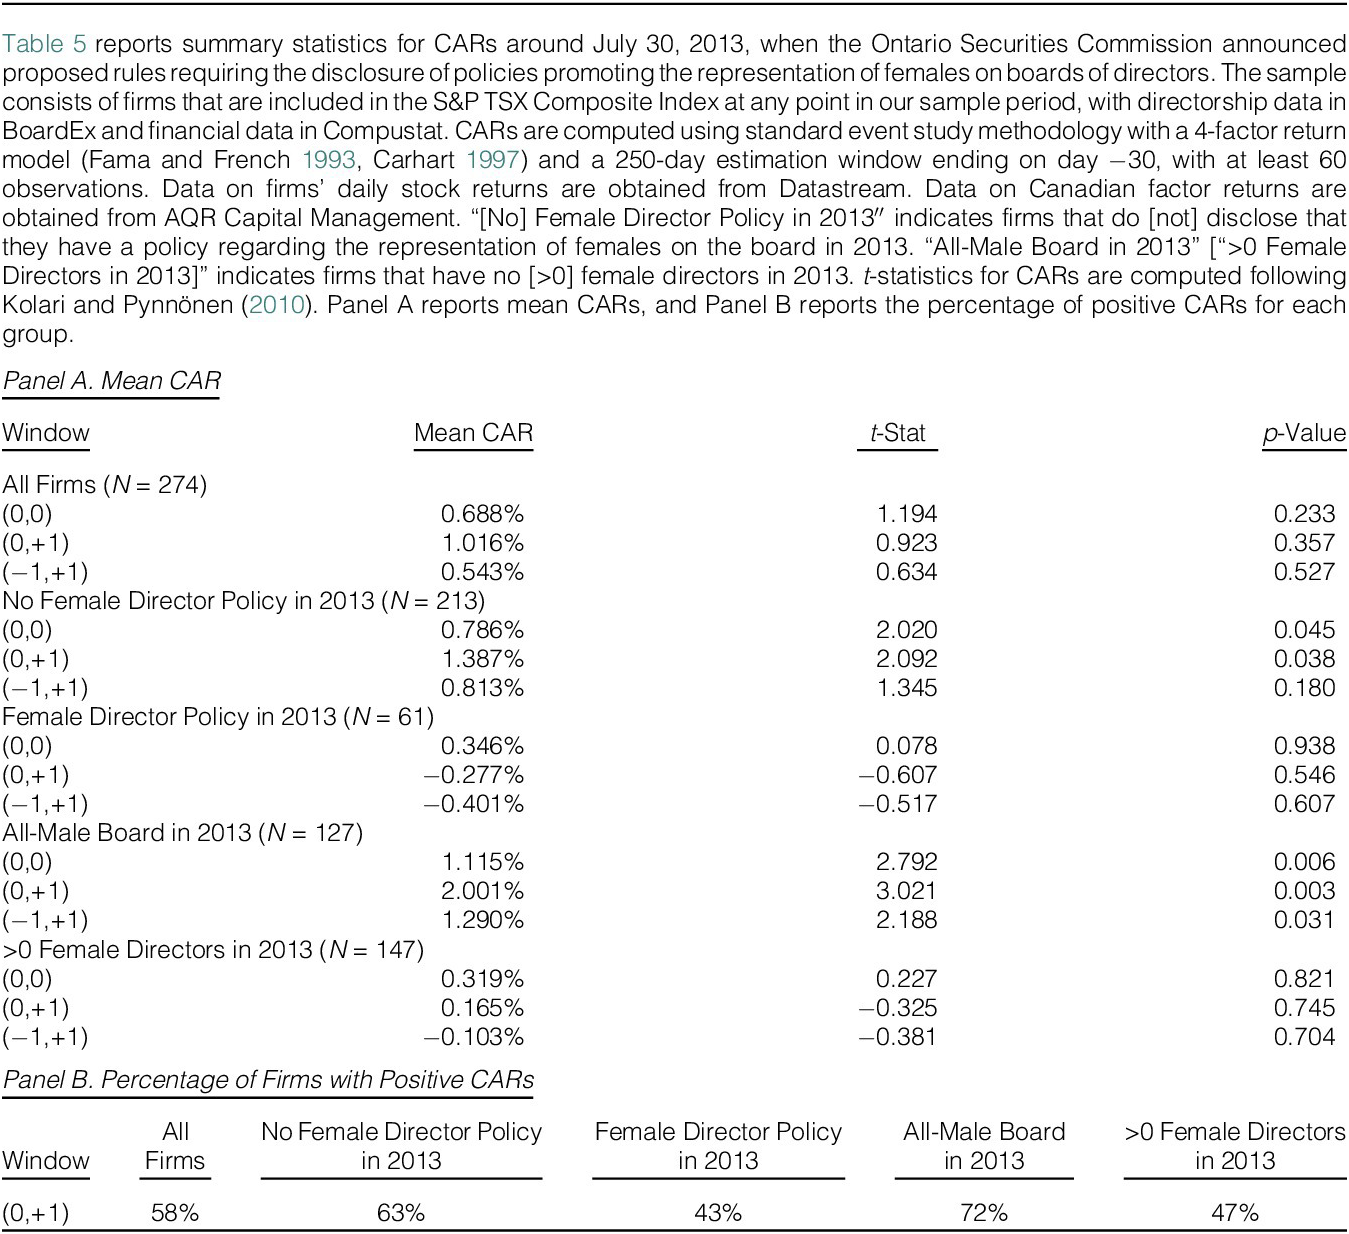
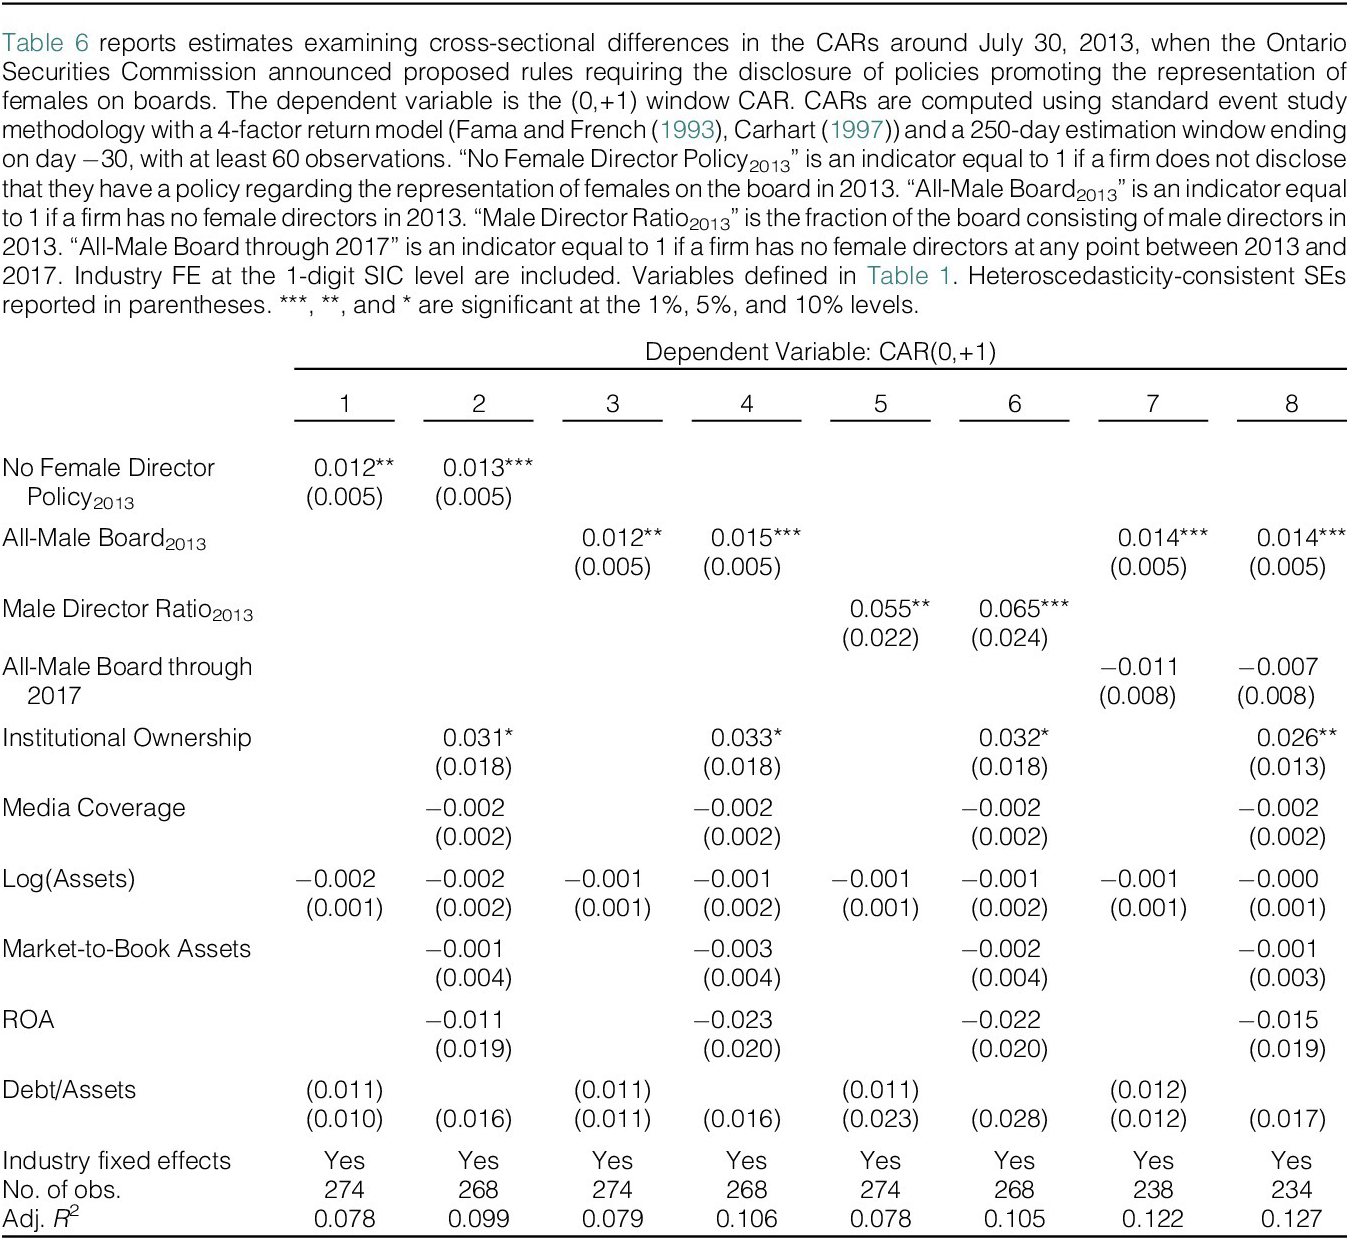
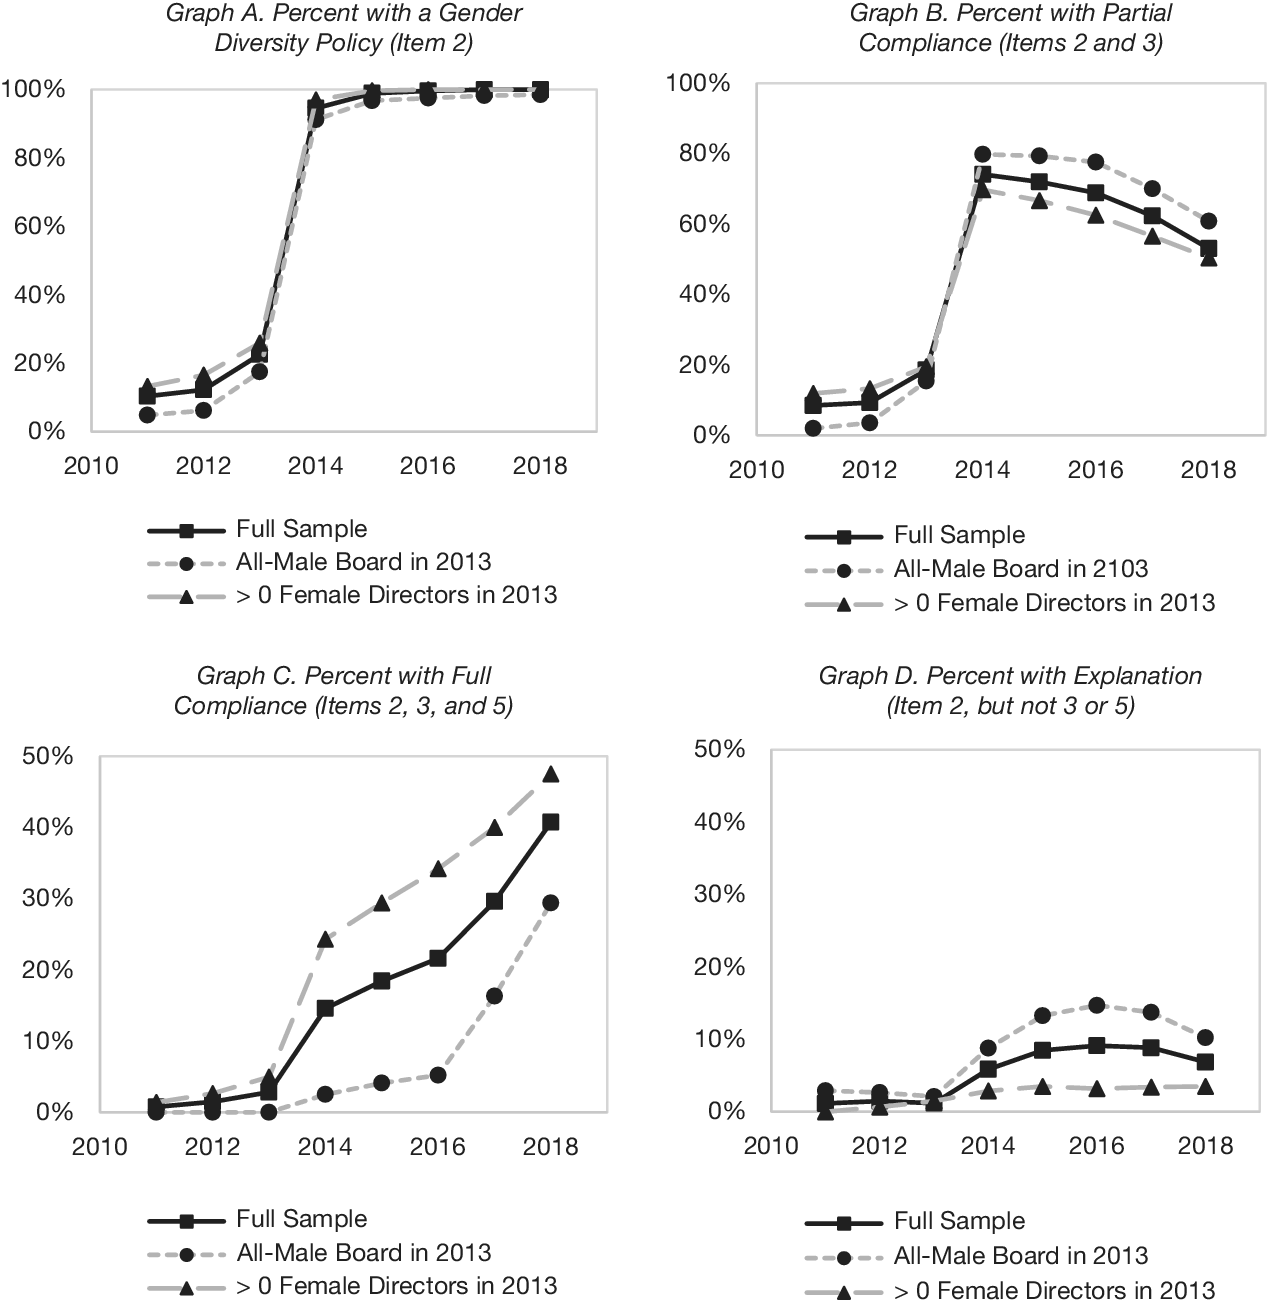
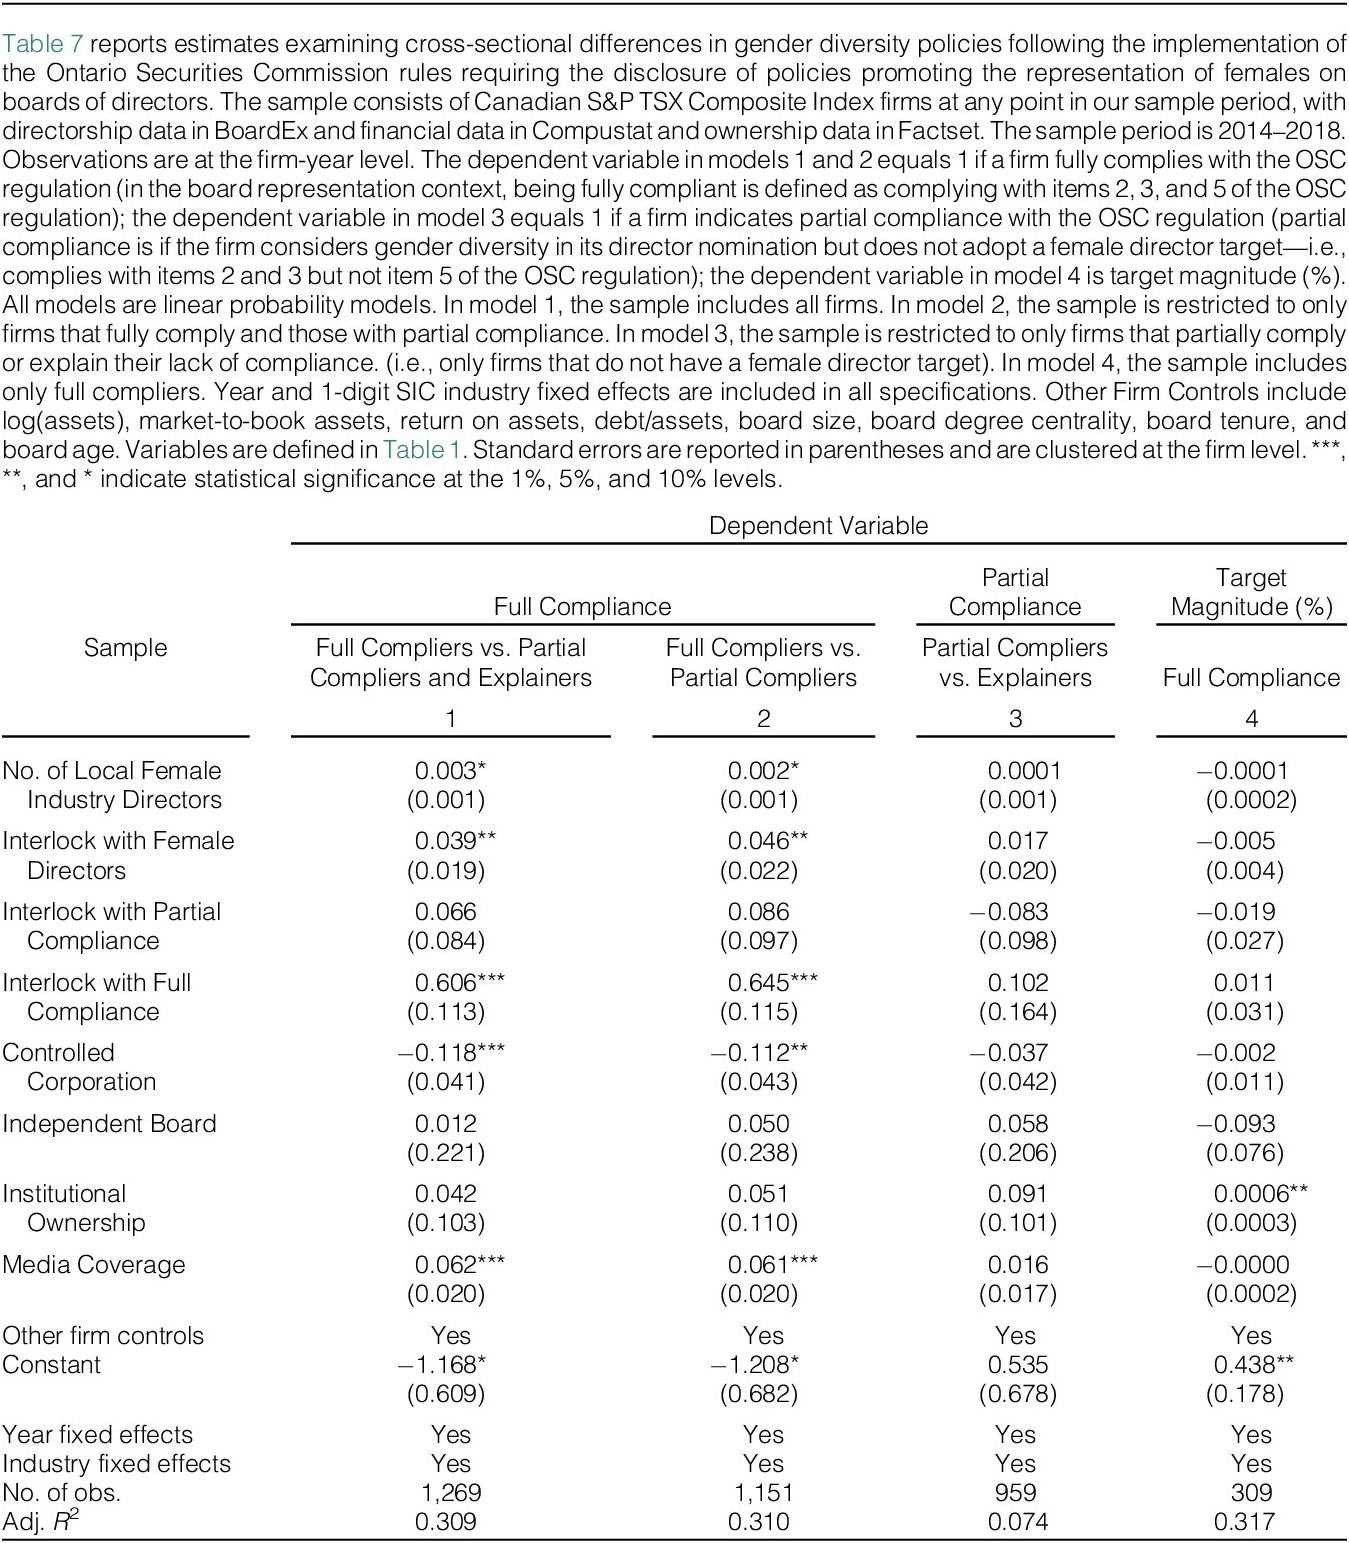
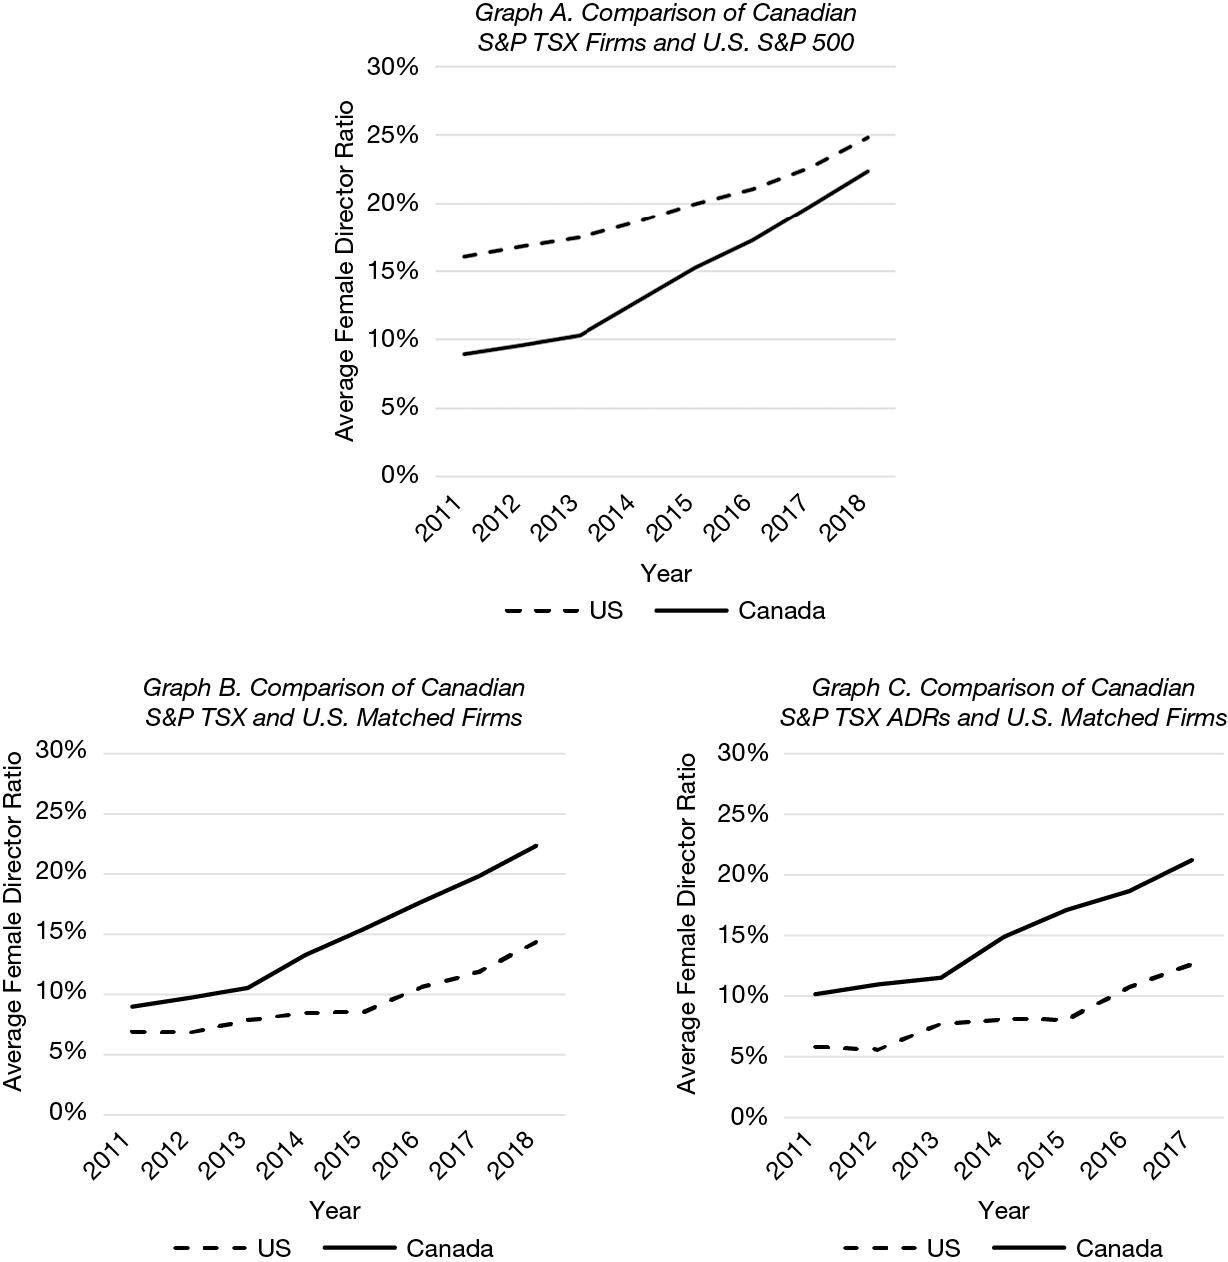
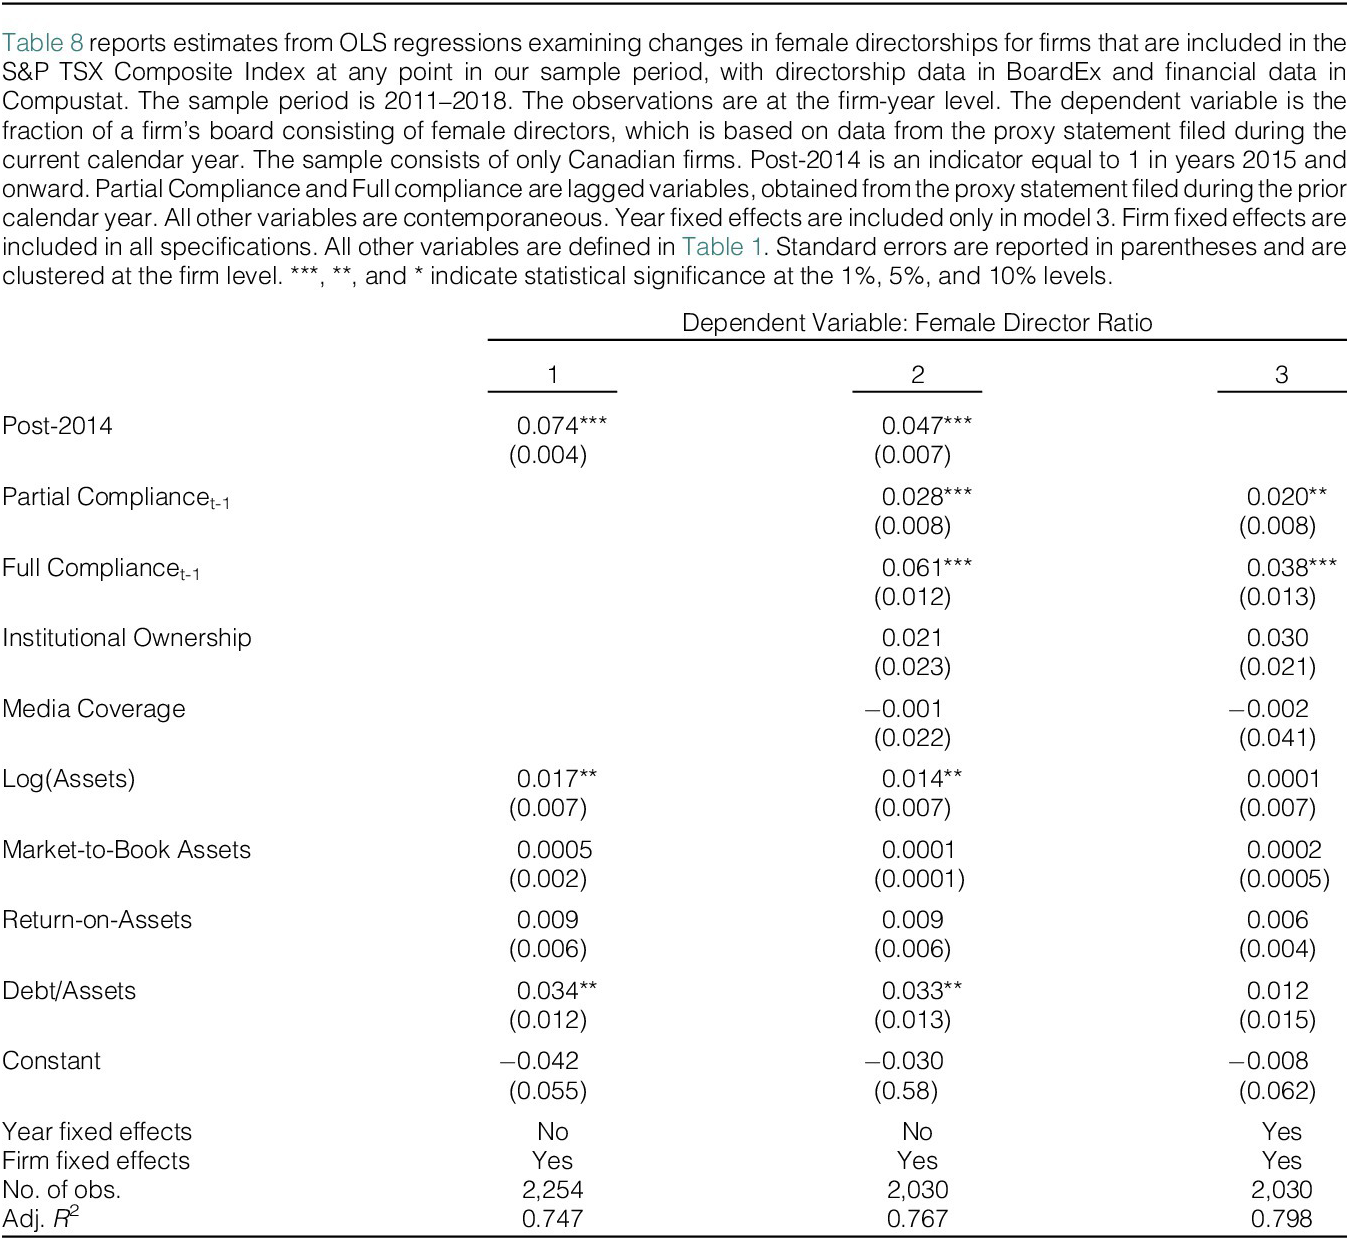
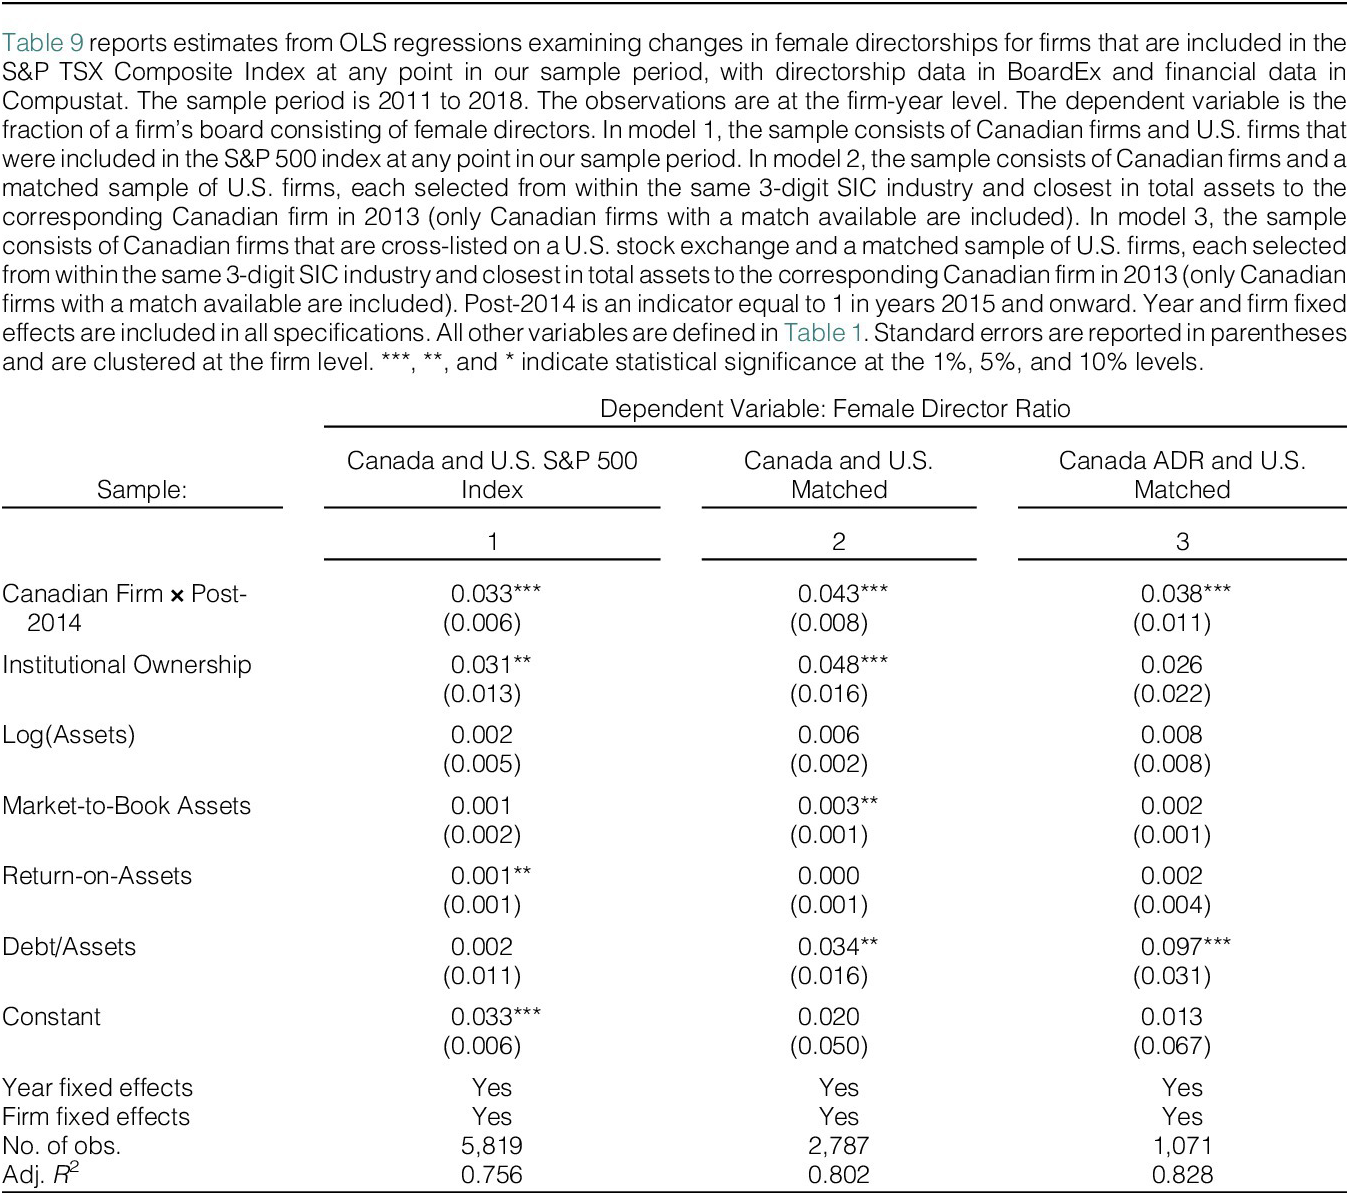



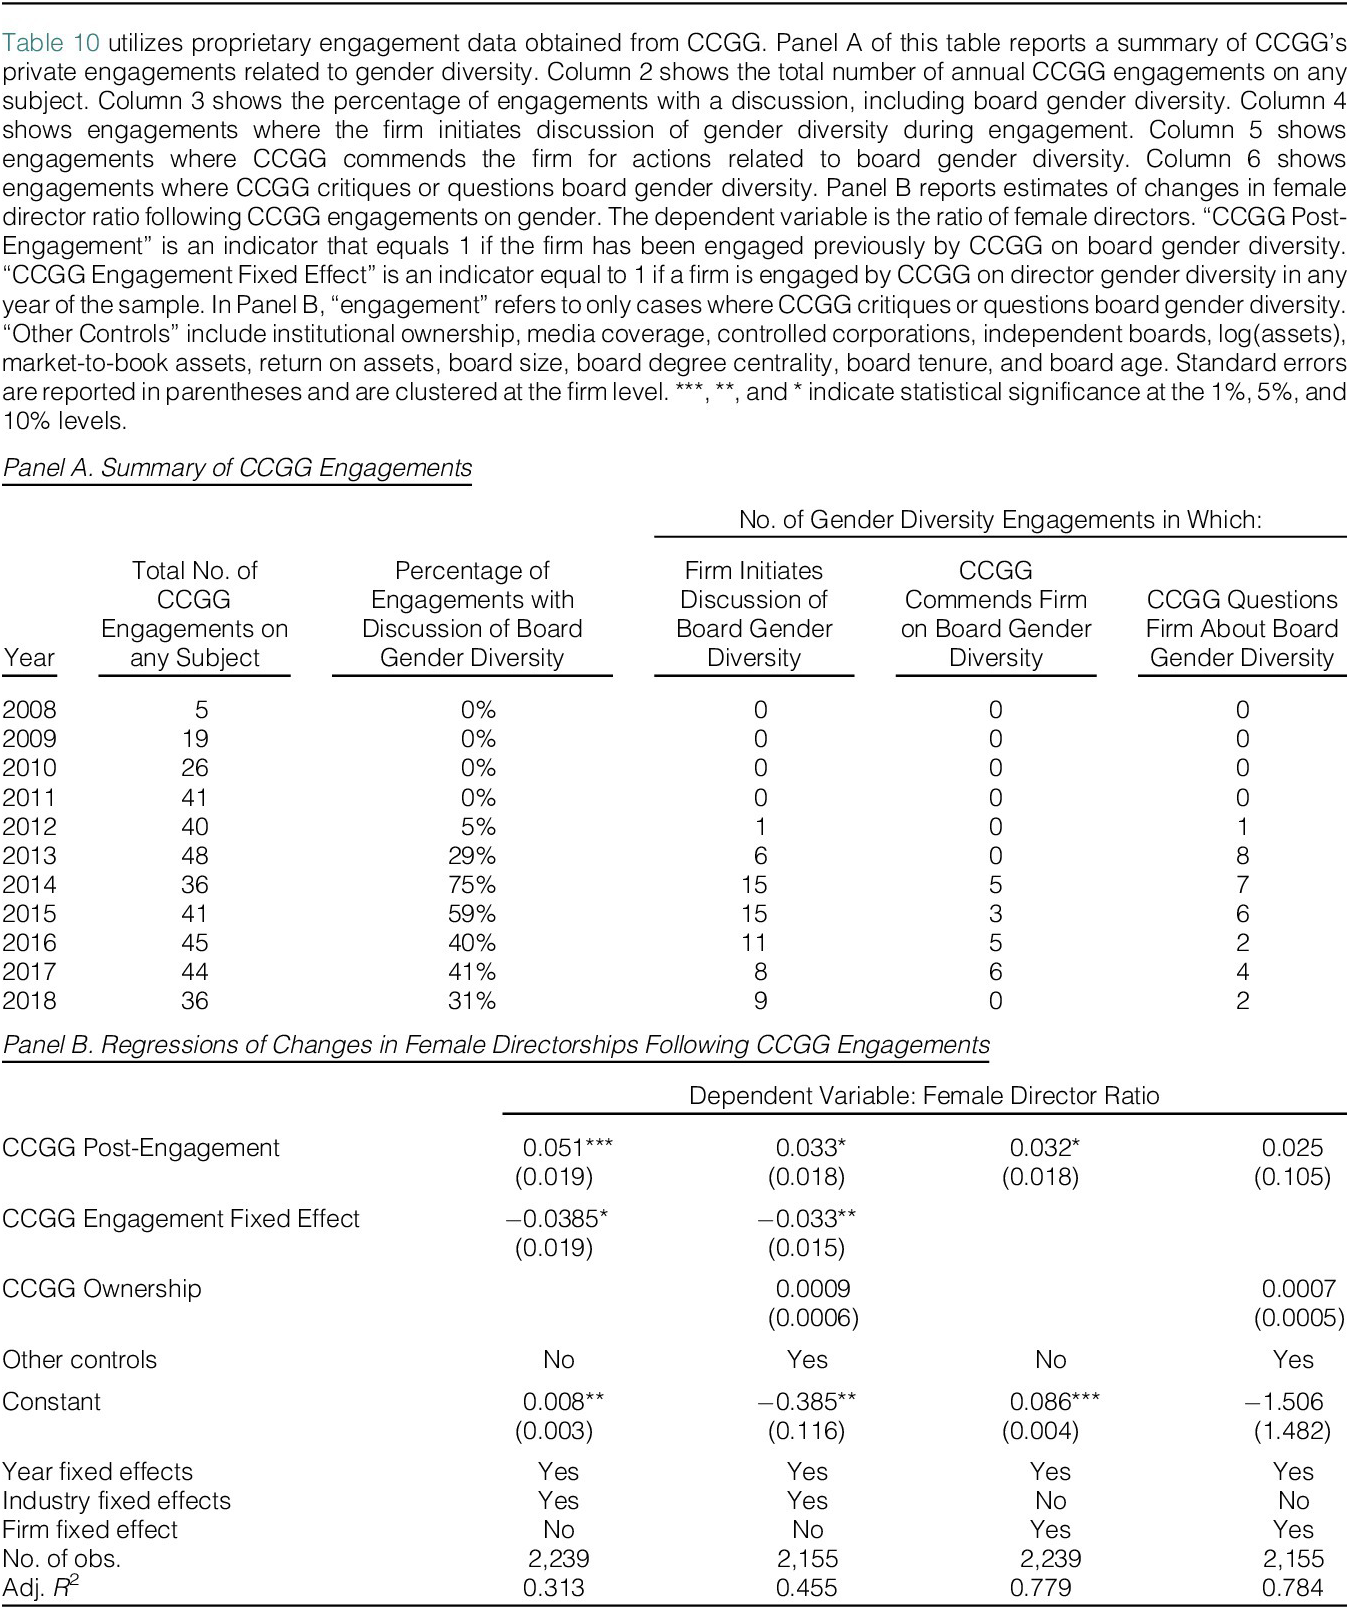
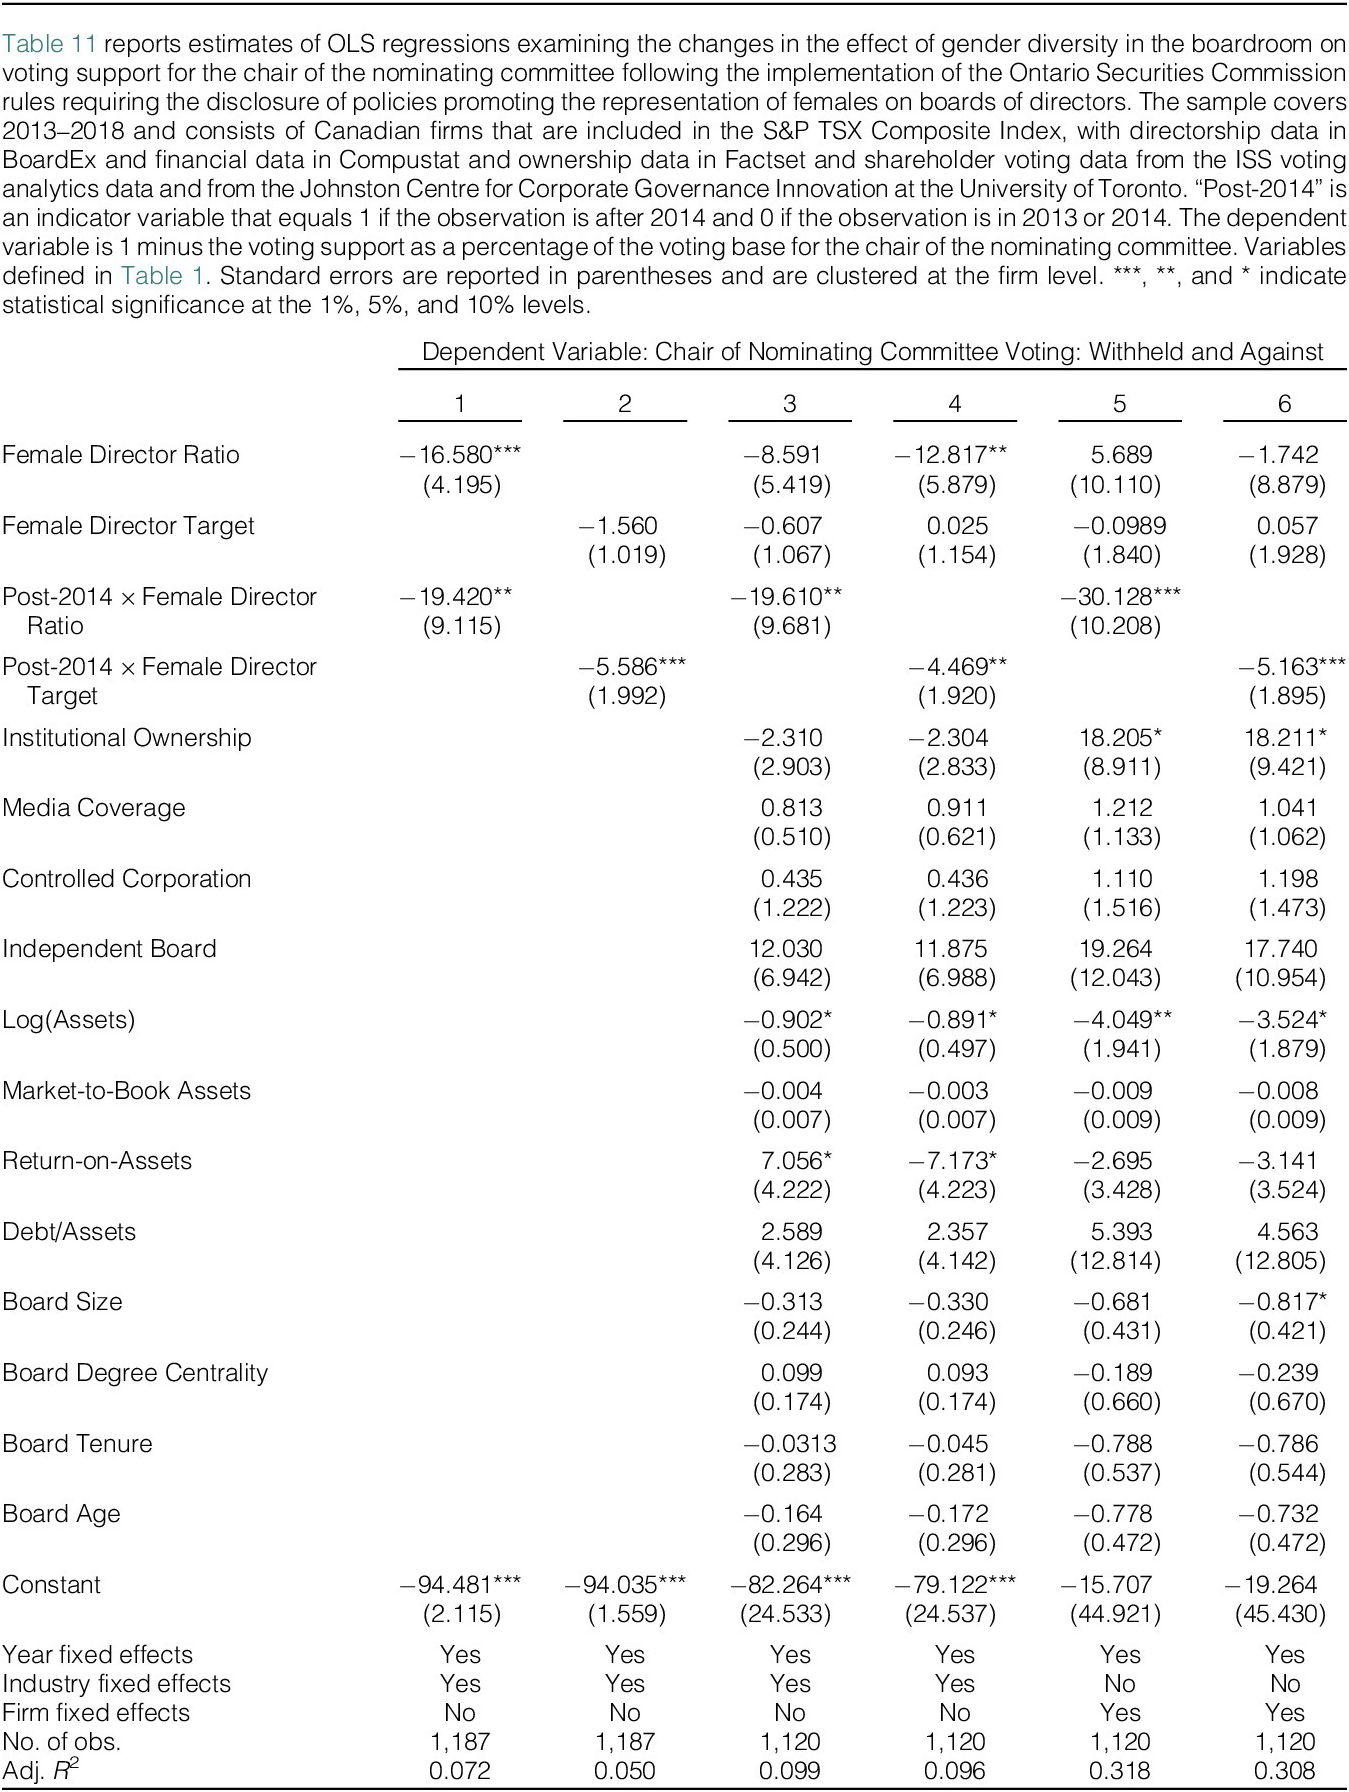
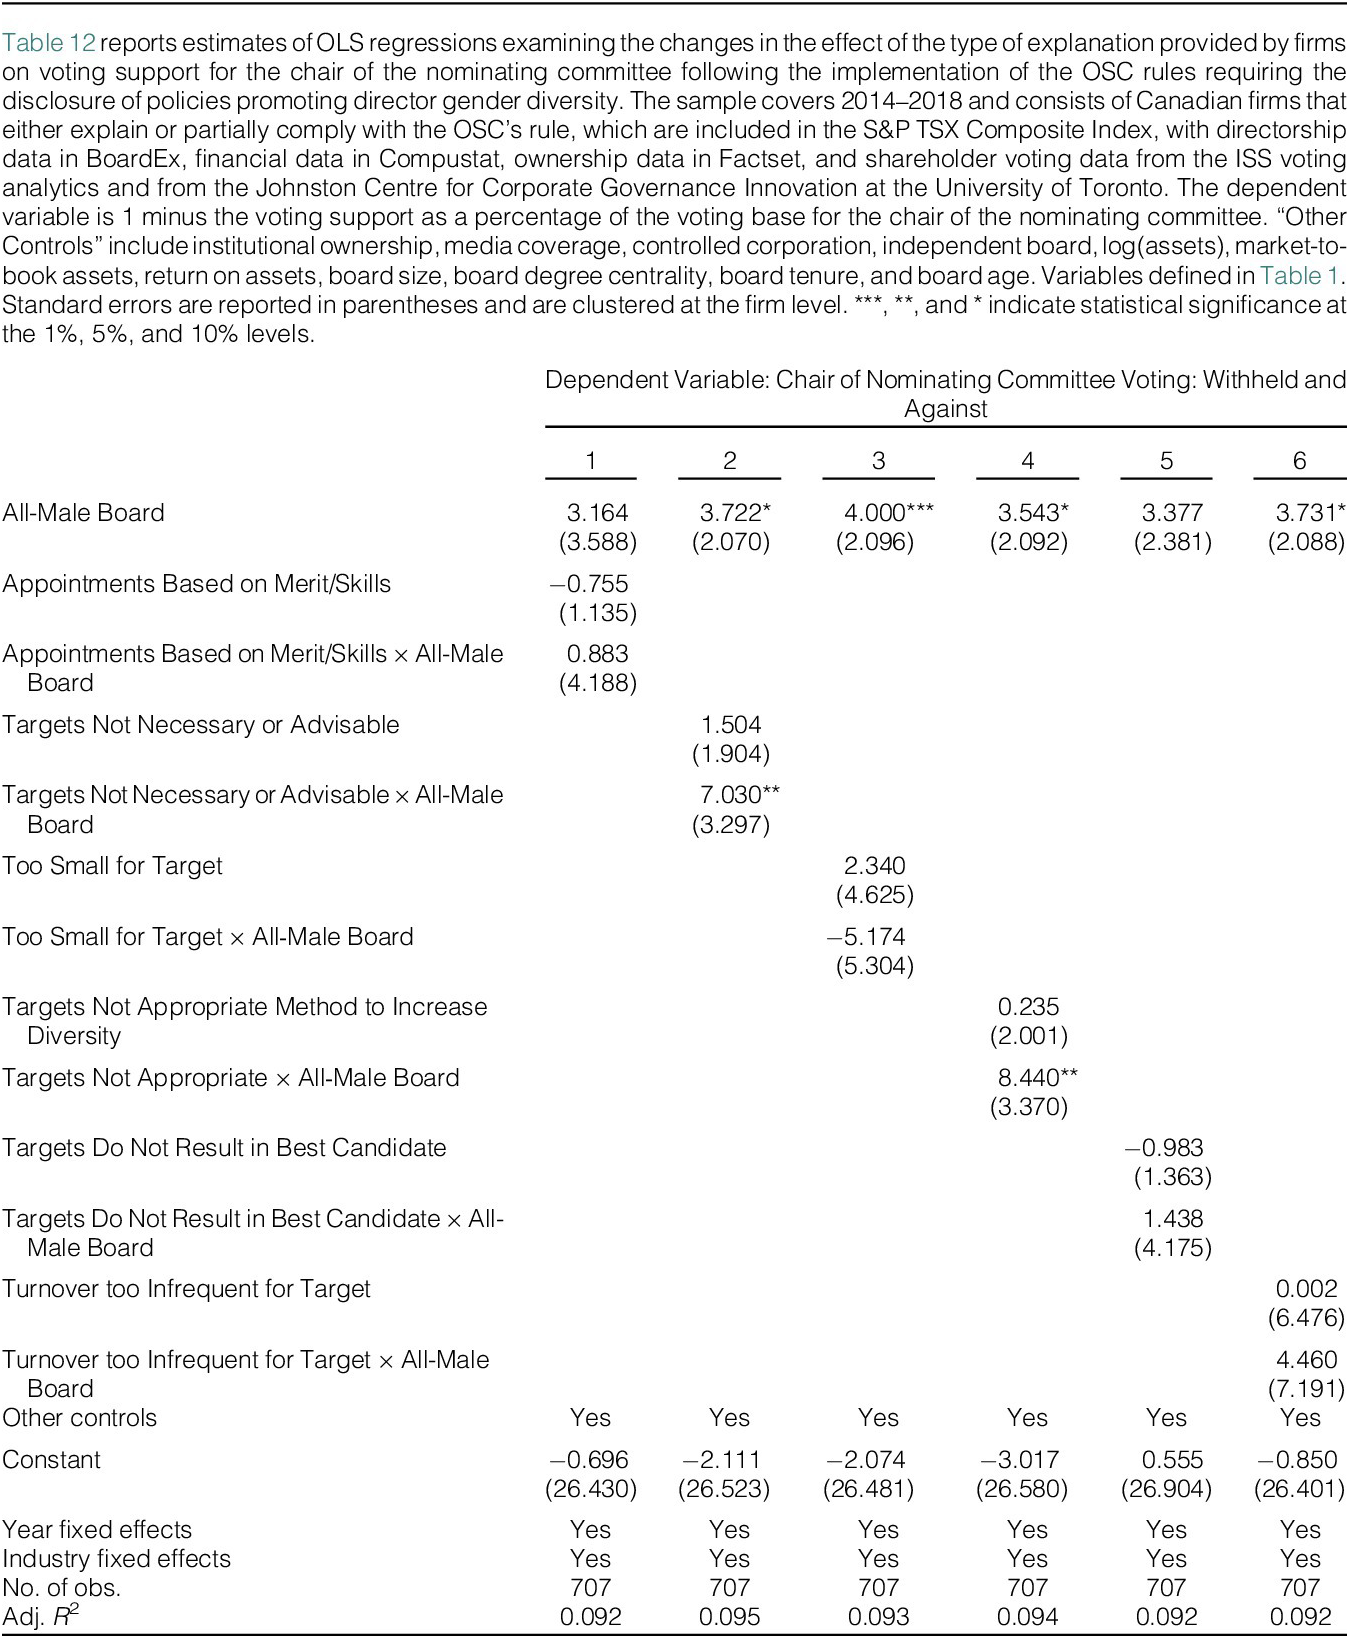


 Open access

