


Introduction
A snow avalanche is a very complex natural phenomenon which is both difficult for field observations and for modelling. Recently, mathematical modelling of avalanches has been achieved (Reference Bozhinskiy and LosevBozhinskiy and Losev, 1987). At the same time, physical modelling of avalanches has not spread due to the restricted possibilities for fulfilment of similarity criteria (Reference Bozhinskiy and SukhanovBozhinskiy and Sukhanov, 1993). However, the advantages inherent to physical modelling, because of the relative simplicity of laboratory experiments and direct measurements on avalanche parameters, has led us to try to model a snow avalanche approximately, especially powder-snow avalanches. Moreover until now, there are inadequate mathematical models for these classes of avalanche. The approximate physical modelling of powder-snow avalanches has been carried out by French researchers (Reference Hopfinger and Tochon-Danguy.Hopfinger and Tochon-Danguy, 1977; Reference Beghin and BrugnotBeghin and Brugnot, 1983; Reference Beghin and OlagneBeghin and Olagne, 1991). In these experiments, a heavy fluid was injected into a lighter one. In this paper, the powder-snow cloud is modelled with dry-powder materials.
Background of Physical Modelling
Let us consider the simplest mathematical model of a snow avalanche as a material point. The non-dimensional equation of avalanche motion has the form

where 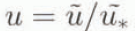 is the non-dimensional velocity of the centre of mass of the avalanche,
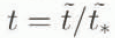 is the non-dimensional time,
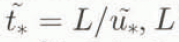 is the linear scale of the avalanche body, Fr = u*
2/gL is the Froude number, g is the gravity acceleration, α is the average slope angle, f is the coefficient of dry friction, D = κ/ρL2
is the non-dimensional form of the coefficient κ of square drag and ρ is the density of the avalanche. Quantities with a tilde are dimensional, an asterisk means the characteristic value. Using this model, one can write the similarity criteria (Reference Bozhinskiy and SukhanovBozhinskiy and Sukhanov, 1993)

where the indices n and m correspond to “Nature” and “model”.
In case of the ratio of linear scales λ = Ln/Lm for Nature and Model being given, recalculation of the basic parameters of the natural process through the model-process parameters can be made with the following formulae (Reference Bozhinskiy and SukhanovBozhinskiy and Sukhanov, 1993)

where V, M and S are respectively the volume, the mass and the run-out distance of the avalanche, accordingly to the simplest model of avalanche motion.
Criteria (2), of course, do not allow description of the propagation of the aerosol cloud but, using them, one can estimate the effects connected with the genesis of the cloud when an avalanche body enters a deceleration zone. Moreover, the geometric scale is not given but it can be found by comparing field observations of powder avalanches with the results of laboratory modelling. Thus, using the criteria (2), one can carry out approximate physical modelling of the motion of powder avalanches.
When an avalanche is modelled using powder materials, the angle of friction γm for the model material cannot coincide with the angle of friction for snow, namely, γn = γm + γ. In this case, it is necessary to fulfil an equality for a complex criterion instead of the first two criteria (2)

This complex criterion determines an acceleration or deceleration of the avalanche body. The equality (4) will be fulfilled if one can change the angle of slope on Δα = αn − αm. The analysis showed that in the first approximation Δα ≈ Δγ. Thus, the quantity α − γ can be named as the relative curvature of the avalanche path. Then, the avalanche paths with equal relative curvatures can be considered as similar and physical modelling of snow avalanches can be realized using dry materials. Consequently, the possibilities of physical modelling expand. In the experiments described below, the approximate physical modelling has been carried out in accordance with the requirement of Froude number and complex criterion (3).
Experimental Results
Set-Up for Modelling
A dry material for modelling snow avalanches with an aerosol cloud was selected experimentally by testing different dry-powder materials such as sand, cement, coal and dental powders, salt, meal, semolina, poppy corn, and so on. As a result, it was found that the mixture of ferromagnetic sawdust and aluminium dust (in a relation 20:1–10:1) is the best material. This mixture forms a remarkable aerosol cloud. The average size of particles was of order 0.1 mm for ferromagnetic sawdust and 0.01 mm for aluminium dust. The angle of friction for the mixture was equal to 35–38°. It was possible to control the cohesion of the mixture to the slope with electromagnets.
The set-up for the physical modelling was two wooden plates assembled on a table. The angle of slope can be varied. The aluminium chute of triangular cross-section is attached along the transit zone. The electromagnets were fixed beneath the lateral sides of the chute. The mixture of ferromagnetic sawdust and aluminium dust with a volume up to 2 cm3 was poured into the chute above the electromagnets and the electricity was switched off. The avalanche motion and the deposition of dense and aerosol components were observed with photo-, cine- and video-cameras.
Mechanism of Powder Cloud Generation
The first series of experiments is concerned with the generation mechanism of the aerosol-avalanche cloud. Typical cine-gram of the origin and the propagation of the model cloud is shown in Figure 1.
The cinegram of the generation and propagation of the aerosol component in a model avalanche (side view, light section; interval between frames is 0.5 s, distance between lines is 10 cm).

When an avalanche sharply decelerates, sometimes the powder-snow cloud separates from the dense-flowing layer. This has been considered by Reference GrigoryanGrigoryan (1974), Reference Grigoryan, Urumbayev and Nekrasov.Grigoryan and others (1982) and Shukhanov (1982). A huge semi-circular vortex over the dense component of an avalanche propagates in the direction of the avalanche motion (Reference Yakimov and Shurova.Yakimov and Shurova, 1968). The laboratory experiments have shown that another origin mechanism of an avalanche cloud is possible. This origin mechanism is due to compression of the model material and creation of vortices from aerosol jets. This process is similar to the hydraulic jump of fluid flow when a stormy flow (Fr > 1) changes to a calm one (Fr < 1). The flow velocity sharply decreases and the flow depth increases. In such processes, the separation of partieles according to the free-fall velocity takes place. The heavy solid phase generates the avalanche deposit. On the other hand, the powder component including air and aluminium dust is thrown away with the short-term jets, and the aerosol cloud propagating ahead is generated, as shown in Figure 2. The front of the aerosol cloud generation moves upstream.
Generation of the aerosol component for model avalanche (side view; light section, five-fold enlargement, direction of the motion from right to left).

The structure of the model aerosol cloud is characterized by the combinations of spiral arc- and ring-type vortices generated with aerosol jets. The existence time of the vortices is comparable with the time of the cloud generation but sometimes it is much higher, achieving 3 seconds and more. During this period, the vortices pass along a distance up to 10–20 cm, and create the divergent stripes of aluminium particles.
Destructive Action of the Powder Cloud
The destructive action of the powder cloud was investigated in the second series of experiments (Reference Bozhinskiy and SukhanovBozhinskiy and Sukhanov, 1995). For convenience, the deceleration zone was covered with a glass under which the black cloth was put. Thus, one can make accurate photo-images of the model process beneath side-slide illumination: dense and powder components of the model avalanche at the deposit zone. The sizes of the powder clouds at the spread zone are of the order of several decimeters. The velocities of the cloud are about 3–5 cm s−1. Thus the pressure is of order 10−3 Pa, if the cloud density is close to the air’s one. The locations of isobars for such small values of pressure have been determined using the very light markers installed across the model-avalanche path (Fig. 3a).
Locations of markers before (a) and after (b) passing of the aerosol cloud for the model avalanche; V = 1 cm3; α = 55°.

Dandelion “parachutes” were used as markers. The diameter of the dandelion’s crown and height were of order 10–12 mm. These markers correspond to trees in Nature, because the coefficient of geometric similarity of the model and real avalanche path is of order 103. One can create a whole forest using such markers. It allows us to investigate the location of the isobars under different conditions. The destructive zone due to avalanche action was determined by the location of the markers after avalanche passing (Fig. 3b). The dependency of the size of this zone in the model avalanche volume is given in Figure 4.
Average sizes L of the destructive zone for a model cloud us its volume V, α = 45°; ◊ is length S, • is width B, □ is width Bg of forest “gates”.

Comparison of Model and Real Avalanche Data
The numerical characteristics of the model avalanche obtained in the study can be compared using the scale coefficients (3) with actual snow avalanches. The “home” avalanche accompanied by a huge powder cloud was released by mortar on 23 March 1988 in the vicinity of the Elbrus station of Moscow University. The cine survey of the cloud motion and the photo-theodolite survey of the deposit-zone surface before and after the avalanche passing were made. Then, using the stereophotogrammetric processing of the values of the leading-avalanche front and the powder cloud were determined. Also, the map of the thickness for the avalanche deposit was constructed (Reference Firstov, Sukhanov, Pergament and RadionovskiyFirstov and others, 1991). The volume of the avalanche was 1.1 × 10⁴ m3, the vertical drop was 1000 m, and the average angles in the transit and deceleration zones were 36° and 10°. The initial angle of the avalanche deceleration zone was 24°. Thus, the slope angle for the model must be increased by Δγ = 14° as γm = 38°. They were assumed as αtr,m = 50° and αdec,m = 24°. The coefficient λ of the geometric similarity of the model and the real avalanche path was 2.2 × 10³. Then we can use Equations (3) to calculate the model-avalanche parameters, corresponding to the “natural” ones. We have the scales: for volumes λ3 = 1.06 × 10¹⁰, for time intervals and rates of the process λ½ = 47. The altitude of the starting point for the model avalanche has to be Hm = λ−1 (sin αm sin−1 αn) Hn = 0.59 m, because the model slope angle was changed by Δα. The scaled results from the model avalanche correspond well with the field data (see Table 1).
Comparison of data from, the model and the “home” avalanches.

Next, a three-dimensional scale model of the “home” avalanche path was constructed (scale 1:2500) (Fig. 5).
Three-dimensional model of the “home” avalanche path.

A topographic map with the 10 m contours, between 2300 and 3300 m, was used. The model was built of plywood leaves, in accordance with the location of contours. The thickness of plywood leaves was equal to 4 mm which corresponds to 10 m of altitude difference. Using this model set-up the next series of experiments was carried out using a line river sand as a model material. The model characteristics recalculated to “Nature”, with a scale of coefficients to similarity (3), were in good agreement with the parameters of the “home” avalanche.
From Figure 6, one can see that the qualitative velocity changes for the leading front are generally the same for both avalanches. The discrepancies of absolute values of velocities on the same path intervals do not exceed their local fluctuations. The deceleration of the model and “home” avalanches also begins at the same zones in the vicinity of 2340 m. At this level, the slope angle, for the real slope, changes from 27° to 20°, passing through the value of the friction angle for snow which is equal to 24°. The leading fronts of deposit for the model and “home” avalanches practically agreed and the volumes and locations of deposits are the same. It should be noticed that deposits of the model material are almost independent of the initial distribution of the material in the starting zone and at the height of the starting point. Probably, this effect is due to the deep (15 m), narrow (12 m) and winding rock channel which restricts the velocity of the avalanche. A powder cloud was also observed in these experiments. Sizes, velocities and run-out distances of this cloud are similar to the analogous data of clouds generated by aluminium dust. However, the density of this cloud is very-low. Visible deposits of the aerosol are weak. Probably, in this case, the model cloud has been formed from fine dust-loamy particles involved in the dry sand. The artificial addition of aluminium dust to the sand allows us to use the same powder cloud as in the first experiments.
Measured velocity of leading front for “home” avalanche (◊) and model velocity recalculated to “Nature” (•) vs horizontal distance of retardation zone.

On the whole, physical modelling of avalanches, using the three-dimensional model set-up, gives results which are close to the results of modelling when the simplest model set-up was used. However, modelling on three-dimensional models of actual avalanche paths is preferable, because it is possible to achieve space distributions of the avalanches and to estimate the destructive action of the avalanches.
Conclusions
The experiments in this study have proved the possibility of physically modelling snow avalanches with dry-powder materials. Modelling both dense avalanches and avalanches accompanied with powder clouds is possible. Criteria of similarity have allowed us to scale the parameters of the model avalanche to the “natural” ones. It is possible to estimate the destructive action of powder avalanches, using the physical model. In future, it would be desirable to model, in the laboratory, powder avalanches for which there are good field measurements.
Acknowledgement
This paper was supported by the Russian Fund of Basic Researches, grant No. 96-05-64189.



