


INTRODUCTION
Characterizing animal spatial patterns, and locating zones of increased activity as well as areas of higher density are important for the understanding of many ecological processes, including disease transmission (Smith Reference SMITH2006), behavioural interactions (Lortie et al. Reference LORTIE, ELLIS, NOVOPLANSKY and TURKINGTON2005) and ecosystem functioning (Maestre et al. Reference MAESTRE, ESCUDERO, MARTINEZ, GUERRERO and RUBIO2005). Aggregation and distributional heterogeneity are two commonly observed ecological patterns. Indeed, distributions of organisms can be very uneven, with high concentrations of individuals in localized ‘hotspots’ that are largely due to variation in feeding preferences, ranging or roosting intensity (Brown et al. Reference BROWN, MEHLMAN and STEVENS1995). Ideally, population surveys should therefore provide more information than just an estimate of individual density or abundance.
Because of the limited visibility in tropical forests, surveys of elusive species, such as the chimpanzee (Pan troglodytes, Blumenbach 1779), often rely on counts of specific indirect signs, namely, sleeping nests (Plumptre & Reynolds Reference PLUMPTRE and REYNOLDS1996). Chimpanzees are territorial and form social groups that range in size from a few individuals to more than 150 (Mitani Reference MITANI2006, Teleki et al. Reference TELEKI, HUNT and PFIFFERLING1976). Estimating and locating chimpanzee home ranges across a landscape is important because the composition of home ranges in a landscape has important implications for infectious diseases and cultural trait transmission (Leendertz et al. Reference LEENDERTZ, PAULI, MAETZ-RENSING, BOARDMANE, NUNN, ELLERBROK, JENSEN, JUNGLEN and BOESCH2006, Nunn et al. Reference NUNN, THRALLD, BARTZE, DASGUPTAE and BOESCH2009), and interactions with neighbouring groups (Benadi et al. Reference BENADI, FICHTEL and KAPPELER2008). It is also important as it increases our understanding of population status and dynamics (Gordon Reference GORDON1997, Lopez-Sepulcre & Kokko Reference LOPEZ-SEPULCRE and KOKKO2005).
However, previous efforts to identify distinct social units have usually required habituating each chimpanzee group to human observers, which is a lengthy process that typically takes 5–7 y to complete (Boesch & Boesch-Achermann Reference BOESCH and BOESCH-ACHERMANN2000). The development of alternative approaches to rapidly identify and locate neighbouring social groups across a landscape is therefore an interesting avenue to pursue.
In this study, we tested whether spatial nesting patterns as determined from transect surveys could be used to identify different neighbouring chimpanzee groups. Given the territorial and daily nesting behaviours of chimpanzees associated with their coalitional aggression towards conspecifics of neighbouring groups (Boesch et al. Reference BOESCH, CROCKFORD, HERBINGER, WITTIG, MOEBIUS and NORMAND2008, Watts et al. Reference WATTS, MULLER, AMSLER, MBABAZI and MITANI2006), we hypothesized that nesting activities leave distinct spatial patterns across a landscape. For example, sleeping and feeding activities are thought to be concentrated in the core areas of groups and away from home-range borders (Quiatt & Huffmann Reference QUIATT and HUFFMANN1993). The spatial distribution of chimpanzee nests should thus contain enough information to discriminate between neighbouring groups and to determine the number of home ranges in an entire area. However, little is known about the spacing between nest sites of different groups (James Reference JAMES2009).
The multiple habituated chimpanzee groups in Taï National Park, Côte d'Ivoire, offer a unique opportunity to validate approaches used to locate home ranges of neighbouring social groups from transect nest counts. First, we evaluated within-home-range heterogeneity of nesting-site properties, including nest density, nesting height and the size of nest-group (the number of nests built by several chimpanzees at a particular location for one night). Assuming that sleeping-site preferences reflect territorial behaviour and avoidance of aggression from neighbouring groups to some extent, we predicted that both the size of nest-group and nesting height would increase with decreasing proximity to the home-range borders of neighbouring communities. Alternatively, to minimize travel costs (Chapman et al. Reference CHAPMAN, CHAPMAN and MCLAUGHLIN1989, Wilson et al. Reference WILSON, HAUSER and WRANGHAM2007), chimpanzees more often perform their primary activities, including foraging and sleeping, in central parts of their home ranges. Thus, we expected to find lower nest densities and encounter rates closer to the periphery of a given group's home range. Second, we applied descriptive and analytical techniques to evaluate whether neighbouring social groups of chimpanzees could be determined by their nest-site distribution pattern and densities. We applied spatial scan statistics, a likelihood-based clustering technique that was originally developed for detecting clusters of disease cases in epidemiological data (Kulldorf Reference KULLDORF1997, Kulldorf & Nagarwalla Reference KULLDORF and NAGARWALLA1995).
MATERIALS AND METHODS
Study site
The study was conducted between August 2003 and January 2007 in Taï National Park in south-western Côte d'Ivoire (Figure 1a). This park is one of the last major remnants of continuous primary tropical forest in West Africa. Details of the location, climate, flora and fauna can be found elsewhere (Bousquet Reference BOUSQUET1978, Riezebos et al. Reference RIEZEBOS, VOOREN and GUILLAUMET1994). Our study covered an approximately 100-km2 area located in the west of the park (Figure 1b), where long-term studies of chimpanzee groups are carried out by the Taï Chimpanzee Project (TCP) (Boesch & Boesch-Achermann Reference BOESCH and BOESCH-ACHERMANN2000). Three neighbouring groups of the western chimpanzee (Pan troglodytes verus, Schwarz 1934) are habituated to human observers. At the time of this study, a fourth group (East group) was in the process of habituation. Each of the four chimpanzee social groups, referred to as the North, Middle, South and East group, performs and restricts their normal activities to a ‘home range’ (Boesch et al. Reference BOESCH, KOHOU, NENE and VIGILANT2006, Burt Reference BURT1943).
Map showing Côte d'Ivoire with the location of Taï National Park where this study was conducted (a) and the home ranges of chimpanzee in the park (b).

Sampling methods
Direct observations were used to determine the specifics of each of the four chimpanzee home ranges. This involved TCP field assistants following habituated and semi-habituated individuals daily from dawn to dusk during the study period. Observers kept a minimum distance of 7 m between themselves and the chimpanzees to prevent disease transmission (Boesch Reference BOESCH2008, Leendertz et al. Reference LEENDERTZ, PAULI, MAETZ-RENSING, BOARDMANE, NUNN, ELLERBROK, JENSEN, JUNGLEN and BOESCH2006). As has been done since 1984 (Lehmann & Boesch Reference LEHMANN and BOESCH2003), daily travel routes and sleeping site locations were recorded manually on grid maps containing 500 × 500-m cells with X/Y coordinates referring to individual cells.
We used a systematic survey approach to count nests along 400-m-long transects that were spaced 400 m apart, across the four chimpanzee home ranges (Kouakou et al. Reference KOUAKOU, BOESCH and KUEHL2009). We located 233 transects in the field using a map, a GPS (Global Positioning System) receiver containing all transect locations, and a compass. Transects were visited four times to find chimpanzee nests, applying both the SCNC and the marked-nest count (MNC) methods (Plumptre & Reynolds Reference PLUMPTRE and REYNOLDS1996, Tutin & Fernandez Reference TUTIN and FERNANDEZ1984). The SCNC method requires only a single transect passage and the derived density estimate is based on all nests encountered independent of age (Tutin & Fernandez Reference TUTIN and FERNANDEZ1984). The MNC method requires repeat passages to record only freshly built nests for estimating density (Hashimoto Reference HASHIMOTO1995, Plumptre & Reynolds Reference PLUMPTRE and REYNOLDS1996). During the first visit to each transect, all nests encountered were marked with a coloured flag on the nearest shrub. In addition, an identification code was put on the nesting tree to avoid recounting the nest during subsequent passages. For the MNC, we revisited each transect three times at 2-wk intervals and recorded freshly built nests during each passage. To avoid double counting of nests built during these intervals, each detected nest was marked. For all visits, we recorded nests following standard distance-sampling techniques along line transects (Buckland et al. Reference BUCKLAND, ANDERSON, BURNHAM, LAAKE, BORCHERS and THOMAS2001). More specifically, we measured perpendicular distances from each nest detected to the transect line and recorded the nest-group size, nest age class and nest height above the ground.
Data analysis
To estimate the location and size of a chimpanzee social group range, we initially used the Didger version 3.05 software (Golden Software, Inc., Colorado, USA) to precisely convert the field maps into a versatile digital format. Once the maps had appropriate geographic references, we carried out all mapping analysis using the Geographic Information System software ArcGIS 9.2 (Environmental Systems Research Institute, Redlands, USA), with the extension module Hawths Tools. For comparison, we used the Minimum Convex Polygon based on 95% of daily range locations (MCP 95%) as well as the fixed kernel density estimation to generate home-range sizes of the social groups of chimpanzee (Herbinger et al. Reference HERBINGER, BOESCH and ROTHE2001, Mohr Reference MOHR1947, Seaman & Powell Reference SEAMAN and POWELL1996). More specifically, core areas or areas of intensive use, were defined using the kernel contour line that included 50% of the nesting-site locations or daily ranges for each chimpanzee group (Kouakou et al. Reference KOUAKOU, BOESCH and KUEHL2009).
To estimate densities of chimpanzee nests in the entire area, perpendicular distances to each nest were used to perform analyses with the Distance 5.0 program (Devos et al. Reference DEVOS, SANZ, MORGAN, ONONONGA, LAPORTE and HUYNEN2008). We followed Buckland et al. (Reference BUCKLAND, ANDERSON, BURNHAM, LAAKE, BORCHERS and THOMAS2001) to estimate densities of nests ( ), which were calculated as follows:

Where n is the number of nests detected in the surveyed area a with a = 2wL; L is the total length of transect lines or survey effort and w is the distance from transect line beyond which no nests were detected; and  is the probability that a randomly chosen nest within the surveyed area a is detected.
 is the probability that a randomly chosen nest within the surveyed area a is detected, with g(x) being the detection function or the probability that an object at distance x from the transect is detected (Buckland et al. Reference BUCKLAND, ANDERSON, BURNHAM, LAAKE, BORCHERS and THOMAS2001, Thomas et al. Reference THOMAS, BUCKLAND, BURNHAM, ANDERSON, LAAKE, BORCHERS, STRINDBERG, El-Shaarawi and Piegorsch2002).
To evaluate whether nest location (i.e. distance to home-range periphery) influenced the height at which nests are constructed and nest-group size, we performed a Generalized Linear Mixed Model (GLMM) analysis (Faraway Reference FARAWAY2006). For each dependent variable (nest height, nest-group size), we plotted the distance from each nest location to the home range boundary and the values of the given variable to visually check that the data were normally distributed. We then ran a model that included ‘distance to home-range limit’ as predictor variable. We also included territory (North, Middle, South and East) as a fixed-effect variable to account for possible differences between different social groups. In the model evaluating nest height as dependent variable, we incorporated ‘group size’ and ‘tree family’ as random effects. In the group-size model we included ‘nest height’ and ‘tree family’ as the random effects. We also added an autocorrelation term to each model to account for non-independence of nest locations in our dataset. We derived residuals for the nest-height and nest-group-size models and incorporated an inverse distance-weighted average of the residuals as autocorrelation terms into the models.
To test for the ‘distance to range limit’ effect, we compared the fit of the full model with that of a reduced model (i.e. with ‘distance to range limit’ removed) using a likelihood ratio test (Dobson Reference DOBSON2002). We performed all analyses using the software R version 2.9.1 (R Foundation for Statistical Computing, Vienna, Austria), with the associated package nlme4, which provides functions for linear and non-linear mixed-effect models.
To assess whether nest locations sampled during transect surveys would exhibit a clustered structure at the scale of the four chimpanzee home ranges, we used both non-geostatistical methods as well as analytical methods for spatial statistics. Nest clusters were defined as unusual aggregations of points that are grouped in space. Consequently, the clumped distribution referred to the situation where distance between neighbouring points is minimized (Dematteï et al. Reference DEMATTEÏ, MOLINARI and DAURÈS2007). For the purposes of this analysis, each nest location was considered as a point with geographic coordinates (longitude, latitude).
First, for the non-geostatistical approach, we performed spatial analysis using the deterministic interpolation method of Inverse Distance Weighted (IDW), assuming that the influence of a known data point is inversely related to the distance from the unknown location that is being estimated (Azpurua & Dos Ramos Reference AZPURUA and DOS RAMOS2010, Li & Heap Reference LI and HEAP2008). We overlaid a grid with 500 × 500-m cells to the entire survey area. We then assigned the number of nests derived from daily focal follows as well as from transect-survey-derived densities to each cell. The observed densities of nests from sampled points were run in ArcGis 9.2 to predict unknown values of densities for any geographic location within the survey area. The interpolation method of IDW allowed the efficient description of spatial patterns in a survey region that included unsampled areas (Azpurua & Dos Ramos Reference AZPURUA and DOS RAMOS2010).
Second, to identify and locate spatial clusters of nests and to test for their significance, we applied spatial scan statistics, which are commonly used for geographical disease surveillance and cluster detection (Kulldorf Reference KULLDORF1997, Kulldorf & Nagarwalla Reference KULLDORF and NAGARWALLA1995, Warden Reference WARDEN2008). These spatial statistics were computed using the SaTScan V8.1.1 software (The National Cancer Institute, and Farzad Mostashari of New York, USA). Briefly, the scan statistics consists of using a variable number of different-sized circular windows, which are moved gradually across the study area. For each window location and size, SaTScan calculates the number of observed and expected observations inside the window and, in turn, calculates the likelihood function for each window, the form of which differs depending on the assumed distribution of events (Kulldorf Reference KULLDORF1997, Warden Reference WARDEN2008). Observed events (i.e. in the different windows) are assumed to be generated from a distinct process (e.g. Poisson or Bernoulli). This procedure is repeated many times for each region of the study area in order to identify a set of clusters, for which the likelihood is maximized. In our study, we fitted two models to the data using maximum likelihood estimation: one assumed a Poisson distribution of the response variable, i.e. raw nest count data, and the other assumed a Bernoulli distribution, transforming raw nest counts per transect into presence-absence data.
After testing for statistically significant clusters, we wanted to know whether these areas corresponded to the known territories. To determine this, we superimposed start and end points of transects located in each cluster onto a map containing the kernel density estimation (KDE) for the four chimpanzee study groups.
RESULTS
Chimpanzee home ranges
The size of chimpanzee home ranges varied among social groups and with the method used for the estimates (Table 1). For instance, the East group had the largest home range (30.1 km2) while the Middle group had the smallest (9.7 km2). The sizes of the North and South group home ranges were 15.0 km2 and 26.5 km2, respectively, when using the KDE method. Thus, the cumulative size of the home ranges used for nesting by the four chimpanzee social groups was 81.3 km2. Core-area size also varied, with the North, Middle, South, and East group having 4.3 km2, 2 km2, 9.2 km2 and 7 km2, respectively. The home ranges of each chimpanzee social group and their core areas are indicated by 95% KDE and 50% KDE, respectively (Figure 2).
Estimated home-range sizes for each chimpanzee social group during the study period at Taï National Park. Home-range sizes as well as numbers of points referring to nest site locations from daily focal follows of chimpanzees vary with the social group. MCP and KDE correspond to the estimates of home-range sizes using the methods of minimum convex polygon and kernel density estimation, respectively.

Spatial interpolation of observed nest densities derived from the detection of nests during daily follows of chimpanzees (a) and during transect surveys (b) at Taï National Park. KDE corresponds to the kernel density estimation used as method for estimating the limits of the home ranges of chimpanzee.

There was an average of 18, 4 and 33 weaned individuals in the North, Middle and South groups during the study period respectively. In the East group, there were estimated to be 25 weaned individuals. Furthermore, we observed 759 nest site locations from daily focal follows throughout the home ranges of the habituated groups and 264 when following individuals from the East group (Table 1).
Spatial heterogeneity of nest distribution within the home ranges
Transect surveys took place over a period of 188 d and the total distance covered was 373 km. We recorded a total of 683 nests in 198 nesting groups throughout the sampled transect. We detected 411 nests during the first transect passage corresponding to the standing-crop nest count. For the entire survey area, the estimated detection probability of nests was 0.71 (calculated using Distance 5.0). We found a significantly higher number of nests encountered per distance walked on transects farther away from the home-range borders with an estimated coefficient (SE) of 0.37 (0.15), likelihood ratio test: χ2 = 48.2; df = 1, P < 0.02.
We detected a total of 457 nests in 112 groups, which represents 66.9% of all nests built in the core areas. Furthermore, we found that only 2.32% of the total detected nests were built less than 50 m from the nearest home-range boundaries, and only 5% of the nests were built less than 200 m from boundaries. The observed densities of individual nests in the core areas were 121 nests km−2, whereas 28.8 nests km−2 were found in the other areas of the home ranges (areas delineated by 95% KDE excluding core areas).
We found 21 nests in the largest group of nests and the average nest-group size or sleeping-party size (calculated using only fresh and recent nests) was 4.55 weaned individuals in core areas and 3.12 weaned individuals in peripheral areas. The fit of the full model compared with that of the reduced model was similar when using nest height as dependent variable (Table 2). Indeed, the results from GLMM analysis indicated that the difference in AIC values of the two models was not larger than two units. However, in the models with nest-group size as dependent variable, the full model fitted the data better (AIC = 1465) than the reduced model (AIC = 1772). Nest-group size increased with increasing distance from home-range boundaries (Distance-HRB). The coefficient of parameter estimate of Distance-HRB in the full model with the associated SE was 0.00033 ± 0.000019; likelihood ratio test: χ2 = 309; df = 1, P < 0.001. However, the coefficient of parameter estimates for fixed effects from North, Middle and South group are 1.93 ± 1.15; 3.94 ± 0.00 and 1.37 ± 0.96, respectively.
Summary statistics from GLMM analysis with nest-group size and height of nest used as dependent variables for the evaluation of chimpanzee nest distances to home-range boundaries (Distance-HRB) at Taï National Park. The models used (1: Tree_Family) and (1: Nest group) as random effects controlling for the possible influence of tree type and nest group, respectively. Nest-group size refers to the number of nests built by several chimpanzees at a particular location for one night. AIC: Akaike's Information Criterion; df: degree of freedom; autocorrelation: autocorrelation term; logLik: log likelihood. The P-value refers to the comparison of the full model with the reduced model. Only coefficient of parameter estimates (mean ± SE) for fixed effects from the North group is given to facilitate the reading of the table.
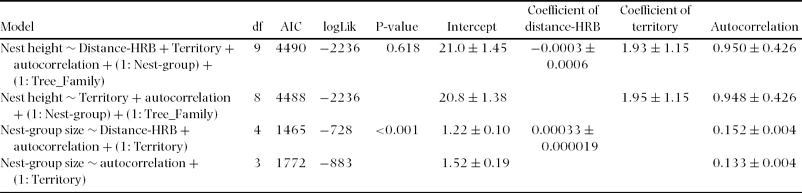
The estimated overall mean height above ground of the 683 nests observed on transects was 23.2 m. Nest heights were not influenced by the ‘distance to range limit’; likelihood ratio test comparing the full model with one excluding nest-group size: χ2 = 0.248; df = 1, P = 0.618.
Spatial heterogeneity of nest distribution between the home ranges
Spatial interpolation analyses of chimpanzee nest density from daily focal follows indicated that the distribution of nests varied in space and they revealed distinct high-density areas across the study site (Figure 2a). These areas with highly clumped distributions encompassed more than 28 nests km−2 and they were localized in the core areas of the home ranges. The respective home ranges of the North, Middle and East groups contained few areas with very dense nest distributions. The South group contained larger areas with more than 28 nests km−2. In peripheral areas of the home ranges, nests tend to be more dispersed and the densities in these areas are less than 4 nests km−2. The same approach applied to transect nest counts gives a very similar, although less pronounced spatial pattern (Figure 2b). However, we found that the area with the highest densities of nests was between the East and South group home ranges. Furthermore, the results from the spatial interpolation did not provide any insight into the pattern observed.
When we applied a scan statistics approach to the data derived from the marked nest-counts, we detected four and five distinct clusters with the Poisson (Table 3; Figure 3a) and Bernoulli model (Table 3; Figure 3b), respectively. Although the Poisson model detected four significant clusters across the study area, they do not precisely match the location of the four study groups. In particular, the North and Middle groups were contained in one cluster and two of the four clusters were located in the East group's home range, with one of these identified in the peripheral areas. We observed equally significant P-values (P < 0.001) for all significant clusters detected (Table 3). In contrast, the clusters detected by the Bernoulli model match the geographic locations of the four chimpanzee home ranges nicely. However, this model also identified a fifth cluster corresponding to areas with low nest densities in peripheral areas and between social groups (South and East groups). We observed 36 nests in this fifth cluster, for which P = 0.009 (Table 3).
Results of spatial scan statistics applied to transect nest counts at Taï National Park. Different lower-case letters indicate the four and five significant spatial clusters of nests found from data analysis using the Poisson model and the Bernoulli model, respectively.

Home ranges of chimpanzee groups from Taï National Park and locations of clusters estimated using spatial scan statistics using Poisson model (a) and Bernoulli model (b). KDE corresponds to the kernel density estimation used as method for estimating the limits of the home ranges of chimpanzees.

Using only nest data from standing crop counts (one transect passage), both the Poisson and the Binomial models detected no significant clusters.
DISCUSSION
In this study, we have characterized the spatial pattern of nest distribution within chimpanzee home ranges and evaluated an approach for identifying neighbouring social groups from nest counts during transect surveys. The spatial heterogeneity of nest distribution within chimpanzee home ranges is characterized by positive density gradients away from the range limits and with higher densities in the core areas, which reflects chimpanzee social behaviour and activity patterns. However, in contrast to our predictions, nest-group size increased with increasing distance from the territory boundary. Some chimpanzee activities, such as patrols of the peripheral areas of the home ranges, are thought to be performed only by male individuals (Boesch & Boesch-Achermann Reference BOESCH and BOESCH-ACHERMANN2000, Wilson et al. Reference WILSON, HAUSER and WRANGHAM2007). Thus, such a restriction may reduce the number of individuals building nests at a group's boundaries. The main finding of our study is that the information above can be analysed further using spatial statistics, such as scan statistics, to identify and locate chimpanzee social groups from repeated transect nest counts.
Our inability to identify clusters when we included all nests that we had encountered on transects and our successful cluster identification when we included only recently built nests require further explanation. Recently built nests from four transect passages represent chimpanzee habitat use over approximately the last 2 mo. Assuming that chimpanzee social groups push themselves apart in space as a consequence of their territorial behaviour, this type of data seems to contain enough information for clustering nest locations according to the existing social groups (Boesch et al. Reference BOESCH, CROCKFORD, HERBINGER, WITTIG, MOEBIUS and NORMAND2008, Wilson et al. Reference WILSON, HAUSER and WRANGHAM2007).
However, using nests of all ages integrates chimpanzee habitat use over a much longer period of time. Chimpanzees use different parts of their territory with different frequencies during the year; thus, nest distribution becomes much more even. Additionally, spatio-temporal variation in nest decay might further degrade between-territory differences. Consequently, these data apparently do not contain enough spatial cluster information to successfully discriminate between different groups. Other sampling techniques, such as camera trapping or passive acoustic recording, can provide information on chimpanzee home-range use with even higher temporal resolution than the MNC method. Therefore, it is very likely that these techniques would identify social groups even better. However, difficulties may arise from these techniques; laborious field work is often required to check and fix devices, especially when the survey area covers tens of km2, and it is often difficult to identify individuals and sounds (Tobler et al. Reference TOBLER, CARRILLO-PERCASTEGUI, LEITE PITMAN, MARES and POWELL2008).
The better fit of the Bernoulli model compared with the Poisson model is a phenomenon often found with transect nest counts. Nest counts often show an extremely skewed distribution, with many empty transects and a few transects containing the majority of nests. Spatial signals contained in these data often get degraded and binary formatted data often provide much better results (Naveau & Allard Reference NAVEAU, ALLARD, Leuangthong and Deutsch2005).
Although we were able to locate the four chimpanzee groups from transect nest counts using the Bernouilli model, a fifth hotspot of chimpanzee nesting activity was also found. This supplementary finding could be due to a real existence of part of the areas of activity of an unhabituated and neighbouring social group of the studied groups. Individuals from that unhabituated group may make incursions into the southern areas of the South and East groups’ home ranges. The approach used in this research could be applied to other studies. However, the identification of additional clusters in low-density areas, as found in the peripheral zones around and between some of the groups, seems to be an unavoidable by-product of this approach. Thus, additional criteria for cluster identification, which in the case of social groups could be the size or shape of clusters, would help to discriminate between clusters corresponding to groups and artifacts.
Quantifying heterogeneity and patchiness of species distribution, feeding activity or social grouping across a landscape is a prerequisite for answering many questions in ecology (Holt Reference HOLT1984). Ecologists and wildlife managers might not only be interested in species density and population size estimates for a particular area. They might also want to complement these estimates with additional information about the number of social groups or activity hotspots to better assess the population of interest. Ecologists might be particularly interested in this information to derive models on population dynamics, group interactions, cultural traits or disease transmission. Given the wide applicability of this technique, it might be worthwhile to further develop these ideas, sampling techniques and statistical methods. Although here we have taken only a very simple approach with a very small sample size, we think that our results look promising enough to further pursue this avenue.
ACKNOWLEDGEMENTS
We are grateful to the Ivorian Ministère de l'Environnement et des Eaux et Forêts, and the Parks and Reserves agency authorities (OIPR), for their permission to conduct this research. Thanks to the Wild Chimpanzee Foundation, the Taï Chimpanzee Project, the Centre Suisse de Recherches Scientifiques and the Max Planck Society which provided funding and technical support for this project. Particular thanks to the following people, who contributed to the data collection: D. Lia, F. G., Sylvain, A. Tagnon, H. Kpazahi, D. N. Oulaï, C. Bolé, L. B. Bally, B. N. Gouyan and A. Sioblo. I. Herbinger, S. Konaté and N'goran K. Eliezer gave advice for field work missions. We greatly appreciated Roger Mundry's help with the statistical analysis. We thank D. Dowd, P. Walsh and C. Rowney for improving the English in this manuscript. Thanks to the anonymous reviewers, whose advice greatly improved this manuscript.



