There is growing consensus that there are causal links between financial development and economic growth. Yet, there is less agreement on why some countries have more developed financial systems than others. Lately, financial economists have defended the idea that the legal traditions countries follow are a likely source of exogenous variation that may explain differences in financial development across countries. Because legal regimes were adopted or inherited before most modern financial markets arose, legal origin, the argument goes, might be what determines a country's ability to provide the legal protections that investors need for financial markets to flourish.Footnote 1
For instance, using a cross-section of 49 countries in 1995, Rafael La Porta, Florencio Lopez-de-Silanes, Andrei Shleifer, and Robert Vishny find that those with more legal protection for investors had larger financial markets. They argue that the more protection the legal environment affords, the more likely investors will be to participate in financial markets. Then, using legal origin as an exogenous variable to explain legal protections for investors across countries, their statistical work shows that “common law countries have the strongest protection of outside investors—both shareholders and creditors—whereas French civil law countries have the weakest protections.”Footnote 2
This article contributes to this debate by subjecting the relationship between legal origin and the development of bond markets to closer scrutiny. It asks the question: Does the adoption of a legal tradition in the distant past constrain a country's ability to provide the protection investors need for financial markets to develop? It shows that creditor protections vary too much, both over time and within and across countries, to support the assumption of a stable relationship between legal origin and creditor rights, and between creditor rights and bond market development.
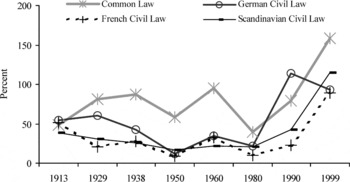
Most of the research that criticizes the work of La Porta et al. emphasizes shareholder rights and equity markets. For instance, Raghuram Rajan and Luigi Zingales have already raised doubts about the posited relationship between legal origin and the development of stock markets. They even found that in 1913 stock market capitalization over GDP ratios were, on average, higher for French civil law countries than for their common law counterparts. (Figure 1 plots the weighted averages by legal family using their data.) I focus, instead, on the less documented case of creditor rights and bond markets.Footnote 3 We do not know whether the bond market followed the same trajectory as equity, or whether its development is explained by variations in creditor rights.Footnote 4
EQUITY MARKET CAPITALIZATION TO GDP IN 23 COUNTRIES BY LEGAL FAMILY, 1913–1999 (weighted averages)

To answer these questions, I use Brazil as a case study, because it is currently a French civil law country with a profile of inadequate creditor protection and contract enforcement. If we believe that the legal system generates institutions that persist across time, then we will expect Brazil to have given creditors little protection in the past, and we will expect its bond market to have suffered as a result. I then present results for a small cross-section of countries for which I am able to compile creditor protections and bond market data circa 1910. There, too, we would expect to find the same two relationships that La Porta et al. detected in modern cross sections, with a legal system determining whether creditors are protected, and credit protection governing the fate of the bond market.Footnote 5
I show that these two relationships disappear in the historical data, whether we look at evidence from Brazil over the years 1885–2003 or at the small cross-section of countries. In Brazil strong creditor rights had only a tenuous relation with bond market development. Even though Brazil had strong creditor rights, both on paper and in practice, until at least 1930, the once-thriving bond market declined rapidly after 1915. The supposed fixed and path-dependent relationship between legal origin and creditor rights also varies over time in Brazil. Although the country today affords creditors only weak protections, it actually gave them strong rights before 1945. The variation in creditor rights is thus simply too great to square with the existence of a “stable,” path-dependent relationship between the protection afforded creditors and a country's legal origin. Instead, I argue that the variation in creditor rights in Brazil is explained by political economy, and that the decline of the country's bond market after World War I can be traced back to changes in international capital markets and macroeconomic causes.Footnote 6
The results are similar in my small 1910 cross-section of common and French civil law countries. There I find a striking reversal of the expected relationship between legal origin and creditor rights. Some of the common law countries that today have strong protections for creditors in fact sported prodebtor bankruptcy laws back in 1910, whereas French civil law countries that have prodebtor bankruptcy laws today actually protected creditors in 1910. There is thus no stable relationship between legal origin and the protection afforded creditors.
The link between bond market development and creditor rights is also weak in the cross-sectional data. The United States, for example, developed the largest bond market in the world by the 1920s, despite weak protection for creditors in 1910. French and German civil law countries in the sample had huge bond markets before 1900, when they had strong creditor rights. After that, their bond markets declined rapidly, even though they continued to have strong creditor protection. It is thus virtually impossible to establish a clear and durable relationship between the development of a country's bond market and the origins of its legal system.
THE BRAZILIAN CASE
Brazil had strong creditor protections on paper between 1850 and 1945, and these creditor guarantees were strictly enforced by the commercial courts in the capital, Rio de Janeiro. All this protection runs counter to what one would expect for a civil law country such as Brazil, which would presumably do little to defend creditors. Also surprisingly, it turns out that all the protection afforded creditors could not keep bond markets from declining rapidly after 1915. I argue that the waning of the bond markets perhaps had more to do with the reduction of international capital flows and the increase in inflation after the 1920s than with changes in creditor protections, which in any case were not determined by the civil law legal system.
The Data: Creditor Rights in Brazil
Studying the extent of creditor protections can be complicated because it is not clear what specific provisions in bankruptcy laws are essential for credit markets to work. Thus, in this article I follow the methodology of La Porta et al. in creating indices of creditor rights that are comparable across time and countries.Footnote 7 I identified the following rights: secured creditors have the right to repossess collateral in the event of default (no automatic stay on assets for debtors); secured (i.e., collateralized) creditors are paid first; creditor approval is required to reorganize a firm or to reschedule the service of a firm's debt; original managers do not remain in power during a firm's reorganization (i.e., no debtor-in-possession reorganization). According to La Porta et al., the more of these rights embodied in a country's bankruptcy law, the larger the expected size of its debt markets.Footnote 8
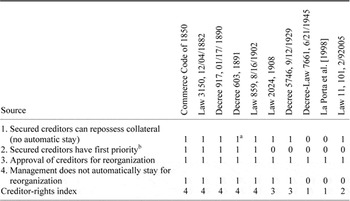
Following the methodology used by La Porta et al., I added the number of rights present in each of Brazil's bankruptcy laws (see the compilation of rights in Table 1).Footnote 9 I read and coded the bankruptcy legislation included in the Commerce Code of 1850; the Joint Stock Company Laws of 1882, 1890, and 1891; and the Bankruptcy Laws of 1902, 1908, 1929, 1945, and 2005. The sum of the rights as suggested by La Porta et al., was then used to create a creditor-rights index (bottom row of Table 1). I then followed the same methodology for tracing changes in bankruptcy law over time and when comparing my results across countries.Footnote 10
CREDITOR RIGHTS IN BRAZIL SINCE 1850

a Even though this right was not explicit in the decree, the previous law continued to rule.
b Bondholders did not have first priority until 1890.
Sources:
Brazil, Coleção das Leis. For 1945, Decree Law 7661, see Bevilaqua, Falência. Data for 1995 are not laws, they correspond to the coding for Brazil from La Porta et al., “Law.” For 2005 Law (Law 11,101 2/9/2005) see www.planalto.gov.br.
La Porta et al.'s categorization gives high scores to countries with bankruptcy systems that strongly protect creditors. The logic of the La Porta et al. methodology is twofold. First, in countries in which legislation does not give secured creditors (among them, bondholders) priority or the capacity to repossess collateral, investors and banks expect a high premium to compensate for the uncertainty likely to be faced in the event of bankruptcy. In many countries, for example, companies are permitted to keep assets pledged as collateral until their fate is decided by a judge, and workers' compensation and unpaid taxes are given priority over bonds and secured debts.Footnote 11
Second, bankruptcy laws that permit company reorganizations without creditor approval and under the direction of incumbent management provide incentives for negligence. Managers who make bad or risky decisions are rewarded under such “lenient” bankruptcy legislation with more time to try to undo their actions, against the interests and at the expense of creditors. This provides less of an incentive for investors to buy corporate bonds and for banks to lend to companies.
The Data: Bond Markets in Brazil, 1885–2003
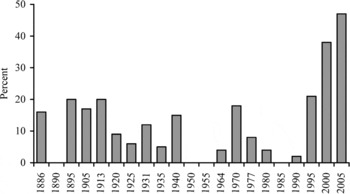
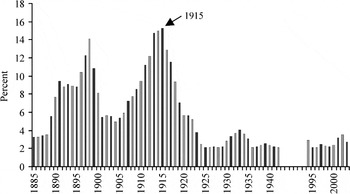
I also needed data on the size of Brazil's financial markets, particularly its bond market during the years 1882–1942, and data for recent years (1994–2003). To estimate equity and bond market capitalization, I relied primarily on the annual summaries for the Rio de Janeiro Stock Exchange that were published in the Jornal do Commércio and the Retrospecto Comercial do Jornal do Commércio, the city's most important financial newspaper (see Figure 2). The bond market figures I use in my Brazilian case study cover debentures only—in other words, corporate bonds with real assets as collateral. Additional stock and bond market capitalization data are estimated using the annual reports of the Stock Brokers Association of Rio de Janeiro (Câmara Sindical, Relatório) and the Anuário da Bolsa de Valores do Rio de Janeiro (1926–1942). Information for São Paulo, when available, is added to the total estimations of stock market capitalization. But the source of most of the data is the Rio de Janeiro Stock Exchange, which until the 1920s was Brazil's largest financial center and was the principal center for bond trading for most of the twentieth century. Data for stock market capitalization and total stock of debentures after 1990 are from the Brazil Company Handbook, 1993–2003, and the Brazilian Debenture Service.Footnote 12
EQUITY MARKET CAPITALIZATION OVER GDP IN BRAZIL, 1886–2002

BOND MARKET CAPITALIZATION OVER GDP IN BRAZIL, 1886–2002 (stock of corporate bonds / GDP)

The Patterns: The Variation over Time in Creditor Rights and Bond Market Size
On paper, Brazil had relatively strong creditor rights between 1850 and 1945 (see Table 1). The Commercial Code of 1850, which established a bankruptcy procedure that was highly protective of creditors, incorporated all four of the provisions considered by La Porta et al. to be important for the development of debt markets. Following independence (1821–1824), Brazil adopted the Napoleonic Commerce Code of 1807, which applied only to merchants (i.e., not to farmers or salaried workers) but was strict with debtors. The Brazilian Commerce Code of 1850 continued the Napoleonic tradition of strong creditor protections; when creditors were victims of debtor deception or fraud, bankruptcy could be considered a crime and punishment included jail sentences.Footnote 13 The same four legal provisions in fact remained in place up to 1908 (Table 1), and three of the four provisions were in force as late as 1945. Brazil thus once had what would seem like robust protection for creditors, hardly what one would expect from a country with a French civil law legal system according to La Porta et al.'s articles.
Given all this protection we might also presume that Brazil would have had a strong corporate bond market early on, but despite all the protections in place since 1850, corporate bond markets only emerged much later in Brazil. Indeed, they did not arise until after the Brazilian Congress introduced regulations in the Joint Stock Company Law of 1882 that allowed companies to issue bonds. Figure 2 plots the growth of the stock of bonds relative to GDP; the ratio goes from zero before 1882 to around 5 percent in the late 1880s. Clearly, the relationship between creditor protection and bond market development is more complicated than the scoring system of La Porta et al. would suggest.Footnote 14
One reason bond markets did not expand earlier is that bondholders were not properly recognized as secured creditors with a senior claim until 1890; under a previous 1882 law bondholders had only been considered unsecured creditors, that is, creditors without privilege. The greater security creditors gained in 1890 came about because of the sort of political changes that do not enter in simple scoring of legislation.
After having been a constitutional monarchy for nearly 70 years, Brazil in 1889 became a federalist republic with contested elections at all levels of government. The republican movement, led by a number of generals and an important group of thinkers, set about transforming the structure of the Brazilian economy. Republican ideologue Rui Barbosa took over the ministry of finance and in early 1890 rapidly passed reforms that included adding legal provisions to protect small investors and tailoring joint stock company laws to facilitate entry to new entrepreneurs. Barbosa was responsible for the law passed in January 1890 that accorded bondholders the status of secured creditors and gave them a senior claim during bankruptcy.Footnote 15
But this was not the only measure affecting the corporate bond market, because Barbosa almost simultaneously passed three other critical measures. First, in 1890, he reduced the initial capital required to register a corporation from one-fifth to one-tenth of total capital. The number of joint stock companies formed and traded on the exchanges of Brazil subsequently grew rapidly, with almost half issuing corporate bonds. Second, he altered the incentives for companies to issue debt versus equity. Whereas chartered corporations generally could issue debentures only up to the value of their registered capital, in 1891 firms engaged in public services that required government approval (e.g., railways, shipping companies, utilities, and public works companies) were permitted to issue debentures for more than the declared value of their paid up capital.Footnote 16
Finally, Barbosa promoted rapid expansion of the money supply by establishing an official system of regional banks charged with expanding the emission of bank notes. The expansion of the money supply generated a short-term boom in the securities markets. These banking reforms were phased out by 1895, but the other two regulatory changes mentioned above had a lasting effect on bond markets.
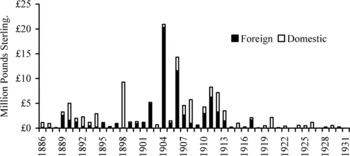
Because Barbosa changed creditor rights and passed these measures almost simultaneously, it is hard to disentangle how much of the increase in bond issues between 1890 and 1915 (see Figure 2) resulted solely from the seniority that creditors gained in 1890. Moreover, international conditions also favored bond market development. Figure 3 shows the boom in bond issues, separating domestic annual bonds issues by whether they were denominated in domestic or foreign currency and converting all the figures into pounds sterling to facilitate comparisons across time.Footnote 17 Most of the domestic bond issues during Brazil's golden era of bond markets were denominated in sterling, francs, and other European currencies to facilitate sales to European investors. Not coincidentally, this was also the period when Brazil first adhered to the gold standard (1906–1914) in order to contain the appreciation of the local currency, the mil reis. With exports booming as a consequence of the coffee valorization program, and in a scenario of large foreign capital inflows, both coffee exporters and the federal government agreed to regulate the inflows and outflows of gold through a currency board.Footnote 18
CORPORATE BOND ISSUES PER YEAR, RIO DE JANEIRO STOCK EXCHANGE, 1890–1930

In sum, Table 1 and Figures 2 and 3 suggest that strong creditor rights on paper might have provided incentives for investors to buy bonds, promoting the rise of bond markets between 1882 and 1915. But the effects of changes in creditor rights are not as clean as we would want. The rise of bond markets during this period could have been affected by other things, such as the monetary policy of the early 1890s, the increase in the legal limit to issue bonds relative to equity, the increases in capital flows, or the higher export revenues after the coffee stabilization program in 1906.
Enforcement of Creditor Rights in Brazilian Courts
The growth of bond markets also depended on whether creditor rights were enforced by Brazilian courts—a further complication blurring the relationship between rights enshrined in laws and the development of markets. For example, changes in bankruptcy law in 1908 could have hurt bondholders because they now stood behind the Treasury on the list of creditors to be repaid if there were unpaid taxes. Yet this legal change, which cut Brazil's score from four to three in Table 1, did not immediately become practice, as court cases show that Brazilian courts enforced creditor rights strongly until at least 1916.Footnote 19
The evidence from such court cases (which are available at Brazil's National Archive) reveals two important things. First, the enforcement of creditor rights was very different in the past and varied over time—hardly what one would expect if creditor rights were simply determined by the civil law legal system. Whereas Brazilian bankruptcy judges today are ambiguous about the interpretation of the law and take five to ten years to resolve a case, their predecessors between 1850 and 1916 strictly enforced the creditor rights in Table 1 and took only couple of years to render a decision. Yet even this strong enforcement cannot by itself explain what happen to the bond market—the second point to emerge form the judicial archives. Indeed, bond markets declined rapidly after 1915, even though judges were still supporting creditors' rights.Footnote 20
In the bankruptcy rulings before 1916, secured creditors had senior claims, bankrupt companies were run by a trustee selected from among the creditors, and managers of corporations were not permitted to stay during reorganization. Although in many instances creditors retrieved collateral or liquidated a company, it was more common for them to put the company into receivership and try to reorganize it.Footnote 21
To see how all this worked in favor of creditors, consider the bankruptcy of the Leopoldina Railway Company. In 1895 the Leopoldina, one of the largest joint stock companies in Brazil, stopped paying the coupons on its pound sterling bonds. The company was declared bankrupt in 1897 after Edward Herdman, representing its British debenture holders, showed proof of suspension of payments for two years (the minimum to request bankruptcy was six months). Because he represented a significant portion of the company's debt holders, Herdman became a trustee of the company's receivership, together with the Banco da República, Brazil's largest bank. The trustees serviced the company's debt with its profits and later mediated an agreement between bondholders and shareholders whereby the former swapped their bonds for equity instead of liquidating the company. The bankruptcy process was begun in 1897. By the summer of 1898 the company had swapped its former gold-denominated bonds for new ordinary shares and made a new issue of 4 percent bonds. It began paying coupons in January 1899. These bonds traded at 83 percent of par in their first year.Footnote 22
In such cases, judges not only enforced creditor rights but also set precedents that changed how the protection of creditors worked in practice. For instance, foreign creditors of the railroad company Sapucaí were among those who benefited from the precedent set by the Leopoldina case. After the Leopoldina case, the jurisprudence stated that “the foreign creditor with an address outside of the country can request a bankruptcy procedure for a debtor established here [in Brazil], without having to register the firm in the local registry.” So when in 1899 the management of the Sapucaí Railway stopped servicing the company's bonds in pounds sterling. The firm's shareholders and ex-directors proposed a swap of equity with the English bondholders, who had created a bondholders' association. The swap was a sweet deal for bondholders because the Minas Gerais state government had guaranteed a dividend of at least 6 percent on the company's shares. Moreover, the government offered the concession of a new line only if the company was reorganized. Bondholders accepted the deal and ended up owning 80 percent of total equity.Footnote 23
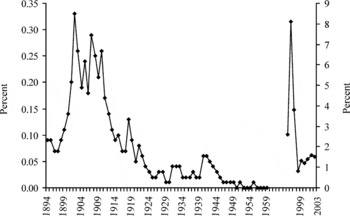
VALUE OF CORPORATE BONDS TRADED AS A PERCENTAGE OF GDP, 1894–1959

Reorganizations of this sort were also undertaken in the cases of smaller companies. In the 1915 reorganization of the Companhia Industrial e de Construções Prediais “O Prédio” (a construction company), for instance, privileged creditors took control of the company and scheduled payments for the other creditors.Footnote 24 And even in simple liquidations, courts enforced creditor rights in accordance with the law. In 1892, for example, creditor trustees took over the Companhia Anonyma Coudelaria Cruzeiro (a horse breeding farm), auctioned the assets, and used the proceeds not only to repay bondholders but to provide nonprivileged creditors 25 percent of their credits.Footnote 25
Yet even if judges enforced creditors' legal rights right up to 1945, they were not enough to sustain the bond market, which declined after 1915 (Figure 2). The bond market capitalization in fact never recovered its 1915 level. In the first two decades of the twentieth century the stock of bonds represented between 6 percent and 15 percent of GDP, whereas during the 1990s it represented between 2.5 percent and 3.5 percent.
The volume of debenture trading in Rio de Janeiro paints an even darker picture of the decline in bond markets. Figure 4 shows that the volume of corporate bonds traded in Brazil (as a percentage of GDP) declined after 1912, even though bondholders were strictly protected on paper and by the courts. Clearly, the development of the Brazilian bond market was affected by more than creditors' legal rights or their enforcement by the courts.
Changes in the Brazilian Bond Market After 1915
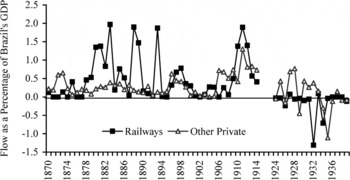
If creditor rights were not sufficient to sustain bond market development, then we need a different explanation for the decline of the bond market. The evidence suggests that the decline was likely connected with diminishing international capital flows and higher inflation rates after World War I, rather than with changes in creditors' rights. As we can see in Figure 5, which plots British capital exports to Brazil, the flow of capital from Britain dropped after World War I, especially in the railway sector. Because many of the bond issues were denominated in foreign currency and cross-listed in Europe, Brazilian companies ran into difficulty when they could not reissue their bonds because of the postwar disruption in capital flows and exchange rate instability. (Brazil was on and off the gold standard during the 1920s and abandoned it altogether in the 1930s). The difficulties hit railway companies particularly hard because their bonds were usually sold in London and Paris (Figure 5). Foreign investment in other sectors did not decline nearly as radically until the early 1930s.
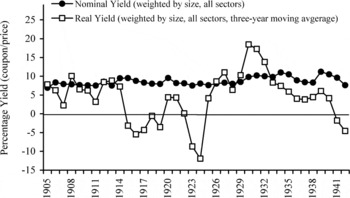
Because capital flows were still significant in the late 1920s, we cannot attribute the decline in bond markets after World War I entirely to external conditions. It must be related to the state of the Brazilian economy too, given that the volume of bonds traded domestically (normalized by GDP) also dropped after 1910 (Figure 4). One likely cause was the higher inflation after World War I, which sapped bondholders' real returns. I explore this hypothesis by estimating an index of average real corporate bond yields (weighted by the value of each issue) from 1905 to 1930 (Figure 6). Yields turned negative between 1915 and 1925, which might explain why bonds were barely traded during this period. Before they became positive again in the late 1920s, there was a brief period of intensive capital inflows into sectors other than railways (Figure 5), but both yields and capital inflows plummeted in the 1930s.
BRITISH CAPITAL EXPORTS TO BRAZIL, 1870–1939 (as a percentage of GDP)

Even during the brief period of higher real yields and capital inflows, the domestic bond market remained shallow, neither trading nor capitalization really recovering their prewar levels.
Three fatal blows then struck the bond market. First of all, real yields fell steadily as inflation rates accelerated over the course of the 1930s and 1940s. Then nonvoting shares with fixed dividends (preferred shares), close substitutes for bonds, were introduced in the 1930s and popularized in the 1940s and 1950s. Finally, in 1945, a government reform of bankruptcy law eliminated most of the legal protections for bondholders.Footnote 26
Whereas the reforms to bankruptcy law in 1908 and 1929 introduced only minor procedural changes while respecting the general protection of creditors, the 1945 law radically altered creditor protections. The bankruptcy law reform of 1945 was drafted by the authoritarian government of Getúlio Vargas with the aim of improving labor protections and facilitating the survival of companies as going concerns. Under this new law, debtors could avoid liquidation by filing for a composition scheme called concordata preventiva, which gave debtors two years to reorganize and pay all debts. Creditor approval was not always necessary, and the current management was permitted to continue operating the company under bankruptcy protection. In theory, the restructuring and rescheduling of debts applied only to unsecured credits (secured creditors could supposedly collect collateral and not be part of the deal), but in practice secured creditors rarely recovered anything, for debts owed for social security payments and labor injury compensation took precedence over other credits, and the process to collect collateral became slower over time. After 1945, bankruptcy became a sluggish judicial process that tended to last, on average, five to ten years. Delays and the post-1940s high-inflation scenario lowered the real expected recovery rate for secured creditors to zero and when, after a few years, creditors were finally able to repossess collateral, the assets seized tended to be useless.Footnote 27
NOMINAL AND REAL AVERAGE YIELDS OF CORPORATE BONDS, 1905–1942

Brazil did not see another bankruptcy law with less of a prodebtor bias until 2005, following ten years of congressional negotiations during which congressmen from leftist parties tried to protect the priority of labor, and the National Treasury fought to preserve its priority over secured creditors. In the end, an agreement among congressmen limited the maximum amount labor could claim as privileged credits and gave secured creditors priority over debts owed to the Treasury.
The historical evidence from Brazil casts doubt on two of the key assertions about the relationship between law and the development of financial markets. First, Brazil's strong protection for creditors between 1850 and 1945 contrasts sharply with the weak protections it offered after 1945. The contrast raises questions about the claim that legal systems determine creditor rights in a stable and path-dependent way. The second piece of evidence is the discovery that the decline of Brazil's bond markets after 1915 was apparently not driven by any change in creditor rights. The implication here is that creditor rights do not seem to be strongly related to bond market development over time. If bond market development had been more strongly linked to creditor rights, it would not have varied that much while creditor rights remained strong. Macroeconomic conditions, such as the level of capital inflows or the rate of inflation, seem to be more important drivers of bond market size than any legal change in bankruptcy laws. Obviously Brazil is just one country, and it could be an atypical case. That is why the next section asks whether the patterns found in Brazil hold for other countries.
IS BRAZIL UNIQUE? CREDITOR RIGHTS AND BOND MARKETS IN OTHER COUNTRIES CIRCA 1910
To see whether my findings for Brazil are representative, I study creditor rights (on paper) in a cross-section of common and civil law countries circa 1910 and then provide some evidence of the long-term evolution of bond markets in these and other countries since 1895. The section makes two main points. First, there are no clear differences in the extent of creditor protections in French civil law countries and their common law counterparts circa 1910. Second, there is a tenuous relation between creditor rights and bond markets once we look at the variation in bond market size both across countries (c. 1910) and over time. Once again, the links between the legal system and creditor protection and between creditor protection and bond market development are tenuous at best, as in Brazil.
Creditor Rights and Legal Families
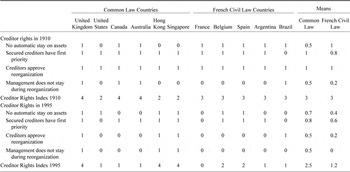
Table 2 shows the level of creditor rights in a cross-section of six common law countries and five French civil law countries circa 1910. At first glance, we can see that Brazil is not an outlier; most French civil law countries had strong creditor rights in 1910. The evolution of creditor rights from 1910 to 1995 can also be deduced from the table. French civil law countries started with procreditor laws in 1910 and ended up, on average, with prodebtor laws in 1995.
Although the legal family made a clear difference in the way creditors were protected in 1995, those differences were less clear back in 1910. On average French civil law countries then had creditor protections similar to those in common law countries (the mean for both legal families in Table 2 is three protections). Some common law countries or colonies in fact had more lenient bankruptcy laws for debtors in 1910 because they let judges have more power to approve corporate reorganizations and to decide whether creditors could repossess assets. According to one student of bankruptcy, for instance, the United States “has long distinguished itself as a nation with a special fondness for debtors.”Footnote 28
In contrast, most French civil law countries circa 1910 strictly enforced repossessions and let creditors run receiverships and liquidate companies. Table 2 is actually coded in a way that biases the results toward finding that French civil law countries are debtor-friendly because it classifies them as permitting management to stay during reorganization. But that was not always the case. Reorganizations run by incumbent management in French civil law countries had to be approved by the creditors, and there was no debtor-in-possession reorganization under the protection of the court that applied across the board, as in the United States and Hong Kong. Furthermore, in French civil law countries, if the creditors did not approve reorganizations (compositions), companies went into liquidation under the management of selected trustees, mostly from the largest creditors.Footnote 29
CREDITOR RIGHTS IN SELECTED COUNTRIES IN 1910 AND 1995

Sources:
All creditor rights for 1995 are from La Porta et al., “Law,” Table 4. Creditor rights for 1910 are from United Kingdom, Companies (Consolidation) Act 1908; United States from Huberich, Commercial Laws; Hong Kong, Bankruptcy Ordinance No. 7 1891; Strait Settlements, An Ordinance to Amend the Law of Bankruptcy no 2 1888 (3 December 1888); France from G. France Horn, Commercial Law; Belgium from Hennebicq, Commercial (based on the Commercial Code of 1872 as amended to 1910); Spain from Benito, Commercial; Argentina from Quesada, Commercial; Brazil, Lei 2024, December 17, 1908, in Brazil, Colecção das Leis. Australia and Canada coded as following British bankruptcy law according to the accounts of Brown, “Comparative.”
Australia and Canada are included among the common law countries in Table 2 even though they did not have consolidated bankruptcy laws. Each province in Canada and each territory in Australia had its own bankruptcy code at the time, all with different procedures. Some legal writers argue that most provinces in Australia began to follow the British bankruptcy proceedings around 1900. This also seemed to be the case in Canada, but bankruptcy laws looked very different in terms of procedural provisions there. For simplicity I include Canada and Australia in Table 2 as having the four provisions to protect creditors. Even if they are included, there is no difference in the average protection for creditors in common law and French civil law countries (the averages are presented in the last two columns).Footnote 30
My evidence and historical evidence presented in other recent works suggest that the decline of creditor rights in civil law countries and emergence of strong creditor protections in common law countries took place primarily during the twentieth century. For example, using more comprehensive indices of debtor punishment, Jerome Sgard found the bankruptcy laws of common law countries to be more lenient than those of civil law countries throughout the nineteenth century. Civil law countries' harsh punishments for debtors were eliminated only in the second half of the nineteenth century. In addition, most European countries adopted procedures that facilitated reorganization (e.g., the concordat préventif, a form of debtor-in-possession reorganization) and continuation of the going concern (but only with creditor approval). The reason for this joint movement toward a more lenient bankruptcy system are not straightforward, but they probably have to do with the fact that there was close communication among lawyers and policy makers across countries at the time. According to Sgard, businessmen pressured lawyers and lawmakers for a more uniform set of laws across the continent.Footnote 31
Beyond the need for standardization, the fact that all French civil law countries ended up with weak creditor protections might have something to do with shocks after World War I. For instance, inflation in the 1920s or the Great Depression perhaps mobilized labor across countries to demand more protections (and entrepreneurs to demand more lenient bankruptcy laws). Enrico Perotti and Ludwig von Thadden make such an argument in their work on the political economy of dominant investors. For them the inflationary shocks in Europe explain many changes in corporate governance after the 1930s. But we still do not have a good explanation of why shocks such as the Great Depression did not mobilize labor and entrepreneurs in the same way in Great Britain, South Africa, Canada, or Australia. Thus, we still do not understand clearly why most common law countries ended up with strong creditor protections at the end of the twentieth century after they began with somewhat low indices of creditor protections circa 1910.Footnote 32 But even without such an explanation, it is clear that creditor rights are not determined once and for all by a country's legal system. Creditor rights simply change too much for this to be true.
Bond Markets around the World, 1895–1978
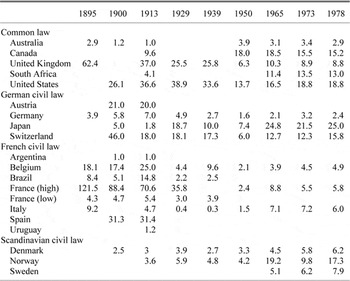
There is also significant cross-sectional variation in bond market size that is not related to either creditor rights or a country's legal origin. In Table 3 I calculate the value of the stock of bonds in different countries following the estimates of Raymond Goldsmith (Comparative National Balance Sheets), who compiled figures for the stock of corporate bonds and stock market capitalization for ten countries between the 1870s and 1978 (the number of estimates varies over time). I complement Goldsmith's data with estimates of ministers of finance, directors of stock exchanges, and statisticians compiled by Alfred Neymarck in the Bulletin de l'Institut International de Statistique, 1895–1911.Footnote 33
In the estimates of the stock of bonds over GDP across countries presented in Table 3, one can see that civil law countries had some of the largest bond markets in the world before 1913. For instance, the ratio of bond market capitalization to GDP in France, Spain, and Belgium in 1900 was 88.4 percent, 17.4 percent, and 31.3 percent, respectively. German civil law countries such as Switzerland and Austria (Austria-Hungary) also had significantly large bond markets, with capitalizations of 46 percent and 21 percent of GDP, respectively. Bond markets in French civil law countries and some German civil law countries, even though they had strong creditor protections, begin to decline by 1913 (see Table 2). Thus, creditor protections do not seem to be strongly related to bond market movements in these civil law countries either, just as in Brazil.Footnote 34
STOCK OF BONDS AS A PERCENTAGE OF GDP ACROSS COUNTRIES, 1895–1978

Sources:
Estimated by the author from data in Goldsmith, Comparative. Other bond market data by country was estimated as follows: 1895 and 1900 bond and GDP data for Australia are from Davis and Gallman, Evolving Financial Markets, Table 5, pp. 4–8 (1895 estimated using the 1889 data over 1895 GDP), 1913 data were estimated by adding the new issues of bonds in Australia from 1900 to 1913 from Drummond, Capital Markets, table B, p. 293 (this is clearly an overestimate). Canada's 1913 figure uses 1912 estimate of stock of bonds from Wood, Review. For South Africa the estimate of bonds in 1913 is from Union of South Africa, Official Year Book, No. 2, 1918, p. 729 (this is clearly an overestimate because it counts all the bonds registered in South Africa; Lyndon Moore found no bonds traded in the Johannesburg Stock Exchange). For Austria, data for 1900 are from Neymark, Congrès, Tome 1 and for 1912 from Neymarck, “Statistique” Vol. 20, Tome 2. Data for Germany are from Deutsche Bundesbank, Deutsches, Table 1.01a. Data for Japan in 1910 taken from Neymarck “Statistique” Vol. 19. Data for Belgium in 1895 and 1900 based on estimates of Neymarck, Congrès, Tome 1 and data for 1913 kindly provided by Marc Deloof and Franz Bulens using the SCOB Database, University of Antwerp, Belgium. For Brazilian data, see Figure 2. High boundary estimates for France are from Saint Marc, “Introduction,” pp. 72–104 (this is an overestimation because it counted railway bonds with government guarantees and foreign railway bonds). The low boundary estimate are from Hautcoeur, “Le Marché” (includes bonds traded or registered in Paris, either at the parquet or the coulisse, and excludes French colonial companies, foreign companies, and companies with government guaranteed dividends or bonds). For Argentina, I use the scant data on bonds quoted in Buenos Aires obtained from the Boletin de la Bolsa de Buenos Aires and the Argentine Yearbook 1914. For Uruguay I use the Anuario Estadistico de la Republica Oriental del Uruguay 1915, Montevideo 1917 (and GDP estimates from Bertola, El PBI). For Spain, 1900 proxied with data from 1902 obtained from Neymarck “Statistique” 14, p. 388, and data for 1913 proxied with the figure for 1911 obtained from BIIS 20 (GDP from Prados, Progreso). For most countries I use the GDP from Mitchell, International; and Flandreau and Zumer, Making.
In common law countries we find a similar tenuous relationship between creditor rights and bond market size. Although the United States and the United Kingdom had the largest bond markets among common law countries, with capitalizations of 36.6 percent and 37 percent, respectively in 1913, by the 1920s the United States had the largest bond market in the world. This is important because the United States developed bond markets notwithstanding the lack of creditor protections in its bankruptcy laws and the discretionary power accorded judges to protect debtors.Footnote 35
Argentina, Canada, and Australia, with somewhat strong creditor rights (estimated creditor rights indices of three, four, and four, respectively), had quite small bond markets circa 1913. In these cases, creditor rights did not seem to matter much because companies in these countries could place bond issues in London. The dominance of the London market might thus explain more of the financial underdevelopment of these countries than any legal variable.
In sum, the clear differences that we find today in the size of credit markets among countries of different legal traditions does not seem to be stable over time. According to the evidence in this section, different legal traditions have dominated bond markets at different times, for reasons having nothing to do with creditor rights. In fact, over time creditor rights had only a tenuous correlation with bond market size. The same clear-cut differences in creditor protections across legal families that we find today cannot stand up to the test of time either. Back in 1910 French civil law countries had protections just as good as under the common law countries.
CONCLUSIONS
My findings have important implications for the literature that has focused on the relationship between legal origin and financial development. First, there does not seem to be a strong relationship, over time, between creditor protections and bond market development. At most, creditor rights seem to have been a necessary (but far from sufficient) condition for bond market development. In the case of Brazil, the variation in bond markets over time bore more of a relation to international capital flows and macroeconomic stability than to legal variables.
Second, the ranking of legal families according to the protection they accord creditors is not constant over time. Although cross-sectional evidence for today reveals significant differences in creditor protections across legal traditions, these differences were minimal circa 1910. Common and French civil law countries actually gave creditors quite similar protection.
The cross-sectional evidence in fact suggests that the differences in creditor protection today are of a quite recent origin. Most French civil law countries with strong creditor rights in 1910 ended up with weak protections in the 1990s. In contrast, some common law countries, such as Hong Kong and Singapore, that had weak creditor rights when they were still British colonies ended up with strong creditor rights in 1995. It thus seems unlikely that investor protections—in this case creditor rights—are really a consequence of the legal traditions countries follow.
Even if investor protections were not determined by legal origin and if bond markets before 1913 were more developed in French civil law countries than in common law countries, it could still be the case that legal traditions could have affected financial development in the long run. Perhaps common law countries were better at adopting and keeping the institutions and macroeconomic policies that made financial markets thrive earlier in the twentieth century, whereas the political economy of investor and labor protections in civil law countries led to an equilibrium in which these countries lost the institutions and the macroeconomic stability that had aided the initial development of their financial markets. Such a story could perhaps be traced back to the fact that in French civil law countries lawmaking is highly centralized, making it more easily captured by interest groups. In common law countries, by contrast, judges have an easier time adapting statutes, guaranteeing that the rules that work best in practice end up prevailing. Even if this is the case, the starting point for this adaptation process was not hundreds of years ago (when legal systems were introduced), but only a few decades ago. In any case, the effect of legal origin should manifest itself primarily in the interaction between financial institutions and politics. If so, then we need a new explanation for why politics and twentieth-century economic shocks made most civil law countries in continental Europe and Latin America converge on a significantly different institutional model than that in common law countries.Footnote 36