1. Introduction
This article deals with a special kind of inheritance in cultural evolution (i.e., within the framework of generalized Darwinism). This framework is postulated by scientists and philosophers from different fields of research as a new and interdisciplinary theoretical structure or paradigm (e.g., Richerson and Boyd Reference Richerson and Boyd2001; Reydon and Scholz Reference Reydon and Scholz2014). An extensive overview of the generalized-Darwinism approach is, for example, provided by Schurz (Reference Schurz2011). For a strong defense of generalized Darwinism and a carefully worked out core of Darwinian principles, see Aldrich et al. (Reference Aldrich, Hodgson, Hull, Knudsen, Mokyr and Vanberg2008). Different approaches and some methodological problems are discussed by Witt (Reference Witt2004) and Crozier (Reference Crozier2008). For a critical, but fruitful investigation concerning Darwinian concepts outside of biology, see Reydon and Scholz (Reference Reydon and Scholz2014).
We will focus on cultural inheritance, which differs from biological reproduction in relevant aspects. As described perhaps most prominently by Boyd and Richerson (Reference Boyd and Richerson1988), Mesoudi (Reference Mesoudi2011), or Lewens (Reference Lewens2015), cultural inheritance can be modeled as different forms of social learning. In the following investigation, we define a specific learning mechanism that consists of a success-based weighting of variants of cultural behavior that are then blended by an agent who observes them. The underlying assumption is that such variations typically are not the result of an unweighted averaging of given traits that then are passed on. Instead, they are guided by principles that make them the most promising or attractive for social learning.
Our project can be considered a study of philosophy of the special sciences, providing a rational reconstruction of scientific notions, models, and theories. Philosophical rational reconstruction as explication in the wide sense consists of two steps (Carnap Reference Carnap1950/1962, secs. 2 and 3): identifying the explicandum as clearly as possible and introducing an explicatum to replace the former. In our case, the concept we are mainly concerned with is blending inheritance in cultural evolution. Our reconstruction will be rational in the sense that we provide a justification for considering the model to be adequate. And it is philosophical, because the reasons we provide are not empirical (e.g., about the empirical adequacy) but normative ones.
Our investigation is structured as follows. In section 2, we take the first step of the reconstruction, clarifying the notion of blending inheritance and discussing the main theoretical constraints and arguments for blending put forward in cultural evolutionary theory: homogeneity (blending decreases the otherwise too high variation rate due to biases and drift) and fitness enhancement (sec. 2.1). We also describe how the discussion of cultural evolutionary biases is linked to social learning strategies (sec. 2.2). To our knowledge, this relation has not been noted before and plays an important part in the second step. In section 3, we finalize the first step by describing two prominent models of cultural inheritance, one model by Boyd and Richerson (Reference Boyd and Richerson1988) and a population dynamical model described by Schurz (Reference Schurz2011). An innovation of the former was the introduction of the distinctive feature of cultural inheritance, namely, blending inheritance, as social learning (sec. 3.1). An advantage of the latter is the simplicity of implementing a frequency-dependency bias, which we will identify as a particular variant of social learning (sec. 3.2). In section 4, we finalize the second step of the rational reconstruction by combining features of both models. Blending inheritance is introduced as a form of social learning via success-based weighting. We also provide a normative rationale for the model (sec. 4.1). We conclude the investigation with some provisos and a simulation illustrating the result of the rational reconstruction (sec. 4.2).
2. Blending Inheritance in Cultural Evolution
As indicated in the introduction, we commence our rational reconstruction by characterizing different constraints for the notion of blending inheritance put forward in the literature. Afterward, we analyze the ingredients of these constraints as a form of social learning, which will be of utmost importance for the second step of our reconstruction.
2.1. Different Explanatory Roles of Blending Inheritance
In this section, we provide a general discussion of the notion of inheritance in cultural evolution, which is, because of its specific feature of mixing traits, sometimes also called blending inheritance. First, we hint at some historic roots of the concept, then we briefly outline our explication to provide a starting point for the modeling in the subsequent sections.
Mesoudi (Reference Mesoudi2011, 61) applies the term ‘blending inheritance’ to a certain microperspective, namely, to trait-copying individuals who are exposed to the cultural traits of more than one person, adopting the average of all of those traits. However, in Darwin’s time (as well as contemporarily; see Lande Reference Lande1979), blending inheritance was thought to happen in natural evolution as well, even if Mendelian genetics was accepted (Richerson and Boyd Reference Richerson and Boyd2005, 88; Mesoudi Reference Mesoudi2011, 41–42). According to this hypothesis, offspring constitute an intermediate form of their parents. Darwin himself proposed that inheritance takes an average of the genetic contributions of both parents. However, as Fleeming Jenkin has pointed out in a review of the Origin as early as in 1867, such a concept of inheritance would mean that variation would be reduced by half at each new generation, and variety would disappear quickly (if there is no sufficiently high mutation rate). In consequence, Darwin himself abandoned blending as a principle for inheritance in natural evolution and left the problem of inheritance unresolved. Only when the significance of Gregor Mendel’s work was properly understood and appreciated, and because of Ronald A. Fisher’s population dynamical models, was this problem of biological inheritance tackled. Establishing principles of particulate heredity via the transmission of discrete units (genes) and transmission rules, such as the distinction between dominant and recessive alleles, did the job.
There are theories of cultural evolution that adopt particulate inheritance for the cultural realm, but operationalizing such cultural units, as meme theorists have tried to do, has been the subject of severe critique (Lewens Reference Lewens2015, 26). One of the reasons is that cultural inheritance seems, indeed, to be nonparticulate and blending in many relevant cases.
Not only is it hard to identify and operationalize the notion of discrete units of cultural inheritance, but there are also more general arguments in favor of nonparticulate cultural inheritance. The approach of cultural attractors of Sperber (Reference Sperber, Chiara, Doets, Mundici and Benthem1997) and Claidière and Sperber (Reference Claidière and Sperber2007) argues that discrete units of cultural inheritance are misguided and superfluous, since assuming a distribution of psychological dispositions among humans on the natural level suffices to explain similar developments in culture, without there being a need to assume memes as units of reproduction.
Richerson and Boyd (Reference Richerson and Boyd2005, 88–89) argue for distinct principles of inheritance in culture as opposed to nature. For natural inheritance, Jenkin argued that nonparticulate blending leads to too much homogeneity in the sense that variety vanishes, and Fisher’s further theoretical framing shows that discrete units of inheritance allow for upholding variety or adequate heterogeneity. But, in cultural evolution it seems that, because of the high variation rate (in a wide sense), assuming discrete units of inheritance such as memes would lead to too much heterogeneity and that, given a high variation rate, nonparticulate blending inheritance allows for adequate homogeneity. So, whereas discrete units in natural inheritance allow for balancing inheritance toward adequate heterogeneity, blending in cultural inheritance allows for balancing inheritance toward adequate homogeneity: “We can even imagine that cultural transmission is sufficiently noisy and error prone that blending inheritance would be an advantage in keeping cultural variation from growing disastrously large. In a noisy world, taking the average of many models may be necessary to uncover a reasonable approximation of the true value of a particular trait” (Richerson and Boyd Reference Richerson and Boyd2005, 89). In the same line, Henrich, Boyd, and Richerson (Reference Henrich, Boyd and Richerson2008, misunderstanding 1 and 2) argue against the misunderstanding of cultural evolution that “replicators are necessary for cumulative, adaptive evolution.”
As we will see in the sections on modeling cultural evolution (secs. 3 and 4), evolutionary simulations suggest that blending inheritance in fact results in the reduction of cultural variation in the population. Indeed, as discussed by Jenkin for biological inheritance, if blending inheritance were the only process of cultural variation in the population, it would eliminate that variation completely, since intermediate traits of the daughter generations are always coming from more “extreme” ancestral traits. However, it is a high variation or mutation rate (as in natural evolution) and other evolutionary “forces,” such as guided variation, content bias, and several kinds of randomization such as drift, that run against a homogenization effect and keep up variation and change over the cultural generations—or, as Mesoudi (Reference Mesoudi2011, 62) aptly puts it: “Obviously, in the real world blending inheritance cannot be the only process operating on cultural evolution, otherwise we would not see the enormous cultural variation … : 7.7 million patents, 10,000 religions, 6,800 languages, and so on. There must, then, be other processes at work.” So, in general, blending inheritance is characterized as a process in which a single individual adopts the average of two or more demonstrators’ continuous traits, whereas in the case of particulate inheritance discrete traits are copied. We will now outline our explication of blending inheritance as success-based social learning.
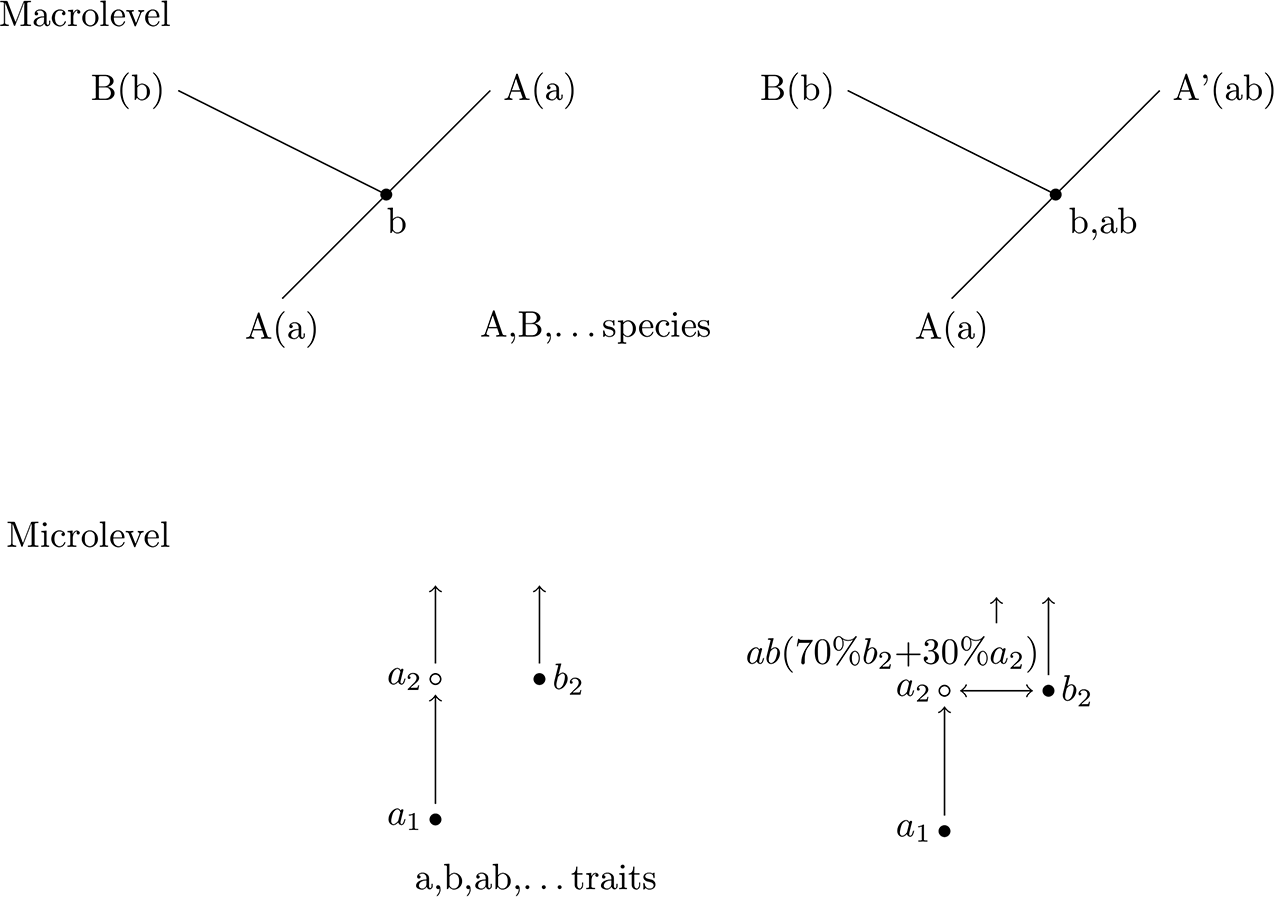
Key to understanding the notion of blending inheritance is that it can increase the frequency of the relevant traits, a fact that many authors do not stress enough. This possibility is depicted in figure 1. If we assume two cases of reproduction, one of particulate (left) and one of blending inheritance (right), then the resulting macroevolutionary patterns might exhibit a higher frequency in the case of blending inheritance. We say a bit more about figure 1 below.
Blending inheritance on a microlevel and the possible results on a macrolevel. If we assume (bottom right) that traits a 2 and b 2 blend together under some guided principle of weighting and form a new trait (ab), and that the 70% of b 2 as well as the 30% of a 2 that remain in the new combined trait are not maladaptive, then species A′ (top right) should be fitter than in the unblended case on the left. Indices represent generation numbers, and arrows represent transmission.

In cultural evolutionary modeling, the concept of traits describes identifiable units of cultural transmission. The “units” of inheritance and selection are not biological organisms or their genes but cultural information, skills, or artifacts, which are selected by, vary between, and are inherited through cultural “generations.” Accordingly, these generations are not biological life cycles but cultural reproductive cycles. Each transmission of socially acquired information from one individual to the next makes up a reproductive cycle, in which a cultural trait is passed on. The units can be represented by discrete entities, as is the case in the models in section 3.2, or by continuous values, as in the models in sections 3.1 and 4. More specifically, in our examples we think of traits as behavioral dispositions. The term fitness is well defined in natural evolution, that is, the number of an organism’s reproducing offspring (fertility notion). In cultural evolution, such a straightforward definition is problematic because of the individuation problem of cultural units (Ramsey and De Block Reference Ramsey and Block2017). However, like Boyd and Richerson (Reference Boyd and Richerson1988), we will assume that cultural traits are given. We then identify the fitness of such a trait with the coefficient used to calculate the dynamics of the relative frequencies of that variant across generations. Therefore, it is important to note that with ‘fitness’ we do not mean biological fitness of the organism bearing that variant. Rather, we mean a coefficient linking the relative frequency of a cultural variant in the set of all relevant alternative cultural variants across generations. Note that we also presuppose a notion of relevant alternatives here. Since a cultural variant cannot be blended with every other cultural variant, we are only interested in the relative frequencies of cultural variants that can be blended together. For example, it is possible to mix different styles of piano playing to “create” a new style, but it is impossible to mix a piano-playing style with a way of cooking (although cooking styles themselves might be mixed with one another). We assume that categories in which cultural variants or traits can be blended together are given by their cultural function in the first place. This cultural evolutionary function plays a significant role in the emergence of higher-order categories or types. A philosophical approach that encapsulates this idea is teleofunctionalism (Millikan Reference Millikan1984, Reference Millikan and Millikan2005).
An example will illustrate the principle of fitness enhancement via blending along the lines of figure 1: on the lower-left side we see trait a, which is passed on from the mother generation (a 1) to the daughter generation (a 2). For illustrative purposes, let us assume that the generations are political election cycles, and the traits are political dispositions, such as being left or right wing (cf. Boyd and Richerson Reference Boyd and Richerson1988, 70; Mesoudi Reference Mesoudi2011, 61). More specifically, the traits should be interpreted as manifestations of such dispositions, such as acting x% in accordance with left-wing politics. In this interpretation, a blended trait is a mixed manifestation of two dispositions, for example, acting 70% according to right-wing and 30% according to left-wing politics. The left side of figure 1 shows a simple case of particulate inheritance with two such variants (a 2, b 2) at generation 2. On the right, blending inheritance is depicted. Here, trait a was not fit for one reason or another, so we do not find it anymore in the daughter generations. However, a new (unblended) variant b arose, as well as a blended variant ab. Let us assume a proportion of 70% (b) to 30% (a) in ab. Let us further assume that the 30% of a were not the reason why it died out, meaning that they are not maladaptive given a certain environment. To the contrary: maybe the agent who mixed it into the new combined trait approved it as useful. The resulting macrolevel structure (right side, top) exposes two hypothetical daughter species B and A′, where the latter holds the combined trait ab. Assuming that the 30% of a that remained in ab are useful and even provide some increase in success, the cultural species A′ should now be fitter than in the left case. In this way, blending inheritance might prove to be advantageous. It is important to note that this view of blending as a principle of fitness enhancement presupposes that blending is adaptive. Trait ab with 30% a and 70% b only increases fitness if, roughly speaking, ab manifests a in the 30% of cases in which a is advantageous to b, and ab manifests b in the 70% of cases in which b is advantageous to a. We call this form of blending adaptive blending. If ab would manifest a in 30% of the b-advantageous cases, and b in 30% of the a-advantageous cases as well as 40% of the b-advantageous cases, blending would be maladaptive. We can also define the notion of random blending in which ab manifests a and b with random frequency (a 30% and b 70%). Random blending does not generally enhance fitness. It is important to distinguish these three forms of blending (adaptive, maladaptive, and random) because our model in section 4 focuses on adaptive blending only and shows under which assumptions it is optimal.
2.2. Identifying Cultural Evolutionary Biases as Social Learning Strategies
According to Boyd and Richerson (Reference Boyd and Richerson1988, 72), cultural transmission is often employed by individuals who try to estimate which behavior of other individuals in their environment has been favored by selection in previous generations. This form of transmission can be characterized as social learning, as opposed to individual learning, where one achieves information and knowledge via a process of trial and error (e.g., in experiments).
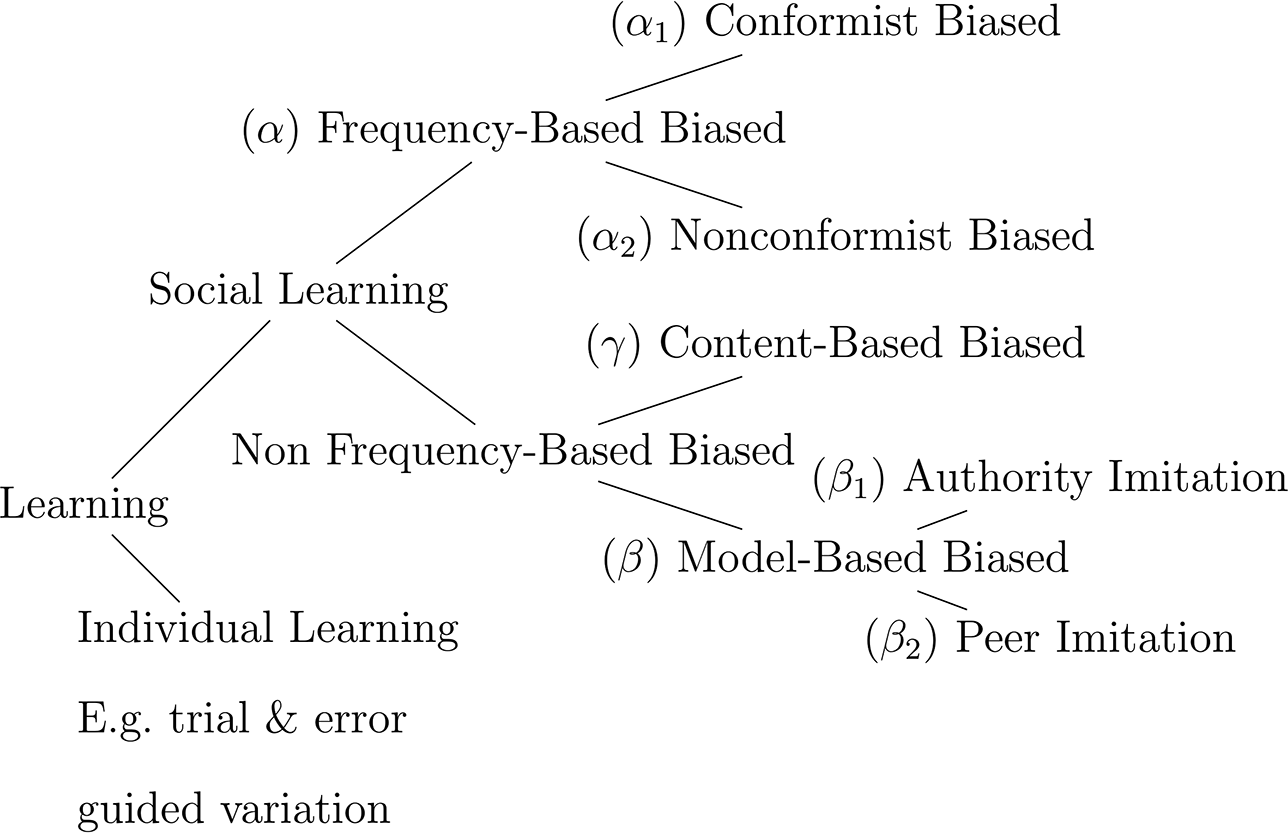
Modeling cultural evolution in the framework of social learning allows us to spell out two basic features of generalized Darwinism, variation and inheritance. The third feature, selection, enriches cultural modeling by introducing “forces of cultural evolution” in the form of biases. According to Richerson and Boyd (Reference Richerson and Boyd2005, 68), the three most important biases are content-based biases, model-based biases, and frequency-based biases. In Boyd and Richerson (Reference Boyd and Richerson1988, 135), content-based bias is also referred to as ‘direct bias’, which means that one cultural variant is more attractive to the learner than others. So, the probability of such a variant being chosen by a social learner is higher than that of its alternatives. Model-based bias is referred to as ‘indirect bias’, which means that the choice of a cultural variant by the learner depends on how successful its bearer is in the mother generation. Model-based biases are active, for example, in authority imitation or peer imitation in which, apart from the prestige of the learner’s parental models, similarity of the parent to the learner influences success. Finally, frequency-based biases are active in a model of cultural evolution if the probability of choosing a variant among the set of all its alternatives depends on the frequency of the variant in the mother generation. If this probability is positively correlated with frequency, then the bias is a conformist one. If they are negatively correlated, then the bias is nonconformist. In figure 2, we provide a simplified taxonomy of these biases. They are considered different kinds of social learning because, according to Boyd and Richerson, “individuals select from among the alternative cultural variants that have been modeled for them rather than choosing among self-generated alternatives” (136).
Overview of social learning with different biases along the lines of Boyd and Richerson (Reference Boyd and Richerson1988, 135) and Richerson and Boyd (Reference Richerson and Boyd2005, 69).

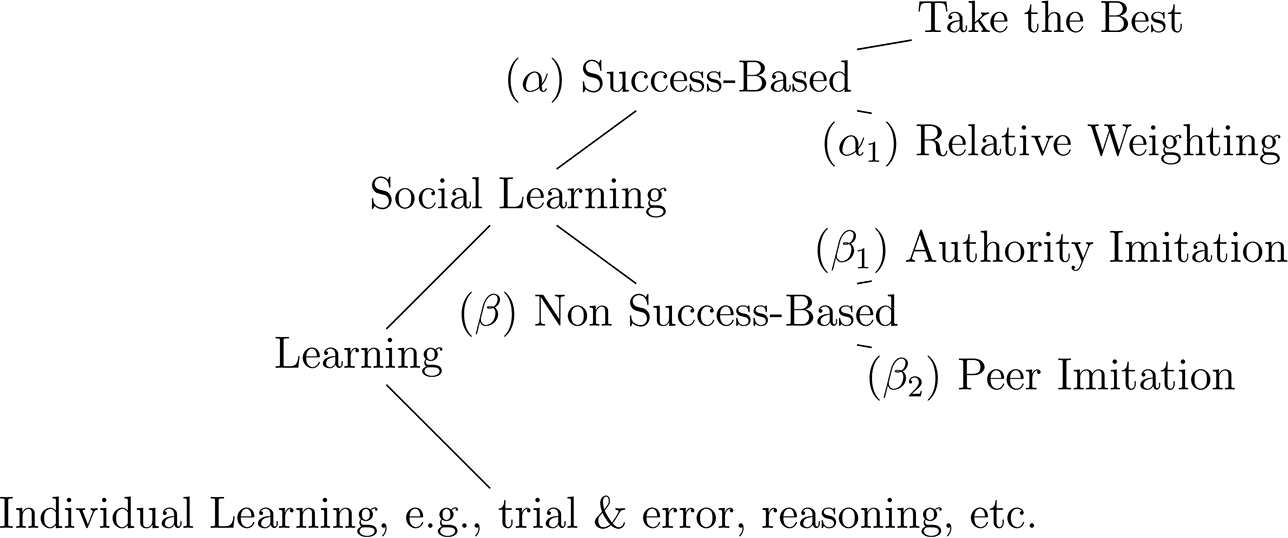
It is interesting to note that this taxonomy of different forms of biased learning (partially) matches a taxonomy of social learning as used in applied machine learning literature. Figure 3 gives a general overview of these different forms of social learning.
Overview of social learning strategies as used in machine learning applied in epistemology.

Learning can be either individual or social. Individual learning is trial-and-error learning, reasoning, and so on. Social learning strategies are either success based (α) or not success based (β). Success-based strategies accept more transmissions from successful parental traits than from unsuccessful ones. Take the best, for example, simply favors the most successful trait of the mother generation. Relative weighting, however, blends traits according to a weighted average, where the weights are proportional to the traits’ past success. In machine learning and in recent approaches of social epistemology, relative weighting is studied under the term meta-induction, since success-based weighting can be regarded as induction over success rates (Schurz Reference Schurz2008, Reference Schurz2019).
Comparing the two taxonomies, several points are worth noting: non-success-based social learning and non-frequency-based biased social learning cover not only the mentioned forms of imitation but also the so-called fast and frugal heuristics of Gigerenzer, Todd, and the ABC Research Group (Reference Gigerenzer and Todd1999). In contrast to the biases mentioned above, which are parameters of selection (Boyd and Richerson Reference Boyd and Richerson1988, 136), guided variation is a form of individual learning (see fig. 2) because it generates alternative cultural traits. It is common in cultural evolution (Mesoudi Reference Mesoudi2011, 63). Sufficiently rational agents will prefer some variants over others. In the context of cumulative evolution, this is not a problem but an advantage, because fewer dysfunctional mutations are passed on in the evolutionary dynamic. The space of possibilities of variants (many of which are indeed dysfunctional) shrinks, and that leads to an acceleration of the generation of complexity in cultural evolution in comparison to natural evolution.
Furthermore, note that the notion of success as it is used in the taxonomy of figure 3 might be different from the notion of success in the sense of prestige that is employed by Richerson and Boyd (Reference Richerson and Boyd2005) for describing model-based biased social learning (β in fig. 2). In fact, in our model of blending inheritance in section 4 we equate the success of a cultural variant with the frequency of the variant in the mother generation. For this reason, success-based social learning according to the taxonomy of figure 3 is, at a surface level, comparable to the frequency-based biased social learning of figure 2 (both αs). However, the important difference between both models of frequency-dependent cultural transmission is that frequency-based biased cultural transmission (fig. 2) is not blending, since it selects only among the cultural alternatives provided by the mother generation, whereas frequency-based relative weighting (fig. 3) is blending, since it creates new cultural variants. In this respect, our way of modeling blending is closer to the model of guided variation of Boyd and Richerson (Reference Boyd and Richerson1988, 136). Therefore, we will concentrate on this model and not on their model on frequency-dependent biased social learning.
In order to embed our model even deeper into recent debates about learning and cultural evolution, let us briefly highlight another model from the literature that resembles our approach in some features but differs in others. In a series of papers, Griffiths and Kalish (Reference Griffiths and Kalish2007) develop an iterative learning framework with Bayesian agents, which combines individual and social learning, occupying a middle ground between the two. Focusing on the evolution of language, the authors present a dynamic analysis of social learning. They understand the process of learning as an agent choosing from a set of hypotheses and data. Applying Bayes’s rule (an ability that the agent must be capable of; Griffiths and Kalish Reference Griffiths and Kalish2007, 472, assumption 3), an agent can choose either a given hypothesis (which she has acquired via the observation of others) or new data in light of a given hypothesis (444). Griffiths and Kalish primarily focus on and reflect the strong influence of the (Bayesian) prior of the learner and its effects on the accuracy of transmission processes. Convergence of the probability that a learner speaks a particular language to the prior probability the learner assigns to that language occurs regardless of the amount of data available to each learner (444). Their mathematical findings suggest that the influence of inductive biases (individual constraints on learning which influence our conclusions from incomplete knowledge) seem to have a very strong effect on iterated social learning. Furthermore, inductive biases strongly resemble cultural guided variation, since both emphasize the individual aspect of learning (Mesoudi Reference Mesoudi2011). In contrast to these models, our investigation (see sec. 4) focuses merely on the process of social learning, meaning that our agents lack any form of individual bias. However, as we will see, a purely social learner can still achieve optimal performance.
Having illustrated what blending inheritance is and how it influences the process of cultural evolution, we now take a closer look at the formal structure of a success-based mechanism of cultural inheritance by studying models of cultural evolution (sec. 3) and implementing blending in a success-based manner (sec. 4).
3. Models of Cultural Evolution
Boyd and Richerson (Reference Boyd and Richerson1988) investigate (almost) all forms of biased social learning as described in the taxonomy in figure 2: content-based biased social learning (chap. 5, parameter B, representing an inherent disposition of a cultural trait to be preferred against some other; cf. 138), model-based biased social learning (chap. 8, via the so-called runaway processes), and conformist frequency-based biased social learning (chap. 7, e.g., parameter D; 209). In the following section, we describe their model of blending inheritance via social learning in detail. Subsequently, we discuss a population dynamical model that serves as a basis for our model of success-based blending inheritance in section 4.
3.1. Cultural Evolution via Social Learning
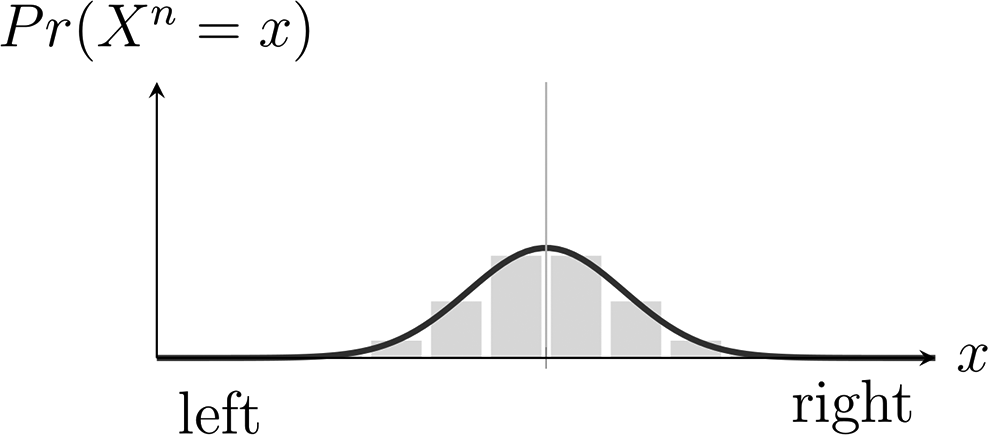
Boyd and Richerson argue that very often in the cultural realm data (e.g., data about people in a political spectrum) can be represented by a normal distribution. This means that one can take the frequencies, for example, of the number of left-wing, centered, and right-wing people and summarize them in a probability density of a normal distribution (see fig. 4). Thus, one defines the probability Pr of some member of the group being left-wing, and so on. The normal distribution is characterized by two factors: µ, the mean, which is also the frequencies’ median and mode, and σ, the standard deviation (i.e., the average deviation from µ), where σ 2 is considered to be a measure for variance within the sample. The probability that some of the X of generation n (i.e., some of Xn) take value x, for example, that some member of the group under consideration Xn holds position x in the political spectrum, is

Using this assumption, Boyd and Richerson propose a model for the transmission of cultural traits by means of social learning (see fig. 5). Their idea is that a cultural trait can be transmitted by individual learning (copying that is possibly defective) and social learning about an objective, an ideal state of the system. The model has the following parameters:
• Xn is the cultural trait to be copied under investigation, expressed as a random variable and defined by µ(Xn) and σ 2(Xn).
• s is the optimal state of the cultural trait; it is supposed to be the objective or goal value, that is, the value of the distribution that fares best in the system or habitat (Boyd and Richerson Reference Boyd and Richerson1988, 95, Γ(H) and H). So, in a sense, s encodes selective pressure: the closer an individual is to s, the better it will fare in the system.
• l is a parameter in [0, 1] that expresses the individuals’ propensity to rely on individual as opposed to social learning (Boyd and Richerson Reference Boyd and Richerson1988, 95, L). Individual learning is maximal if
 , and social learning is maximal if
.
• E is an error distribution that characterizes a deviation during the learning process due to environmental effects, random variation, and estimation errors (Boyd and Richerson Reference Boyd and Richerson1988, 71). It is defined by µ(E) and σ 2(E). Error E might be considered the cultural counterpart of mutation in natural evolution.
•
is the cultural trait of the next generation resulting from individual learning and social learning. It is defined by µ(
) and σ 2(
).


Example of a normal distribution of political attitudes (x) as a cultural trait in generation Xn. Whether political attitudes are normally distributed depends on the scale of measurement and the chosen categories; that is, it depends on whether the frequencies of the categories left, center left, center, center right, right (gray bars) or frequencies of other categories of political attitudes result in a Gaussian shape.

In short, cultural transmission from Xn to
 depends on individual, possibly defective, learning and cultural learning aiming at s; both are balanced by the parameter l. The influence of individual learning (encoded in Xn) is taken into account via the influence of error, that is, σ 2(E); the influence of social learning (s with error during social learning E) is taken into account via l. Calculating weights by normalizing, we end up with (Boyd and Richerson Reference Boyd and Richerson1988, 95, eq. [4.9])

Given that the learning error is not biased, that is,
 , Boyd and Richerson show that the resulting cultural trait is a density function with the following properties/values (Reference Boyd and Richerson1988, 96, eq. [4.10]):

Now, given
 (and a constant and uniform environment), it follows that iterated individual and social learning will lead to
 . Note that the model assumes that individual learning is fully implemented by the first summand in equation (1). Given the assumption that the learning error is not biased (which means that error is not functional), according to this model, s can be learned only if
 . If error E is functional, then also
 allows for learning s. An equilibrium of the system is reached, if
 . Since the weights
 and
 add up to 1, the value for the mean in equilibrium state,
 , is calculated as follows:

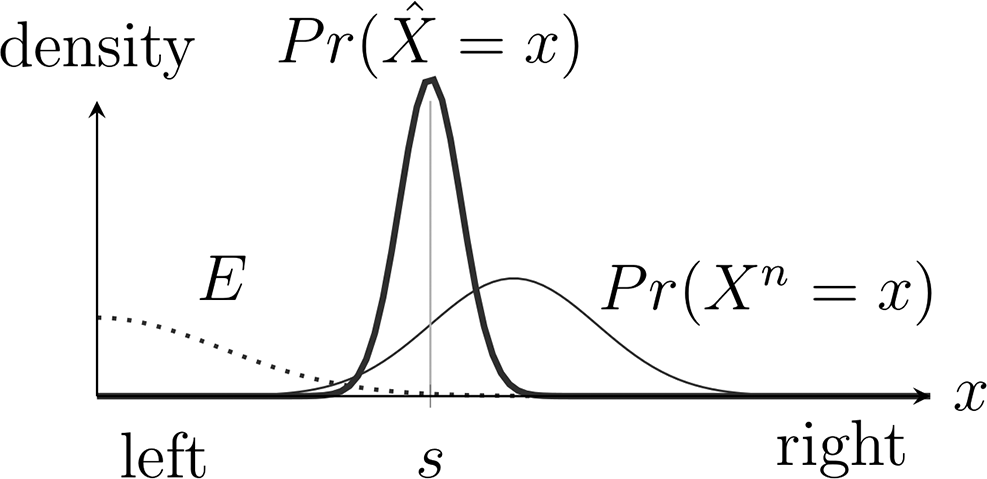
Such an equilibrium state is depicted in figure 6. The equilibrium variance is more complex but turns out to be

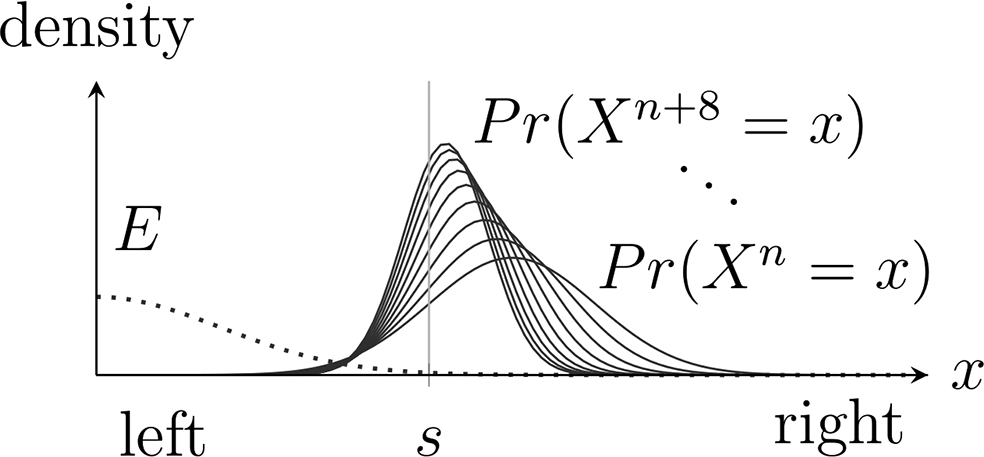
Political attitude with social learning in the model of Boyd and Richerson. Starting from the political attitude of generation n (Xn of fig. 4) through social learning with
 (here
 ), although defective, but unbiased (
 ), evolution via guided variation tends toward the best fitted political attitude with value s. (Data generated with Perl.)

Political attitude: equilibrium state
 centers around the political attitude best fitted with value s. (Data generated with Perl.)

It is important to note that we can map three relevant parameters in this model to the three modules of generalized Darwinism: selection is taking place via s, variation comes in two forms (guided variation via l, mutation via E), and the reproduction dynamics is captured via the cultural traits Xn,
 , … . This model and its interpretation show that a sufficiently high degree of information transmission into the next cultural generation suffices for cumulative cultural evolution. Exact replication of the original is not necessary (Henrich et al. Reference Henrich, Boyd and Richerson2008, misunderstanding 2).
This model was one of the first influential models of cultural evolution. It is relatively simple and allows for an explanation of reproductive success via social learning: through social learning the mean of a cultural trait (
 ) tends toward the best fitted value (s). However, there are also some restrictions to this model (Schurz Reference Schurz2011, 220). First, social learning is only successful in the strict sense of
 in case that there is no bias in the reproduction error (
). And second, selective pressure of social learning is held fixed in the model via the cross-generational parameter l. For this reason it is also independent from the reproduction rate, although frequency dependency is an important feature of cultural transmission. Boyd and Richerson (Reference Boyd and Richerson1988) discuss possibilities to relax these constraints. For example, also in case of a biased reproduction error one can still approach the learning target s, although there is no guarantee to, in fact, learn s. It seems that such an approximation can still be considered as learning success, and hence successful cultural transmission seems to be possible also in case of biased error. Regarding the problem that l is cross-generationally defined, Boyd and Richerson (99–100) discuss models in which l changes (because of genetic influence). However, this variation of l is still not dependent on the relative frequency of the cultural traits. Our model in section 4 aims at adding such frequency dependency to a model of blending. Furthermore, we want to expand Boyd and Richerson’s result on cultural transmission: we show that even without an objective learning target s, one can define a frequency-dependent social learning (blending) strategy that is long-run optimal. In the next section, we introduce the population dynamical model on which our model of blending inheritance is based.
3.2. Population Dynamics of Cultural Evolution
The first mathematical models of population dynamics trace back to Fisher and Haldane (Fisher Reference Fisher1930; Haldane Reference Haldane1964/2008). A clear and didactically valuable introduction is given by Ridley (Reference Ridley2004). Starting with a general scheme, different models for natural and cultural evolution are spelled out and refined. The general scheme has the following ingredients (Schurz Reference Schurz2011, sec. 12.3; notation adjusted to that above):
• v 1, …, vk … possible variants/values of a system; a set of variants V in a certain environment is called a population;
•
… relative frequency of Xn taking value vi;• Generations:
: The relative frequency of vis in the next generation (
).


The simplest models of population dynamics operate only on the variants’ frequencies across different generations—these are models of cultural reproduction. By introducing a selection coefficient s that constrains the variants’ frequencies across different generations, these models are expanded to models of cultural reproduction and selection (Schurz Reference Schurz2011, 285, 292). In a further step, one can take variation (in a wide sense) into account via biases in errors. This can be done by introducing a parameter m into the dynamics that represents the mutation rate of a variant. For example, a mutation of variant v 1 to variant v 2 in .1% of the cases could be represented by
 , so
 is the number of v 1 variants in generation Xn that mutate back to v 2 variants in generation
 . Of course, mutation can also take place the other way round, from v 2 to v 1, but we assume that this direction is already subtracted from the higher mutation rate (so, e.g.,
 ). Furthermore, it is important to note that mutation is understood only as mutation from one variant of a population X to another. The evolution of new variants is not covered here. This is also the reason why we expand the model in the next section in order to describe such an evolution of new variants, that is, evolution by blending.
In order to implement a mutation mechanism into the dynamics, the number of mutated variants must be subtracted from and added to the frequency of the variant. The resulting formula is as follows:

The selection coefficient s of this model measures fitness in the sense of selective advantage and not selective disadvantage (as is the more common use of the term ‘selection coefficient’). We choose s as a measure for selective advantage to use terminology coherent to the preceding section (where s was interpreted as the relevant parameter for selection).
The question of an equilibrium of a variant in this model is stated similarly as in the model of Boyd and Richerson by equating
 . Biased error, implemented via a mutation rate m, allows for an equilibrium where not all the other variants disappear completely. So, in the case of two variants with a positive selection of variant v 1, the frequency of v 1 has to reach only
 in order to be in an equilibrium (
). If
 and
 , the equilibrium state is at
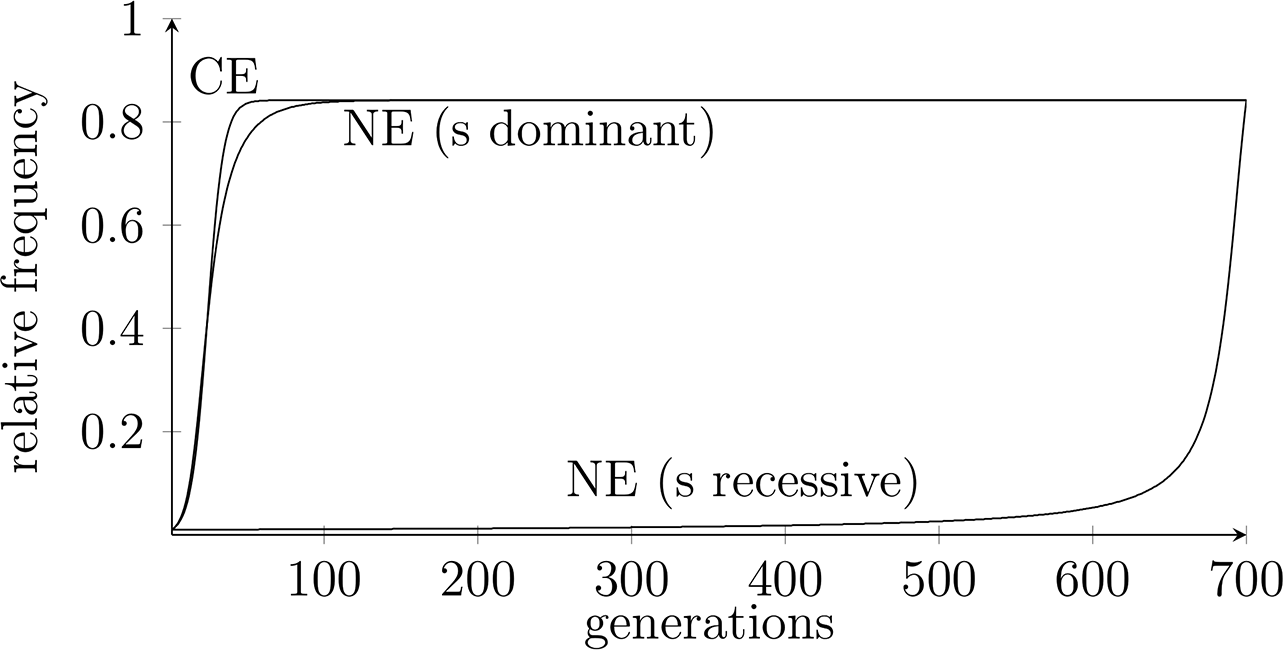
 (Schurz Reference Schurz2011, 300). Figure 7 depicts a case of a population dynamics with selection, variation (mutation), and reproduction. The mutation rate of a variant vi has to be smaller than the selective advantage of that variant. Otherwise it will disappear (mutate away) before it can become positively selected.
Natural and cultural evolution with reproduction, selection, and mutation in the population dynamical model of Schurz (Reference Schurz2011). Parameters: natural evolution, selection of a dominant allele (NE (s dominant)):
 ,
 ,
 ,
 ,
 ; natural evolution, selection of a recessive allele (NE (s recessive)):
 ,
 ,
 ,
 ,
 ; cultural evolution (CE):
 ,
 ,
 ,
 ,
 . The equilibrium state is reached at a relative frequency
 . Only the positively selected variant’s progression is depicted. (Data generated with Perl.)

As we have mentioned in the preceding section, in the model of Boyd and Richerson, the parameter l weights the importance of social learning but is the same for all variants and independent from the variants’ reproductive success. In cultural evolution, however, it seems that social learning is correlated with reproductive success. It is positively correlated when conformity (positive frequency dependency) is relevant for fitness, and it is negatively correlated when originality (negative frequency dependency) marks a fit variant. Note that frequency dependency does not automatically imply that traits with higher fitness in the sense of higher frequency are also learned more frequently. Rather, frequency dependency means that the fitness coefficients are themselves a function of the frequency of the traits. This is an important difference, since because of such frequency dependency, a stable equilibrium is no longer guaranteed, but ongoing oscillations are possible (such cases are also covered by our model).
In the above equation such a dependency can be implemented via fine-graining the selection coefficient si of a variant vi by making it dependent on the frequency of the variant (
 ). By this we finally end up with the following model:

Schurz (Reference Schurz2011, chap. 14.1) shows that linear dependence of si to
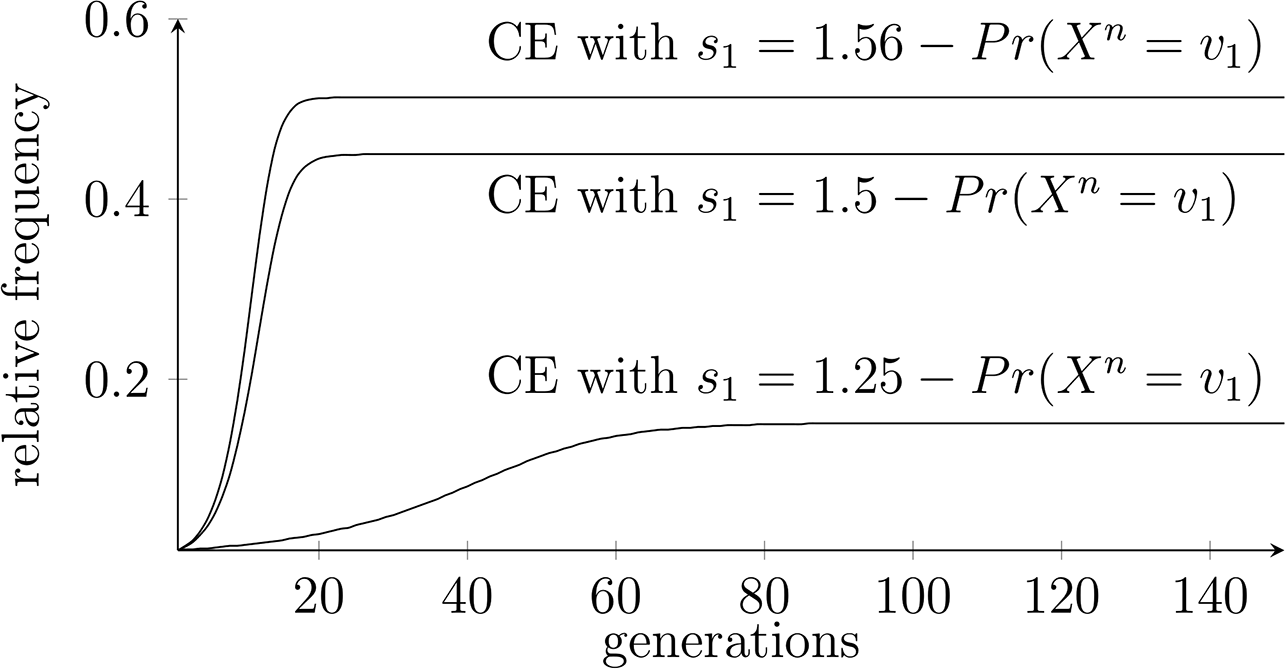
 does not change the equilibrium state in case of a positive or in case of a negative dependency (such a case is depicted in fig. 8). Things turn out to be different for nonlinear dependence: there, negative dependency leads to oscillations, whereas positive dependency might switch the equilibrium state to another extreme.
Cultural evolution with reproduction, selection, and mutation in a frequency-dependent model. Parameters: si is frequency dependent,
 ,
 ;
 . In case of a linear dependence of more than 1.56 times the ancestor frequency, v 1 takes over v 2 in the equilibrium state. (Data generated with Perl.)

The models presented so far combine several features: Boyd and Richerson’s model allows for blending inheritance by the combination of variants via social learning, but it does not implement frequency dependency. In addition, the population dynamical model presented in equation (2) implements frequency dependency but does not include blending. In the following section, we combine both approaches by expanding this model to a model in which variants are blended.
4. A Success-Based Model of Blending Inheritance
In this section, we spell out the frequency dependency of the selection parameter s used in the foregoing model in more detail. As we will see soon, this allows for blending via social learning. Schurz (Reference Schurz2011) mentions this expansion of his model and highlights its significance: “Despite the realm of epistemology, meta-induction [understood as success-based blending] is also of utmost importance for cultural evolution. In cultural evolution, innate cognitive modules play the role of non-inductive strategies, individual trial-and-error learning plays the role of object-inductive strategies, and meta-inductive strategies correspond to methods of social learning. The optimality results of meta-induction explain the advantage of creatures who are able to undergo change through cultural evolution” (387–88, our translation).
The main idea underlying the expansion of the model is to make the selection coefficient for a variant vi (i.e., si) not only dependent on the frequency of the variant (
 ) but also dependent on the frequencies of the other variants. Whereas the dependency of si on
 alone is called reflective frequency dependency, the latter is called interactive frequency dependency (Schurz Reference Schurz2011, 311). In biology, several models for interactive frequency dependency have been discussed, for example, the so-called predator-prey equations of Alfred J. Lotka and Vito Volterra (note that in predator-prey equation models dying out is possible, and thus they allow for changes in the absolute population size, while in the models discussed so far the absolute population size is fixed). Also in the cultural domain, interactive frequency-dependent selection has been investigated regarding the development of meaning (Mühlenbernd and Franke Reference Mühlenbernd, Franke, Herzig and Lorini2014, sec. 1): in a generalized evolutionary game theory, one might try to spell out evolutionary strategies that interact with one another, resulting in models of interactive frequency dependency. The investigation of Mühlenbernd and Franke already makes use of success-based imitation or reproduction. However, a relevant difference to our approach is that we introduce relative-success-based blending, which allows for an optimality result for an equilibrium state tending in a similar direction as that of Boyd and Richerson presented above. In what follows we spell out our approach in more detail.
4.1. The Model and Some Analytic Results
Assuming that the fitness or success of a variant vi consists in its magnitude or relative frequency
 , one can try to socially learn from variants by blending the relatively successful ones. To return to the example of Boyd and Richerson, if v 1 and v 2 are the most successful variants centering around the correct or ideal state s, then blending v 1 and v 2 to
 might be interpreted as socially learning from these variants that also center around the ideal state. Boyd and Richerson interpret social learning as erroneous (E) taking into account the ideal state (s) to some fixed degree (l). In our model, we interpret social learning as blending those variants (vi) that were relatively successfully in terms of frequencies (
). The formal theory of this interpretation stems from mathematical learning theory in general and from the theory of online predictions based on expert advice in particular (Cesa-Bianchi and Lugosi Reference Cesa-Bianchi and Lugosi2006; Schurz Reference Schurz2008, Reference Schurz2019). An important result of this theory is the observation that relative-success-based weighting (cf. α1 in the taxonomy of fig. 3) turns out to be long-run access optimal in every environment or habitat (even oscillating ones).
The ingredients of our model are the same as that of the population dynamical model of the preceding section. However, we assume that there is a learning variant vl (for some
 ). For this variant, the selection coefficient sl is made relative-success dependent on all variant’s past frequencies. We will implement this by varying vl at each generation depending on all variants’ past frequencies. The idea is that by such a blending/learning, vl approximates the most successful variants in the long run. Here are the details of the blending mechanism we propose:
• We define a loss function, which calculates the difference between the relative frequency of a variant from the best fitted variant in a generation n and normalizes it (∈ [0,1]):
(Note that in machine learning literature the difference between a variant’s [cumulative] loss and the best variant’s [cumulative] loss is also called the “regret” of the variant with respect to the best variant; e.g., Cesa-Bianchi and Lugosi Reference Cesa-Bianchi and Lugosi2006, 2.)
• Using this loss function, we define a measure for normalized success of a variant up to generation n as the inverse of the average natural loss:
• Using the normalized success of a variant up to generation n, we define the relative success of a variant with respect to the social learning variant vl up to generation n by cutting off (i.e., setting 0) the normalized success of those variants that fare worse than the social learning variant vl:
(What we call “relative success” here is also called “attractivity” in the literature on meta-induction; we opted for the former expression because the latter is also used in Sperber’s cultural attraction model and might have caused confusion here; for meta-inductive attractivity, see Schurz Reference Schurz2008, sec. 7.)
• Using the relative success of a variant up to generation n, we define a weight for the variant for generation
by normalizing the relative success:
• And, finally, using these weights for generation
, we define the social learning of variant vl for generation
as
Here,
may be defined as blending by unweighted averaging variants:


All the nonlearning variants (vi with
 ) remain constant. It is assumed that they can be represented by real numbers as, for example, political attitudes on a real-valued spectrum. For their dynamics, the equation of the reflective frequency-dependent model of Schurz (Reference Schurz2011) holds (si is only reflective frequency dependent). For the learning variant vl, the equation must be adapted by considering the interactive frequency dependency of vl:

Since
 and
 are functions on the frequencies of all variants, the selection coefficient sl also turns out the be a function of these, and by this sl is interactively frequency dependent.
How do we estimate the equilibrium state for the social learning variant vl; that is, what happens if
 ? The situation is quite difficult to analyze. However, if de facto no change takes place any more (i.e., if there really is an equilibrium), then
 . Now, optimality results of social learning via meta-induction state that the normalized success of a learning variant vl approaches the normalized success of the best variant(s) in the limit if the loss function is convex. Since dn(i) is a linear combination of convex functions, dn(i) is also convex, so we can employ the following optimality result (cf. Schurz Reference Schurz2008, 297; for a simplified proof, cf. Feldbacher-Escamilla Reference Feldbacher-Escamilla2018, appendix):

Since the equilibrium state equals the limiting case, this optimality result holds for the equilibrium state too:

So, in the equilibrium state the normalized success of the learning variant vl is at least as high as that of the best fitted nonlearning variant. If we identify the best fitted variant in this state with vb, then we get—in analogy to the result of Boyd and Richerson (
 )—the limiting result for the learning variant:

However, the model is not restricted to the equilibrium case, with a best fitted variant vb; vl proves to be long-run optimal regarding any development of the variants, even if the frequencies of the variants do not converge to a limit but oscillate (Schurz Reference Schurz2008, optimality results). Recall the learning target of Boyd and Richerson’s model, namely, to end up with (ideal) s or approximate it. In contrast to this, our model of blending inheritance (vl) aims at optimization in terms of approximating the best variants or even outperforming them.
4.2. Some Provisos and a Simulation
We had to make some assumptions in order to transfer the optimality result for the equilibrium state
 . In what follows, we provide a brief discussion of those assumptions.
First, the blended variant is guaranteed to fare well in the long run with respect to all the other variants. Whereas in Boyd and Richerson’s model, s can be the truly maximal/ideal state of the system, in our model, s matches only the best variants within the system. It is possible that, in reality, another variant would fare much better, but vl may never approach it because it only blends accessible variants. So, a wide range of accessible variants is presupposed in our model in order for vl to perform well. Note, however, that the assumption of a constant absolute population size guarantees at least some minimal fitness. Since in evolutionary theory a comparative stance regarding success is much more common than an absolute stance, this restriction should not be a problem.
Second, blending is very strong regarding the informational basis: all past frequencies of accessible variants must be considered in calculating the weights for vl’s blending. Furthermore, since we assume adaptive blending, the learning variant also needs to be able to identify relevant features of the environment and partition the frequencies to different types of environments. For real cases, a restriction of such a strong assumption has to be considered.
Third, the optimality of variant vl with respect to the other variants v 1, …, v k in terms of relative frequencies is guaranteed only for the long run, that is, in the limit. In the short run, the performance of vl depends on the exact evolutionary system under investigation. However, one can derive exact boundaries for the short run performance of vl (Schurz Reference Schurz2008, 297):
 . Short-run performance of relative-success-based blending is guaranteed to be within this bound; however, with the help of simulations one might also study improved performance of such blending. We conclude this section with a simulation to illustrate relative-success-based blending inheritance.
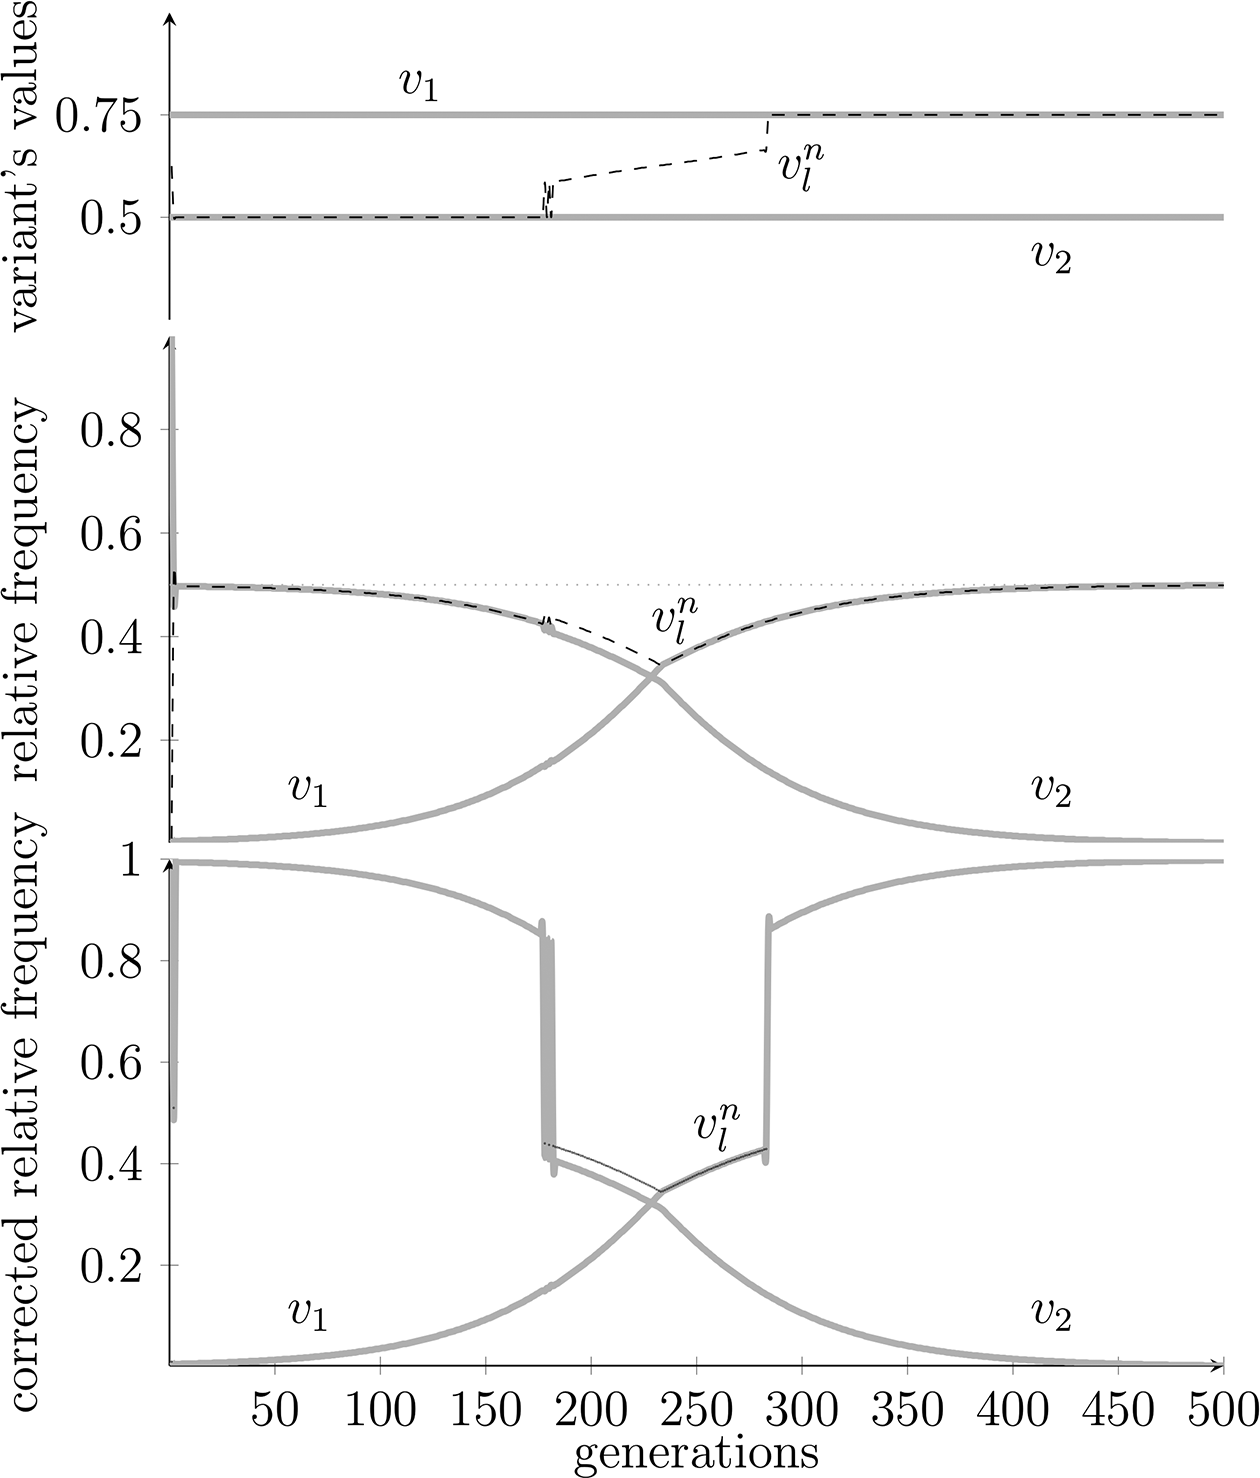
Figure 9 illustrates a simulation of a case of blending via relative-success-based weighting: the learning variant vl weights the better performing variants according to their past success in terms of relative frequencies. In the top diagram, the development of vl is illustrated. Regarding relative frequencies, the “cake is sliced,” of course, which means that if vl equals one of the other variants, the success rate in terms of relative frequencies also equals that of the other variant. This fact is depicted in the middle diagram. The slice of frequencies is corrected in the bottom diagram, where the relative frequencies of equal variants (values that, strictly speaking, cannot be distinguished) are added up. There, the learning variant vl coincides with one of the two variants of the setting (v 1, v 2), except in cases in which a shift in the relative-success rates occurs. In such cases, vl represents proper blending. It is rewarded with a bonus—here modeled with a fixed parameter of +5% population size compared to the size of the better of the two variants v 1 and v 2. Note that this parameter models the assumption that blending is adaptive. The so-defined learning variant vl can be shown to be expectation optimal (Schurz Reference Schurz2019, sec. 6.7.1) also for the case of random blending. However, to flesh out such an expansion will be the subject of future investigation.
Cultural evolution with reproduction, selection, and no mutation with blending inheritance via relative-success-based weighting in an interactive frequency-dependent model. Parameters:
 ,
 ,
 ,
 ; the variants are
 ,
 ; the mutation rates are 0:
 ; vl starts with the frequency of v 1; that is,
 ; if
 is not blended (unweighted imitation of variant v 1 or v 2), then
 equals the frequency of the imitated variant v 1 or v 2:
 or
 ; if
 is blended, that is, weighting v 1 and v 2, then
 has a blending advantage/bonus of +5% over the better variant; this implements the assumption that blending is adaptive; the fallback option of
 , that is, its value if none of the variants has an attractivity above 0, is
 . (Data generated with Perl.)

5. Conclusion
We have examined the phenomenon of blending inheritance within the framework of cultural evolution. Although cultural and natural evolution may share some relevant core properties on a general level of description—the applicability of an evolutionary algorithm consisting of variation, selection, and reproduction—they also differ in some crucial and less crucial aspects. One of the differences regards inheritance. Whereas in natural evolution inheritance consists of a transmission of discrete units, in the cultural realm inheritance happens, among others, via blending. Following Mesoudi (Reference Mesoudi2011) and the seminal work of Boyd and Richerson (Reference Boyd and Richerson1988), blending is a process of mixing ideas and behavior in a nonrandom manner. Such cultural transmission is often constituted by individuals who try to estimate which behavior of other individuals in their immediate environment may have been favored by selection in previous generations. This fact is captured by several forms of learning dynamics in general and forms of average imitation in particular.
In the second part of the article, we took a closer look at the formal structure of cultural transmission. To implement a proper formal model that captures as many facets of cultural transmission as possible and feasible, we proposed the merger of two famous approaches to cultural evolution, the classical statistical model of information transmission by Boyd and Richerson (Reference Boyd and Richerson1988) and population dynamical models as presented, for example, by Schurz (Reference Schurz2011).
The first model allows for blending inheritance and the achievement of an ideal state s of a system, if such a state exists. The second model allows for so-called interactive frequency dependency, a key feature of cultural transmission, but does not implement blending inheritance. A combination of the two models captures as many facets as possible.
Our formal expansion allows not only for reflective but also for interactive frequency dependency. Not only is its selection coefficient of any given variant of a cultural trait dependent on the variant’s frequency, but its fitness depends also on the frequency of other variants. It is a form of relative-success-based blending, where an agent observes the success rates of other agents, respective to the fitness of their cultural traits, and then combines them into a weighted average. A general result shows that, in the long run, the normalized success of this form of social learning or relative-success-based cultural inheritance of traits is at least as good as the fittest nonlearning variant.
Blending inheritance allows for an increase in relative frequency of a cultural trait; therefore, it is rationally applicable and probably one of the main reasons for the speed of cultural evolution. If we assume that agents blend traits together under a success-guided principle of weighting, this strategy is guaranteed to produce new and—in the long run—more successful traits in cultural evolution.