


Introduction
The well-known general effects of wind transport on the snowpack have been well described by many authors. We shall quote principally Reference Pomeroy and GrayPomeroy and Gray (1995), hereafter called PG95, and Reference Liston and SturmListon and Sturm (1998), hereafter called LS98, because we work in the framework of a numerical operational system of avalanche-hazard forecasting and we aim to take more fully into account the effects of snow accumulation and erosion along the wind-flow direction. Our use of computed snow-crystal characteristics, variable in time, is also very close to the approach of Reference Fierz and GauerFierz and Gauer (1998) or Reference Lehning, Doorschot and BarteltLehning and others (2000) who combine a complete numerical modelling of the snow cover with additional effects due to the drifted snow.
In order to better understand the phenomena and to test different algorithms, Meteo-France and CEMAGREF (two French laboratories working in avalanche research) have operated an instrumented site at 2700ma.s.l near the ski resort of Alpe d’Huez for 10 years (see Reference Guyomarc’h and MerindolGuyomarc’h and Merindol (1998), hereafter called GM98). Different kinds of experimentation have been conducted, and this work presents the attempt to include the knowledge gained into our automated forecast simulation at the regional scale. This scale of about 500 km2 corresponds to the working scale of the SAFRAN/Crocus/MEPRA (SCM) chain (Reference Durand, Giraud, Brun, Mérindol and MartinDurand and others, 1999), the current practical limitations of which are described in the next paragraph.
The purpose of this work is thus to simulate routinely at this working scale the effects of the wind transport which occurs at a smaller scale but affects our scale. We do not simulate the phenomena exactly, but we try to capture their effects in a larger-scale simulation. Such an attempt has already been mentioned by Reference GauerGauer (1998b). These kinds of simulations are common in numerical meteorology and are generally called “parameterization” (one of the best-known is the simulation of the convective effects with a length scale of about 1km within a meteorological mesoscale model of about 30 km length scale). Our points of study have thus been:
Defining an appropriate wind parameter (such as the shear velocity) to assess the initiation and intensity of the snow transport.
The occurrence of blowing snow as an interaction between snow characteristics and the local wind. The corresponding snow-transport rates for creep, saltation, suspension and sublimation must also be considered.
The final crystal characteristics of the drifted snow before redeposition.
All these computations are done inside the SYTRON software which has been inserted into the SCM chain. It combines the shear velocity estimation deduced from SAFRAN (Reference Durand, Brun, Merindol, Guyomarc’h, Lesaffre and MartinDurand and others, 1993) with the snow characteristics simulated by Crocus (Reference Brun, Martin, Simon, Gendre and ColéouBrun and others, 1989, Reference Brun, David, Sudul and Brunot1992) and the occurrence of transport estimated by the PROTEON method (GM98). In this new pre-operational approach, the previous model PROTEON is now fully embedded in SYTRON and is mainly used to determine if a drift event is possible according to the snow surface features and the wind speed.
This approach can be operationally generalized in order to diagnose and then estimate the transported amount of snow (accumulated or eroded) at all elevations of the massifs studied by SCM. To this end, an imaginary ridge between two opposite aspects is simulated at the elevations required by SCM. This could accomplish the current operational evaluations of numerical snow profiles where the effects of wind transport are presently ignored. All computations are performed on a simulated snowpack, the texture of which can be directly related to the International Snow Crystal Classification (Reference ColbeckColbeck and others, 1990).
All the results presented here refer to the Col du Lac Blanc observation site and correspond to the preliminary tests of this operational generalization to all the massifs. No results concerning the stratigraphy, as shown in Reference Fierz and GauerFierz and Gauer (1998), are available yet, but this important point will be investigated due to its prime importance in avalanche-hazard estimation.
Short Description, Limitations of the Current System and Ways of Improving it
The current system is mainly composed of the SCM chain which simulates the snowpack at different fixed elevations and aspects of several mountainous massifs. The results are obtained hourly on an “idealized” orography of three slopes (flat, 20° and 40°) not directly linked to the real terrain. This is the main weakness of the system, which cannot take into account small features due to the local effects of wind, orography or vegetation. However, SCM provides an hourly set of both meteorological and snow conditions which includes a detailed stratigraphy of all layers.
The SCM results are presently completed by an estimate of the driftability of the surface layers provided by PROTEON. As described by GM98, PROTEON combines the information of the Crocus snow profiles, which are summarized in a “snow-particle” mobility index, and a wind estimation that provides a final snow-driftability index. The initial wind velocity used by PROTEON is derived from a statistical adaptation of meteorological models (Reference Guyomarc’h, Merindol and OlafssonGuyomarc’h and others, 1998) and is thus only available at one precise location (the instrumented site where the statistical learning had been made). That precludes any use of this model at another location and constitutes the most severe limitation on its operational use. We will begin with the same approach as Reference Li and PomeroyLi and Pomeroy (1997) which consists in linking the wind-transport (or shear velocity) estimation to the routinely observed wind, and we will add a second level of computation where wind speed is deduced from the SAFRAN outputs.
The purpose of this work is to fully merge these models in order to modify directly the simulated snowpack through the wind action in a routine mode. The coupling is done hourly; this time-scale allows snowdrifting to begin and finish as soon as the surface snow crystals are no longer driftable relative to the simulated shear velocity.
Three main actions were undertaken:
An hourly wind estimation (speed and direction) by SAFRAN.
The determination of the amount of transported (eroded and accumulated) snow when drift is detected by the PROTEON method.
The modification of Crocus in order to incorporate these new “sink” or “source” terms.
The corresponding quantities were measured at the instrumented site, and a numerical validation was performed on these data, which is presented in the “First results and comments” section.
The Observation Site
The experimental site, already used for studies on blowing-snow periods, is located in the French Alps near Grenoble, at 2700ma.s.l. The aim of this experimental area is to investigate the effects of drifting snow in high mountainous regions. These experimental equipments and measurements are expected to provide a link between field observations of snow characteristics and our theoretical understanding of the time necessary to erode or accumulate a certain quantity of snow depending on the snow-grain morphological features.
A large north-south-oriented pass, Col du Lac Blanc, was chosen for this research programme. At this location, the wind is generally similarly channelled and is often strong during winter. This characteristic is clearly shown by the frequency of winds from either north or south (92% of the cases). There are only a few cases of easterly winds and almost no cases of westerly winds. Several parameters (air temperature, wind direction and speed, snow depth, water equivalent of precipitation) are recorded hourly by a sheltered computer and transmitted to Grenoble on request. Close by, on both slopes of the pass (varying around 15°), two areas (of about 300 m2) have been chosen where complementary snow-depth measurements (averaged on 20 points) are performed regularly. Concurrently, wind and snow conditions (along snow-pole profiles) are monitored on nearby sites chosen for their exposure to wind effects.
Determination of an Available Analyzed Shear Velocity
As explained in Reference Durand, Brun, Merindol, Guyomarc’h, Lesaffre and MartinDurand and others (1993), the objective analysis SAFRAN computes two estimations of the wind velocity field for each elevation, massif and aspect. The first is directly used by Crocus in the computation of its vertical eddy fluxes, sensible and latent heat, while the second is much less influenced by the ambient atmospheric turbulence. The first value (hereafter called “surface” wind and denoted by Ws) represents the wind speed at the bottom of the local friction layer, while the second (called “free” wind and denoted by Wf) is at the top, near the free atmosphere. Prior investigations and comparisons with field observations have shown that none of these wind estimations were directly suitable for numerical wind-transport simulations; the surface wind being on average too weak and the free wind too strong when they were compared to the PROTEON wind estimation and the field observations.
A cross-comparison between the measured velocity, the PROTEON estimation during the identified snowdrifting events and the data of other sites has led to a generalized empirical estimation of a transport velocity. This velocity, Wt, can be inserted in the computation of the PROTEON snow-driftability index instead of the previously used statistical wind estimate. Wt is directly related to the shear velocity and is obtained from simple linear interpolation:

The coefficient a depends on the elevation (z) and the maximum elevation of the considered massif (zm), all expressed in meters, according to:
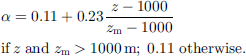
This relationship has been validated at other locations as presented in Figure 1. This figure shows the rms between the observed wind (recorded by an automatic station) and our estimate derived automatically from the two winds computed in real time by SAFRAN on some of the study sites. The results have been estimated satisfactorily although two sites (Les Menuires in the Vanoise massif and Val-Cems in Haute-Maunenne) exhibit a rms (computed on 5 years) of > 2 m s–1; these bad values are explained by specific local conditions poorly accounted for by the SAFRAN winds.
Rms of the difference between measured values of wind velocity at eight automatic sites and three SAFRAN wind estimations. The bars noted “SURF” correspond to the surface wind evaluation (Ws in the text), while ’FREE” represent the simulated ’free-atmosphere” wind (Wf in the text). The bars noted “MIX” correspond to the wind-transport evaluation (Wt in the text).

In the case of a flat area, this linear expression also has a direct relationship with a neutral formulation of the boundary-layer structure, leading to the well-known Prandtl expression of wind velocity Wz at height z.

where u∗ (m s–1) is the friction velocity, k (≈ 0.4) is the von Karman constant and z0 is the surface roughness length. Inserting Equation (3) into Equation (1) gives a rough indication of the equivalent height (Z) of our estimation Wt through the following trivial relationship:

where we assume equivalent heights z2 for the free velocity and Z1 for the surface velocity. The current estimated values are 2 m for z1 (routine measurement height by human observers) and 50–75 m for z2. This implies a Z value of 5–10 m, which is consistent with Reference Li and PomeroyLi and Pomeroy’s (1997) values and the automatic wind measurement in snowy areas.
The Redistribution Model Sytron
Unlike LS98 or Reference GauerGauer (1998a,Reference Gauerb) we do not perform a full three-dimensional estimation of the different transport fluxes over a real orography. We aim to simulate the effects of an “imaginary” crest between two opposite aspects at all the computation elevations in steady-state conditions. We shall thus consider a one-dimensional channel forced by the normal simulated wind where we want to estimate the amount of snow removed from one slope and accumulated on the opposite one in treating only two fictitious points. The computations are done hourly over long periods, without any re-initialization, using the transport velocity Wt of the windward aspect; the evolution of the snow characteristics is determined by Crocus except for the aggregation of the blowing snow.
To simplify the parameterization, we directly used as variables the snow depth and its variations due to the wind transport, unlike the cited authors who, rightly, used a formulation in fluxes. In our case, this would have added some new variables incompatible with the present state of Crocus. As a consequence, the blown snow is easily aggregated to the new-fallen snow if a snowfall occurs during the transport, in a coherent manner. As the computations are done hourly, the different snowpacks change simultaneously and allow the deposited snow (blown or fallen) to be eroded again in the next hour.
The following parametenzations have principally been deduced from in situ measurements on the instrumented site for 10 years.
Occurrence of transport
As presented by GM98, the occurrence of transport is deduced in two steps:
-
1. A “snow-particle” mobility index (hereafter called Mi, and varying between –1 and 1) is computed from the crystal characteristics of the different considered layers. A crust or a wet layer stops the vertical analysis.
-
2. A snow-driftability index, Mt, is deduced for each layer by comparison of the previous index and the wind velocity Wt. This index attains a positive value if snow-drifting is possible.
Rate of transport: saltation and creep
During many winters, field experiments have shown that, at our site, the main part of the drifted snow was transported by saltation (observations made on poles equipped with several bags at different low vertical levels). Moreover, our experiments did not allow the creep and the saltation transport modes to be well separated. Many authors quoted by LS98 note the predominance of snow saltation over creeping This leads us to globally simulate the two effects through a unique empirical formulation inspired by the field measurements which are, as previously mentioned, representative of gentle slopes. We assume that a considerable fraction of the total amount of drifted snow is removed in this way. We call this ratio “r” and keep it at the crude constant value of 0.8, but this point needs further investigation.
As quoted by PG95, the saltation efficiency depends on the moved crystals. We shall also consider the shape of the blown crystal in guessing that an “old” snow grain is less driftable than a new one. The mobility index Mi is well suited for summarizing these effects and we simply set:

where e is the transport efficiency, varying between 1 and 0. Our field experiments corroborate the affirmations of PG95 relative to certain linearity of the saltation transport rate with the wind speed for speeds greater than a minimal threshold value. Unlike LS98, we shall thus keep this convenient relationship without higher-level assumptions and we shall write:

δsal (m) is the amount of blown snow at one precise location, and d is a convenient coefficient, with the dimension of time, integrating the different relevant length scales of the phenomena. It has been fixed experimentally at 0.075 s by examining local snow-depth differences between poles during saltation events. The “critical” threshold velocity, Wteri, is set to 4 m s–1. This value, fitted on the instrumented site, is larger than those proposed by PG95 for their threshold shear velocity, but is consistent with those published by Reference Li and PomeroyLi and Pomeroy (1997).
Rate of transport: suspension and sublimation
Our measurement site is not very well suited to the experimental study of turbulent diffusion. Hence, we chose a formulation suggested by PG95:

As quoted by PG95, we consider here, especially through the threshold velocity, that the source of the turbulent suspension is the saltation. δhsns represents the snow mass transported by turbulent suspension, which does not sublimate and will deposit afterwards. We assume that the sublimation occurs only in suspended snow and at higher wind speeds; this leads to the following expression:

Wt is limited to 20 m s–1. The functions F and G represent, respectively, the separated effects of the air temperature (T) and relative humidity (Hu) in order to crudely take into account the different energy exchanges between the snow particle and its environment. These functions have been expressed as:


which gives, for a fixed snow layer “i”, a maximum depth of eroded snow of:

Operational mode
The purpose of the parameterization is to transfer every hour a small amount of snow, comprising different surface or near-surface layers, from one exposure to the opposite one at a given elevation. This snow mass is accounted for in the Crocus profiles and stems from a previous snowfall or wind-transport event. The phenomenon occurs only if the normal component of the transport velocity Wt, according to the windward exposure, is strong enough compared to the considered snow surface conditions and the threshold velocity. The blown snow is then aggregated (in terms of crystal characteristics and density) on the opposite aspect with the surface layer. A horizontal diffusion is also applied and can limit the total amount of transported snow by assuming transport from and to the bounds of the experimental area. As we want to make the most of having a full stratigraphy, provided by Crocus, the computation is done for every layer, with a specific transport efficiency based on the mobility index Mi of the layer. Different layers on the windward slope can thus be eroded within the same hourly time-step. We assume a small densification of transported snow when it is deposited. Each eroded layer, with an initial density ρier, will undergo density changes by compaction during the transport and have an equivalent deposited density of ρiac, , computed in the following way:

The maximum density ρmax was set to 0.350 kg m–3 and Mt is the snow-driftability index. The hourly total eroded depth ΔHer is then computed as the sum of n successive layers of respective depth δhi, from the top of the profile. The deepest layer n can be only partially eroded if its own depth δhn is greater than the corresponding δhnma x:

The evaluation of the lowest hourly eroded layer n, for a given profile, is an important problem. Its determination is based on the following two criteria and is obtained when at least one of them is verified. Equation (12b) corresponds to the “partially eroded layer” case, while Equation (12c) is particularly suited for profiles which exhibit numerous thin layers:


Only the non-sublimated part will be deposited afterwards:

At every hourly time-step, we aggregate all the eroded and non-sublimated snow quantities in one unique leeward deposited layer with averaged characteristics. This constraint is mainly due to the Crocus modifications. Moreover, due to the compaction, the total deposited depth is slightly different from ΔHac. All these averaging operators are based on an approximation of a mean eroded density
 and of a mean accumulated density
 that can be expressed as follows:


The effective deposited snow depth on the lee aspect will be:

which will be aggregated in terms of depth, density and crystal shapes, with the already present surface structure of the lee slope.
Fluxes from and to outside
A complementary horizontal diffusion is also applied for reducing both the raw eroded and the accumulated snow mass in order to simulate the unknown effect of the surrounding. In fact, it is not unusual to observe a decrease of the snow depth on the lee side, especially in the case of strong wind on small slopes, as well as small snow-depth variations on the windward side when the drifting snow is immediately replaced by new snow (see, e.g., Reference Fierz and GauerFierz and Gauer, 1998). This kind of transport is not treated by the previous formulation, which considers only two fictitious locations on two opposite aspects, but these “combined”transport effects must be taken into account if we want to avoid locally a too intense transport of snow mass.
To achieve a crude estimation of the snow mass accumulated on the windward side, we use the previous formulation with the same crystal stratigraphy, but with a velocity limited to βWt. This very simplified approach does not take into account a large number of effects, especially the three-dimensional ones; it aims only at representing the effects of a horizontal variation of the transport velocity along one slope of the one-dimensional channel. The best results, compared to the field data, are obtained for β ≈ 0.9. The corresponding results are presented in the following paragraphs. This new β coefficient is the only one used in these different estimations, in order not to “over-parameterize” the complex process of transport in this first attempt. The result is thus a partial replacement of the initial snow in the eroded profile by drifted snow. The same procedure is performed on the lee side and aims at removing a part of the snow that could have been deposited there. On this side we use the same (5 coefficient, but applied to the velocity analyzed by SAFRAN on this aspect.
These formulations have an implicit self-limitation: the transported snow is less subject to a new drifting effect during the following hours because it underwent some crystal changes which decrease the corresponding snow-driftability index and thus the transport ability.
Precipitation
The SAFRAN hourly precipitation rate is fully applied on the windward aspect, and the new snow (dendricity = 1, sphericity = 0.5) is aggregated with the snow surface layer. On the lee exposition, this rate is reduced in proportion to the wind velocity in order to take into account both the wind-deflection effect and the slope influence.
Morphological transformations of the drifted particles
The algorithm used is based on observation of the drifted crystals, done at the instrumented site for many years. It tends to make a new drifted crystal which is closer to small rounded grains than the previous shape; but such transformations are not obtained in one time-step and can take many hours.
The snow-crystal characteristics are described by using the parameters of Crocus (Reference Brun, David, Sudul and BrunotBrun and others, 1992). A recent snow crystal is thus defined in terms of dendricity (1–0) and sphericity (0–1). When drifted, its dendricity decreases and its sphericity increases according to the wind velocity. When the crystal has undergone some metamorphism, it is mainly described in terms of sphericity and size (>0.3mm). Such drifted crystal will thus decrease in size and increase in sphericity, always in function of the wind velocity.
Aggregations
The density of the new surface layer of the lee slope is simply obtained by linear combination of its own previous density and
weighted with their respective depths.
Another merging is done on the crystal characteristics. It is performed twice: firstly for computing only one drifted averaged crystal based on the different eroded layers, and secondly for merging this “drifted” crystal with the surface lee layer. The numerical aggregation of two types of fresh snow or of transformed snow is obvious and is based only on linear transformations. For the mixing of new and transformed “snows”, an equivalent size for the new snow is computed. A linear combination is then performed; if the compound size is > 0.3 mm the resulting snow will be assumed transformed, otherwise it will stay new. In either case the same rules are thus applied as for homogeneous snow types.
Limitations of the model
The limitations of this model are numerous, but, as previously stated, it must be evaluated in terms only of parameterization inside a larger-scale numerical modelling. We can principally criticize the fact that we are in a one-dimensional channel with only two computation points, which prevents a real estimation of the horizontal divergence of the implied fluxes and so implies a sometimes wrong estimation of fluxes crossing our numerical boundaries. The main reason for this is that we do not have valid wind-field estimation both in time, with the implicit smoothing due to SAFRAN, and in space where we do not have a full field. These velocity-estimation discrepancies can cause severe gaps in the transported snow quantities because, as quoted by Reference GauerGauer (1998a) and also visible in our expression of δhsus, the drifted-snow amount depends on a power greater than 1 of the wind speed. These facts are illustrated in the following section.
First Results and Comments
The model has run on an “idealized” location of the instrumented site in the Grandes Rousses massif, at 2700 m a.s.l on 20° slopes with northern and southern aspects, since winter 1998/99. Observations at the site are used only for validation, not for re-initializing the simulation. The experiment is continuing in the year 2000. The present monitoring is done mainly on the snow depths measured on the two exposures of the site (north and south). The set of verification poles set up in 1998 was augmented in 1999/2000, but the small-scale heterogeneity of the site sometimes makes comparisons difficult.
Full winter season 1998/99
Figure 2 shows different simulations of snow depth on the two main aspects of the site. The bold lines represent the SYTRON simulation (green = southern aspect, and red = northern aspect) and are labelled “Drift”. The corresponding coloured thin lines represent the current operational SCM runs without any wind redistribution, and are labelled “No-Drift”. The plotted squares are pole snow-depth measurements at two locations (north and south) of the instrumented site. These locations were chosen for their representativeness at the scale of the model, according to the homogeneous characteristics (size, slope, precise exposure) of the surrounding topography.
Different simulations of snow depths (SD) representative of the Lac Blanc site (2700 m a.s.l; Grandes Rousses massif, northern and southern aspects) compared to some pole observations during winter 1998/99 (see dates on bottom). The bold lines correspond to the SYTRON run (labelled “Drift”), while the thin lines represent the operational SCM suite where the wind-transport effects are not taken into account (labelled “NoDrift”). The red colour corresponds to the northern aspect, and green to the south. The plotted squares represent observed measurements on poles with the same colour code.

We can see that an intensive wind transport is simulated on 7 December 1998, with a northerly wind of 6–9 m s–1. During this period, the southern snow depth became deeper than on the northern aspect, contrary to the prediction of the operational suite. The pole measurements are difficult to interpret during this period, due to many small-scale phenomena, but still reveal some discrepancies in the southern aspect where the snow depth remains too deep after the drifting event.
Fortunately, the rest of the season is better represented, and the “drifted” snow depths are not too far from the observations which exhibit well the accumulation effects on the southern slope, especially during February. We also note the numerical stability of the “Drift” simulations, which can run for several months without observation of the site and without any re-initialization.
Beginning of winter 1999/2000
Figure 3a and b illustrate the beginning of the current season with the same colour code as previously. Figure 3a displays the same elements as Figure 2, with a supplementary plot of two new averaged snow-depth measurements, denoted by “Pole 2” (coloured circles). These new values represent about 20 manual measurements around a precise location. They have been added this season in order to better visualize the spatial heterogeneity of the site. Figure 3b mainly shows the difference between the “Drift” and “NoDrift” snow depths on two aspects.
Beginning of winter 1999/2000 on the same site, (a) Same elements as Figure 2 for this new season, but with the addition of a new set of poles which are plotted as circles. The meaning of the colours and lines remains the same. PB1, PB2 and PB3 refer to discrepancies commented on in the text, (b) Snow-depth differences between the two simulations (“Driff and” “No Drift”) on two aspects; the observed wind on the site (m s–1) is represented by black bars, and the velocity from the SAFE AM analyses by thin blue lines; both are referenced on the right vertical axis. Vertical dashed lines indicate the previous problem dates.

In Figure 3a, we can readily see the same effects as during the previous year, namely, accumulation on the southern slope and erosion on the northern slope, which are typical of these climatic conditions. Considering the global mass balance in the “Drift” simulation, we notice, especially in Figure 3b, an important loss of snow mass on the northern slope, but less accumulation on the southern aspect, which gives a negative global mass balance compared to the “NoDrift” experiment. This effect is partially due to the extremely strong winds observed in France at the end of 1999. For this reason, we have also plotted the observed wind at the site in Figure 3b (black bars) and the SAFRAN transport velocity (thin blue lines) previously denoted by Wt.
Many gaps are still visible. The main points are labelled “Pbx” in Figure 3a and plotted as a vertical dashed line in Figure 3b; they are discussed below in inverse chronological order. They cover different kinds of errors, such as a wrong wind-velocity evaluation, a lack of drifting on the lee aspect or an erroneous parameterization of the outside fluxes.
PB3 occurred on 20 December 1999 during the first tempest event. Erosion was correctly simulated on the northern aspect, as observed on the poles, but the accumulated snow remained on the opposite aspect. The main reason for this is an underestimation of the northerly transport wind by SAFRAN, which calculated 8 m s–1 when 13 ms–1 was observed. From the pole values, we see that the lee aspect (south) was also completely drifted and has less snow depth than the northern aspect, which is not simulated at all. The second tempest event, on 25 December, with 13 ms–1 observed but 15 m s–1 simulated, was better estimated in terms of transport, precipitation rates and resulting snow depths.
The PB2 problem, again on the southern aspect, is clearly seen in the pole observations of 17 December, which exhibit much less snow depth than the numerical simulation. The identified cause is the event of 6 December 1999 where we missed the southern erosion and thus overestimated the snow depth on this aspect. At that date, the simulated surface layers on both sides were mainly composed of mixed transformed particles (rounded and faceted) with a density of about 185 kg m–3. Although somewhat underestimated (7–9 ms–1 instead of 6–13 ms–1 observed), the simulated velocity was strong enough to drive the erosion of such crystals on the northern aspects, but the induced changes in the shapes and densities of the transported grains made it impossible for deposited snow to drift again from the southern aspects. We thus kept an erroneous and too high snow depth on this aspect.
PB1 is, in some aspects, similar to PB2 and occurred on 23 November but was observed on 25 November. On the first date, the two experiments (”Driff” and “NoDrift”) were very close and the surface layers were mainly composed of recent light snow (fallen on 19 November) with a density of about 95 kg m–3. The main error comes from the fact that the transport occurred during a period of small wind speeds, not too badly simulated by SAFRAN as shown in Figure 3b. In reality, nearly all the snow on the northern slope was driftable and was effectively removed. In the simulation, the relatively small velocity induced only a partial transport on this aspect due to our crude formulation directly linked to the wind speed for both the amount and the end criterion. The second level of the trap is also due to this medium wind speed whose value is used for the evaluation of the outside fluxes. The β coefficient (< 1) of this formulation implied no new drifting of the previously deposited snow on the southern aspect.
Future Projects
In addition to the routine SYTRON evaluation in its current form, a new version is planned. It will run on a more complete wind field, also forced by SAFRAN, but fully two-dimensional in the horizontal in order to avoid the two main identified problems: the need for a more complex wind evaluation taking more fully into account the topography features, and the effects due to the surroundings. This version will use the same local transport formulations as presented here, but expressed in terms of fluxes and mass conservation.
Conclusion
We have tried to insert the effects of the wind transport in an operational suite of numerical simulation of the snowpack where this phenomenon was not taken into account heretofore. The differences in the length scales due to the phenomena involved and the strong forcing of the topography make this approach difficult but challenging.
We first tried to make the best possible use of 10 years of experiments and archives on the instrumented Lac Blanc site. It was very useful to tune and validate different formulations and empirical laws governing these effects. It allowed also a first evaluation of a wind transport velocity
The results obtained indicate a large influence of these effects on the simulated snow depths. They will be completed soon by a MEPRA evaluation of the stability of these modified snow profiles and by avalanche-hazard estimations. The main weaknesses come from a sometimes erroneous determination of the wind transport and from an incomplete simulation of the wind-transport effects on the two aspects.
The current plan is to use this first version complementary to the “NoDrift” operational suite in order to give a wider range of avalanche-hazard indication on the two sides (windward and leeward) of an imaginary ridge at different elevations of a massif. But another research programme, based on the current transport formula and in a two-dimensional framework, has begun.
Acknowledgements
We are grateful to the management and people of the Safety Service of Alpe d’Huez who help us to maintain the observation site. We thank especially J.-M. Panel and P. Pugliese who are in charge of the instrumentation of the site, and Y. Lejeune and P. Etchevers who have modified Crocus. We are also indebted to the friends and colleagues who assisted with the writing of this paper and to the reviewers for their useful comments and helpful suggestions. Some parts of this work have been funded by the Rhône-Alpes Regional Administration (Contrat Etat-Region VENREC) and the Pole Grenoblois des Risques Naturels.



