
I. INTRODUCTION
Since the end of the 1990s, it has been well known that fatigue failure can occur even at stress amplitudes well below the classical fatigue limit observed in the high cycle fatigue (HCF) regime of 106 ≤ N f ≤ 107. Reference StanzI-Tschegg, Mayer, Beste and Kroll1–Reference Miller and O’Donnell5 At that time, new experimental techniques are developed that allowed fatigue testing at higher frequencies of up to 1000 Hz (servo-hydraulic machine Reference Morgan, Milligan, Soboyejo and Srivatsan6 ) or 20 kHz (ultrasonic fatigue testing, see e.g., Ref. Reference Stanzl-Tschegg, Buschow, Cahn, Flemings, Ilschner, Kramer, Mahajan and Veyssiere7). Using these new techniques, it is possible to test materials up to a number of cycles well above 107. The results of these investigations show that even at low stress amplitudes, fatigue failure can occur due to both surface as well as internal crack initiation, Reference StanzI-Tschegg, Mayer, Beste and Kroll1–Reference Miller and O’Donnell5,Reference Murakami, Nomoto and Ueda8,Reference Wang, Berard, Dubarre, Baudry, Rathery and Bathias9 resulting in a multistage shape stress amplitude versus number of cycles to the failure curve (S–N curve). In some cases, a second fatigue limit is observed in the very high cycle fatigue (VHCF) regime (N f ≥ 107). In addition, these investigations reported that crack initiation typically occurs at the surface in both low cycle fatigue (LCF) and HCF regimes, and that internal crack initiation occurs in the bulk material in the VHCF regime. However, internal crack initiation accompanied by fisheye formation is also observed in the HCF regime for case-hardened steels, where surface crack initiation is avoided due to residual compressive stresses below the surface. Reference Murakami, Nomoto and Ueda8
According to Mughrabi, Reference Mughrabi10 metallic materials can be divided into two main classes with respect to their fatigue behavior in the VHCF regime: (i) type I materials, which are pure ductile (annealed) materials and (ii) type II materials, which are steels or materials containing discontinuities such as nonmetallic inclusions (NMIs), dispersoids, particles, or pores. Both type I and type II materials exhibit multistage S–N curves. Reference Mughrabi10 However, crack initiation always starts at the surface for type I materials, whereas for type II materials, crack initiation shifts to the interior of the material. Nevertheless, some conditions must be fulfilled for internal crack initiation: (i) The presence of internal defects and (ii) that the density of internal defects in the bulk material should guarantee that these defects are not located right at the surface. Reference Mughrabi10 Crack initiation at internal defects leads typically to the formation of so-called ‘fisheyes’ on the fracture surface, Reference Naito, Ueda and Kikuchi11 which are macroscopically visible as a smooth structure distinguishable from the residual fatigue area. Internal cracks are characterized by an enhanced crack initiation period, which accounts for 95% of the fatigue life Reference Wagner, Ranc, Bathias and Paris12 and propagation mechanisms with low propagation rates. Reference Tanaka and Akiniwa13 Another feature of the fracture surface that develops above 107 cycles to failure is a so-called fine granular area (FGA), Reference Sakai, Sato, Nagano, Takeda and Oguma14 which forms directly around the crack-initiating nonmetallic inclusion with a rough granular or zig-zag morphology. Reference Murakami and Yamashita15
In the last decade, increased interest has developed in the (VHCF) behavior of construction materials for long-term applications. This is due, in particular, to the fact that NMIs found in structural or safety components that undergo cyclic loading conditions can lead to severe accidents—as reported by, e.g., Klinger and Bettge Reference Klinger and Bettge16 and Klinger et al. Reference Zerbst, Beretta, Köhler, Lawton, Vormwald, Beier, Klinger, Černý, Rudlin, Heckel and Klingbeil17
For the steel-making industry, NMIs are of great interest. Along with their beneficial effects in terms of “oxide metallurgy”, however, they have a detrimental and harmful effect on mechanical properties—and especially under cyclic loading. Reference Song, Song, Xin, Sun, Song and Hu18,Reference Zhang19 Different variants of NMIs can be distinguished both with respect to their genesis as well as their sizes. Of particular interest are endogenous inclusions (with dimensions of a few micrometers) introduced due to deoxidation or reoxidation processes. Reference Zhang and Thomas20 Thus, there is considerable interest in removing NMIs and, therefore, in improving the cleanliness of steel melts. Different methods are used by the steel-making industry to remove NMIs applied to molten metals, such as Argon treatment, Reference Zhang21 deoxidation, Reference Tripathi, Nzotta, Sandberg and Sichen22,Reference Zhang, Taniguchi and Cai23 or electro-slag remelting. Reference Shi, Yu, Wang, Li and Jiang24 Another method is that of metal melt filtration using ceramic cell foam filters, which are already used for up to 15% of industrial steel casting. Reference Uemura, Takahashi, Koyama and Nitta25 To improve filtration efficiencies with regard to smaller endogenous inclusions, new multifunctional filters and filter systems have been developed and consist primarily of two types: (i) active filters based on carbon-bonded alumina (Al2O3–C) and (ii) reactive filters based on carbon-bonded magnesia (MgO–C). Reference Emmel and Aneziris26,Reference Emmel, Aneziris, Schmidt, Krewerth and Biermann27 Fatigue testing is suitable for examining the impact of different filter systems on the cleanliness of cast steel specimens, since VHCF (N f > 107) can be used to detect the largest, nonfiltered NMI in the bulk of the tested material. Reference Zhang and Thomas20,Reference Furuya, Matsuoka and Abe28 Thus, previous investigations by the authors group Reference Krewerth, Lippmann, Weidner and Biermann29 on quenched and tempered 42CrMo4 cast steel clearly reveal the influence of NMIs on fatigue behavior. The results show that clusters of individual endogenous NMIs with small dimensions (below 5 µm) act as internal crack initiation sites. Nevertheless, the majority of specimens fail due to surface crack initiation, since a high number of smaller inclusions are located at the surface or are in close proximity to it. To study crack initiation due to NMIs in more detail and to investigate further the formation of both fisheyes and FGAs, crack initiation at inclusions located at or in close proximity to the surface should be avoided.
The protection of the specimen surface against crack initiation can be achieved by different methods of surface engineering. The main goal of these treatments is to introduce residual compressive stresses below the specimen surface, which can be realized by mechanical surface treatments such as shot peening (e.g., Ref. Reference Torres and Voorwald30) or deep rolling (e.g., Ref. Reference Prabhu, Kulkarni and Sharma31). Apart from mechanical treatment, thermochemical processes such as nitriding or carbo-nitriding can be used, which result in increased surface hardness and residual compressive stresses due to lattice distortion by nitrogen and the formation of nitrides. These treatments are typically used for the improvement of fatigue properties. Reference Murakami, Nomoto and Ueda8,Reference Genel, Demirkol and Çapa32–Reference Spies, Dalke and Hashimi36 Both increased surface hardness and residual compressive stresses impede surface crack initiation, reduce fatigue crack growth rates, and, thus, increase the total fatigue life. Reference Murakami, Nomoto and Ueda8,Reference Spies, Dalke and Hashimi36,Reference Kovacı, Yetim, Baran and Çelik37 Primary subsurface crack initiation below the case depth is reported in the literature Reference Murakami, Nomoto and Ueda8,Reference Genel, Demirkol and Çapa32–Reference Spies, Dalke and Hashimi36 and even with LCF regimes. Reference Bäumel, Seeger, Beck, Denis and Simon38 Figure 1S depicts a schematic image of a fracture surface with well-separated regions of crack initiation and crack propagation (according to Ref. Reference Spies, Dalke and Hashimi36). Stage 3 depicted in Fig. 1S is characterized by a change from locally stable crack growth into faster crack growth due to the influence of compressive stresses and is accompanied by the formation of a circumferential edge crack. Depending on the thickness of the nitride layer and the magnitude of the compressive stresses, this edge crack can vary in depth and appearance. The interruption of the more rapid crack propagation at the interface to the core material is characterized by a stretch zone due to crack blunting.
The present paper focuses on the investigation of crack initiation on NMIs in the VHCF regime of the cast steel 42CrMo4. The surfaces of fatigue specimens were protected against crack initiation by plasma nitriding. Two plasma-nitriding treatments with different nitriding times were performed, which led to different core hardness, surface hardness, and nitriding depth values. The fatigue behavior was studied by ultrasonic fatigue testing complemented by in situ measurements of the resonant frequency f res and the nonlinearity parameter βrel. Reference Kumar, Torbet, Wayne Jones and Pollock39,Reference Kumar, Torbet, Pollock and Jones40 Fracture surfaces were analyzed using scanning electron microscopy (SEM) in combination with energy-dispersive X-ray spectroscopy (EDS) to study the influence of the plasma-nitriding treatments on the fatigue crack initiation and the typical parameters describing the internal crack initiation and propagation.
II. EXPERIMENTAL DETAILS
The investigations were performed on 42CrMo4 high-strength steel specimens obtained by industrial sand casting using different types of ceramic cell foam filters. The casting system and the filters used are described in detail in Refs. Reference Krewerth, Lippmann, Weidner and Biermann29 and Reference Krewerth, Lippmann, Weidner and Biermann41. The chemical composition is given in Table IS. The casting plates were hot isostatically pressed to reduce casting porosity. Fatigue specimens were sampled in the casting direction and were turned on lathe. Details of the specimen geometry are given in Ref. Reference Krewerth, Lippmann, Weidner and Biermann41. Afterward, a quenching and tempering treatment was performed (for details, see Refs. Reference Krewerth, Lippmann, Weidner and Biermann29 and Reference Krewerth, Lippmann, Weidner and Biermann41). The gauge lengths of the specimens were ground and polished manually up to 3 µm.
A plasma-nitriding treatment (PNT) was performed under different conditions on the fatigue specimens. In general, the nitride layers consisted of an outer compound layer formed by iron nitrides and iron carbonitrides and a diffusion or precipitation layer hardened by nitride precipitates. Reference Spies, Dalke and Hashimi36 While the compound layer was characterized by high hardness and a brittle behavior, the precipitates formed in the diffusion layer caused (concurrently) an increase in hardness and the formation of residual compressive stresses. To avoid formation of this compound layer, the PNT was carried out as a two-step process. The parameters of temperature, time, and gas composition are summarized in Table IIS. The variation of the nitriding time resulted in different nitriding hardness depth (NHD) profiles and residual stresses. The NHD was determined by means of Vickers micro-hardness HV0.1 measurements. The core hardness was determined by HV10.
Residual stresses were measured by X-ray diffraction (XRD) using the sin2Ψ method. The XRD measurements were performed using Cr-Kα radiation (λ = 0.23 nm) and the (211) reflection. The residual stresses were measured at different depths below the surface (electro-polishing; total depth of 0.7 mm). It should be noted that the residual stress measurements were performed on fatigued specimens. Thus, the values of residual stresses obtained reflected the magnitude of the remaining residual stresses after fatigue testing, since it was assumed that the residual stress profiles and quantities had changed during cyclic loading.
Fatigue tests were performed using an ultrasonic fatigue testing machine (University of Natural Resources and Life Sciences, Vienna, Austria) enabling testing frequencies of about 20 kHz (e.g., Ref. Reference Stanzl-Tschegg42 and Mayer Reference Mayer43 ). The tests were carried out under symmetrical push–pull loading conditions (R = −1) at room temperature. They were carried out in a pulse/pause mode with 600 ms pulse und 900 ms pause to avoid heating due to damping. In addition, the gauge length of the specimens was cooled by a spot cooling system. Reference Krewerth, Lippmann, Weidner and Biermann29 In this set-up, the temperature increase during cyclic loading due to damping was kept constant at ≤10 K, which was proved by thermographic measurements. Temperature increase was detected at the moment crack initiation began. The run-out limit of the fatigue tests was set at 109 cycles. In general, a decrease in the resonant frequency of around 75 Hz was used as the indicator for the final failure of specimens. The resonant frequency f res and the nonlinearity parameter βrel were recorded in situ during the fatigue tests. The nonlinearity parameter was calculated according to Kumar et al. Reference Kumar, Torbet, Wayne Jones and Pollock39,Reference Kumar, Torbet, Pollock and Jones40 :
 $${\beta _{{\rm{rel}}}} = \left( {{A_2} - 2{A_1}} \right) - {\left( {{A_2} - 2{A_1}} \right)_0}\quad ,$$
where A 1 and A 2 are the amplitudes of the first (20 kHz) and second (40 kHz) order harmonic waves of the ultrasonic pulse, respectively. The difference between both amplitudes is highly sensitive to microstructural processes during cyclic loading (i.e., dislocation patterning, cyclic hardening or softening) as well as to damage processes (crack initiation). Reference Mayer43,Reference Cantrell and Yost44 Therefore, the comparison of the differences between both amplitudes for current pulses with the initial (undamaged) material state indicates the damage state of the material. As long as crack initiation does not occur, the nonlinearity parameter should stay more or less constant at zero. A deviation from this provides an indication of microstructural changes in the material occurring during cyclic loading.
Fractographic analysis of each specimen was performed using SEM in combination with EDS to determine the damage-relevant defects and their correlation with the crack-initiating number of cycles. To this end, a field emission SEM (Tescan, Brno, Czech Republic) was used that was equipped with an EDS system of energy dispersive analysis X-ray (EDAX; Ametek, Mahwah, New Jersey). Typical parameters were determined to describe the individual fracture surface features, such as (i) the depth of a nonmetallic inclusion below the surface s inc, (ii) the radius of a fisheye r FE, (iii) the size of the NMIs areainc, and (iv) the size of the FGA areaFGA (see Fig. 2S).
III. RESULTS
A. Nitride layer
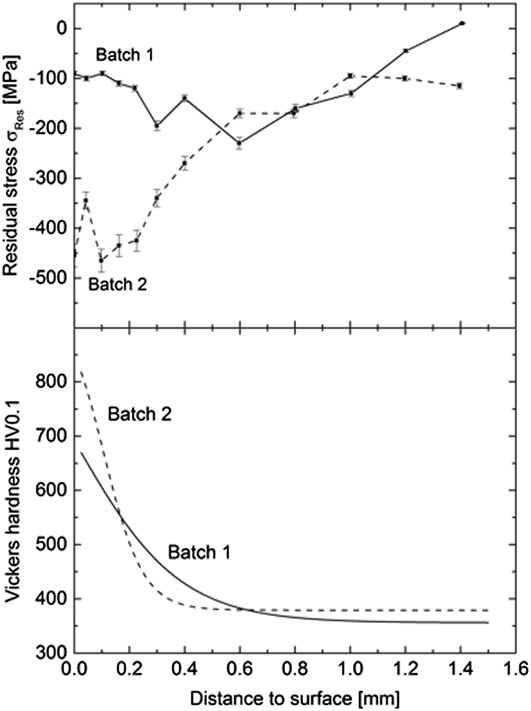
Two different PNTs were applied to quenched and tempered 42CrMo4 steel specimens. The NHD profiles measured for both batches are shown in Fig. 1. The curve of batch 2 started above 750 HV0.1 close to the surface, followed by a strong decrease to 380 HV0.1 for the core material. However, batch 1 exhibited about 675 HV0.1 close to the surface but a much smoother decrease to the core hardness of 350 HV0.1. The differences were due to the different nitriding times. Since the nitriding temperature was only 10 K higher than the tempering temperature, nitriding decreased the core hardness. This loss was a time-dependent process and, consequently, more pronounced for batch 1, which had a higher nitriding time. Furthermore, the longer nitriding time led to a decrease in surface hardness and to an increase in NHD. Consequently, batch 1 (with 0.47 mm) exhibited a significantly higher NHD than batch 2, with 0.225 mm (see Table IIIS).
Residual stress–depth curves in combination with hardness–depth curves for batch 1 and batch 2.

In addition, the residual stresses were measured for both batches, as shown in Fig. 1. As with the NHD, the stress profiles exhibited clear differences between the batches. Whereas batch 2 exhibited the highest compressive stresses close to the surface (−450 MPa), the compressive stresses present in batch 1 were much lower (−100 MPa). Furthermore, the profiles of the residual stresses below the surface were different. The compressive stresses for batch 1 reached a maximum at a depth of approximately 350 µm below the surface and decreased to zero at a depth of 0.7 mm. The compressive stresses for batch 2 reached their maximum at about 50 µm, with a value of −100 MPa at a depth of 0.7 mm. Consequently, the range of compressive stresses in batch 1 was much higher than in batch 2, although the maximum residual stresses were much higher for batch 2 than for batch 1.
B. Fatigue lives
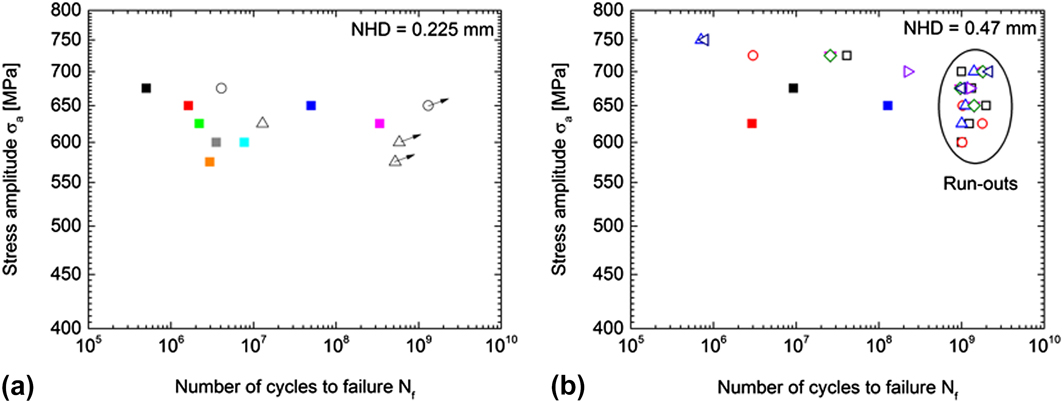
Figure 2 shows the results of the fatigue tests for both batches. The filled symbols correspond to specimens that failed on the first stress amplitude applied. The open symbols represent run-out specimens that failed only after increasing the stress amplitude several times. Clear differences were observed as a function of the NHD. Thus, for batch 2, eight specimens out of ten failed on the first stress amplitude applied. In contrast, the majority of the specimens in batch 1 (seven out of ten) failed only after increasing the stress amplitude several times. Thus, the stress level for the final failure of the specimens in batch 1 lay in a range between 650 and 750 MPa. In contrast, the failure stress level of the specimens in batch 2 was significantly lower, at 575–675 MPa. However, all of the specimens failed at internal discontinuities at N f > 5 × 10⁵ cycles, regardless of the stress amplitude and the values of NHD. Crack initiation from the specimen surface could not be observed in any of the cases. Thus, the protection of the specimen surface and the shifting of crack initiation toward the bulk material was successful.
Stress amplitude versus number of cycles to failure curves for (a) batch 2 (NHD = 0.225 mm) and (b) batch 1 (NHD = 0.47 mm). Open symbols represent run-out specimens, which were raised in stress amplitude several times until failure. Filled colored symbols corresponds to specimens failed on the primary applied stress amplitude.

However, for those specimens that failed after increasing the stress amplitude, the beneficial influence of the nitriding layer meant that it was not clear whether crack initiation had truly occurred at the highest stress level applied. It was notable that those specimens that failed at higher stress amplitudes often did so at a number of cycles of between 1 × 10⁶ and 5 × 10⁷. In addition, those specimens that failed at lower stress amplitudes often failed at lower stress levels due to crack initiation at NMIs that lay within the core material of the specimens, where crack propagation was definitely not influenced by the compressive stresses of the nitriding layer (see Sec. III.C). It should also be noted that no specimen failed by rupture. As defined above, a decrease in resonant frequency was regarded as signifying a specimen’s end-of-life.
Ultrasonic fatigue testing provided a possibility to evaluate the number of cycles to crack initiation, instead of merely the number of cycles to failure. Two parameters were registered in situ during the fatigue testing that were sensitive to the damage processes during cyclic loading: the resonant frequency f res and the nonlinearity parameter βrel. However, the resonant frequency—which was approx. 20 kHz and the control variable of the fatigue test—was significantly affected by temperature. Thus, an increase in temperature due to damping yielded a decrease in f res that required additional cooling of the gauge along its length. In contrast, the nonlinearity parameter was quite insensitive to temperature changes during fatigue testing, since it was based on the difference in amplitudes of high-order harmonics. Microstructural processes that occurred during fatigue processes (cyclic softening, cyclic hardening, crack initiation, etc.) resulted in changes of the amplitude of the second-harmonic wave A 2 at approx. 40 kHz. Both parameters—f res and βrel—were, therefore, evaluated in detail for all specimens and, consequently, both the stress amplitude σai as well as the number of cycles N i for crack initiation were determined.
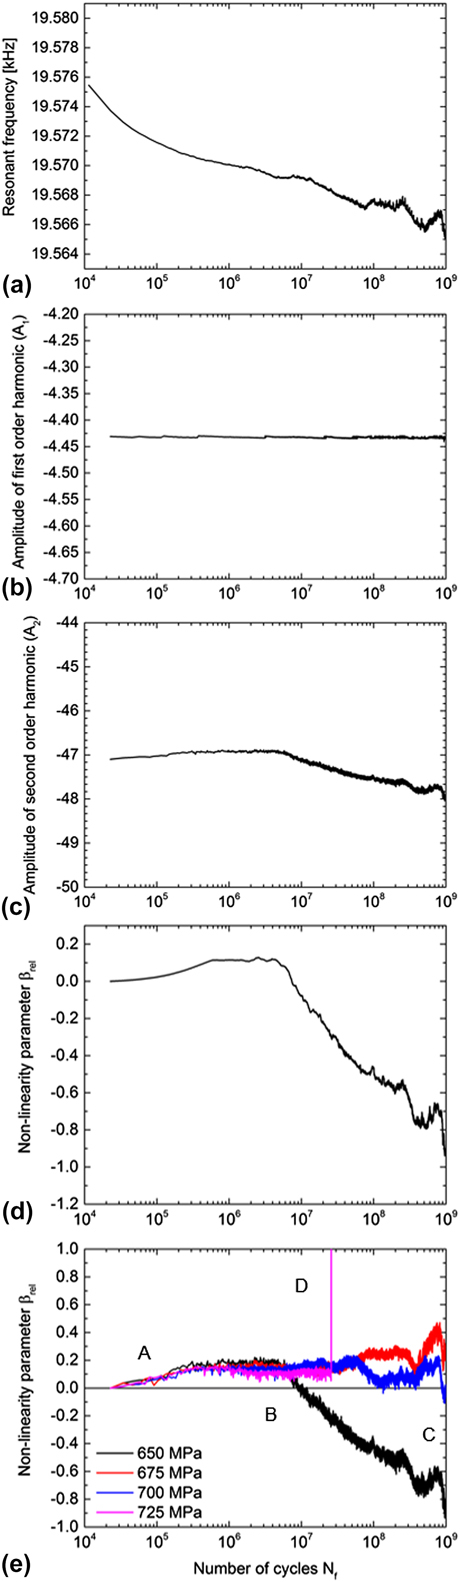
Figure 3 shows exemplarily the evolution of the resonant frequency f res [Fig. 3(a)], the amplitudes A 1 and A 2 of the first (20 kHz) and second (40 kHz) order harmonics [Figs. 3(b) and 3(c)], and the nonlinearity parameter βrel [Fig. 3(d)] calculated according to Eq. (1) for a representative specimen of batch 1, which failed at σa = 725 MPa and N f = 2.5872 × 10⁷ after increasing the stress amplitude three times from 650 MPa in steps of 25 MPa. The parameters shown in Figs. 3(a)–3(d) correspond to the first stress amplitude applied, with σa = 650 MPa. The resonant frequency f res exhibits a typical decrease at the start of the fatigue test. At about N = 1 × 10⁶ cycles, f res tends to saturate. This behavior is typical for all ultrasonic fatigue tests and is mainly caused by slight temperature increases due to the damping behavior during high frequency testing—and is, therefore, analogous with the literature. However, for a higher number of cycles (N > 106), the decrease in the resonant frequency became more pronounced, and certain discontinuities were observed. The amplitude of the first-order harmonic (20 kHz) was nearly constant over the entire fatigue test. The amplitude of the second-order harmonic (40 kHz) exhibited a significant change at about N = 6 × 10⁶ cycles. Since A 1 remained constant and A 2 showed a significant decrease at N = 6 × 10⁶ cycles, the calculated nonlinearity parameter βrel exhibited similar behavior. Thus, during the first 105 cycles, βrel exhibited a slight increase, saturated up to N = 6 × 10⁶ and then decreased significantly until 109 cycles, which was defined as a run-out. However, several discontinuities were observed between 108 and 109 cycles. After reaching the run-out limit, the specimen was loaded again at 675 MPa and then at 700 MPa. In both cases, the specimen again reached the run-out limit. The evolution of the nonlinearity parameters of the increased stress amplitudes is summarized in Fig. 3(e). At higher stress amplitudes, deviation from the saturated βrel occurred at a higher number of cycles (N > 107). At σa = 725 MPa, a sudden, dramatic increase in βrel was observed at failure (N f = 2.5872 × 10⁷). However, since the first deviation from the nonlinearity parameter was detected at σai = 650 MPa and N i = 6 × 10⁶ cycles, this was most likely the number of cycles for crack initiation. Furthermore, it was assumed that the final fracture was delayed up to a stress level of σa = 725 MPa due to the compressive stresses within the nitride layer, which impeded the crack growth toward the specimen surface to cause the final fracture. The crack-initiating defect was located in the zone influenced by the nitrided layer as demonstrated by the overview on the fracture surface depicted in Fig. 3(e) (see Sec. III.C, see Fig. 6).
In situ parameter of the ultrasonic fatigue testing for identification of the number of cycles for crack initiation on a specimen failed after raising stress amplitude several times. Resonant frequency f res (a), amplitude A 1 (b) of the first-order (20 kHz) harmonic wave, A 2 (c) of the second harmonic wave, and (d) the calculated nonlinearity parameter βrel at σai = 650 MPa. (e) Nonlinearity parameter βrel for all applied stress levels. Letters A to D are explained in the text.

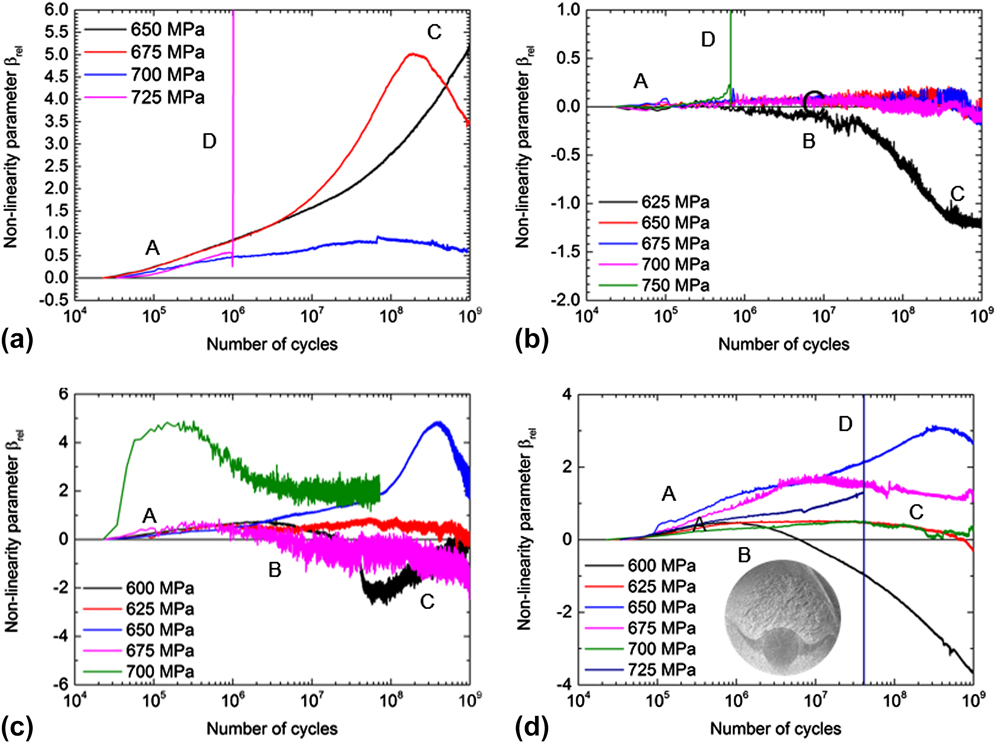
Figure 4 summarizes the nonlinearity parameter for four further specimens, which failed after increasing the stress amplitude several times. In addition, the fracture surface of one of these specimens is depicted [see Fig. 4(d)]. The other three specimens failed in such a way that breaking the specimen after cooling in nitrogen did not reveal the crack initiation point, although the resonant frequency could not be reached anymore by ultrasonic excitation. Instead, the specimens failed at other locations. Figure 4 shows that the damage occurred already at the first stress amplitude applied, since a clear deviation of the nonlinearity parameter was evident from zero or from the saturation behavior up to 106 cycles. Likewise, discontinuities were observed in the nonlinear parameter at higher stress amplitudes and with various characteristics. In particular, the nonlinearity parameter at σa = 700 MPa of the specimen shown in Fig. 4(c) shows clearly that at this stress level, the specimen already exhibited a remarkable state of damage. Here, βrel exhibits a pronounced increase directly after the first 105 cycles.
Evolution of the nonlinearity parameter βrel for four individual specimens with NHD = 0.47 mm failed after raising stress amplitude several times. Letters A to D are explained in the text. (a) σaf = 725, N f = 1.003 × 10⁶, σai = 650 MPa, N i = 1 × 10⁷. (b) σaf = 750 MPa, N f = 6.55 × 10⁵, σai = 625 MPa, N i = 3.1167 × 10⁷. (c) σaf = 700 MPa, N f = 2.826 × 10⁶, σai = 600 MPa, N i = 2.7618 × 10⁷. (d) σaf = 725 MPa, N f = 9.86741 × 10⁸, σai = 600 MPa, N i = 1 × 10⁶.

However, the literature does not clarify which microstructural processes result in a positive or negative deviation of the nonlinearity parameter from zero, as summarized by Mayer et al. Reference Mayer, Fitzka and Schuller45 Therefore, interpretation of damage-relevant processes in the literature has not been as conclusive as to facilitate the straightforward interpretation of the present results. Nevertheless, some tendencies can still be discerned. First of all, in nearly all of the fatigue experiments of the two nitrided batches, a slight increase in the nonlinearity parameter occurred, starting from the beginning of the fatigue tests. Since the material was quenched and tempered followed by nitriding, it is very likely that cyclic softening occurred during the first 104 to 105 cycles, which resulted in a positive nonlinearity parameter [see A in Figs. 3(e) and 4]. It is most likely that the cyclic softening could be attributed to the depletion of the residual compressive and tensile stresses in both the nitride layer and the core material. To prove these assumptions, measurements of the residual stresses should be performed in future—both in the as-nitrided state and after fatigue testing. In some cases, an inflection point in the evolution of the βrel parameter was observed after saturation of the nonlinearity parameter, followed by a pronounced decrease in this parameter to a value below zero [see B in Figs. 3(e) and 4]. The magnitude of this decrease can vary. In addition, discontinuities such as short-term increases also occurred [see C in Figs. 3(e) and 4]. It is most likely that the decrease was caused by cyclic hardening, which would correlate with the findings of Li et al. Reference Li, Cui, Wen, Su and Engler-Pinto46 These authors discussed different stages observable in the behavior of the βrel parameter for ultrasonic fatigue experiments performed on a cast aluminum alloy. Thus, Li et al. Reference Li, Cui, Wen, Su and Engler-Pinto46 relate the decrease in βrel during the first 104 cycles with cyclic hardening, where the subsequent slight increase is related to the formation of microcracks or pores. Thus, the significant increase at the end of the fatigue test was related to the final failure [see D in Figs. 3(e) and 4].
For the present experiments, the variation of βrel is discussed in the following assumed scenario for crack initiation in nitrided steel specimens and originating at internal NMIs: (i) cyclic softening due to the reduction of residual stresses within the nitride layer or of the core material (point A), (ii) crack initiation at NMIs below the NHD and stable crack growth leading to cyclic hardening in the region of the core material (point B), (iii) multiple interruptions between softening caused by crack growth (βrel increase) and hardening (βrel decrease) during crack propagation toward the specimen surface (point C), and (iv) final failure indicated by a pronounced increase in βrel (point D).
The described behavior of the nonlinearity parameter βrel obtained on nitrided specimens was not observed in investigations performed by the authors group Reference Krewerth, Lippmann, Weidner and Biermann29 on specimens of the same material but for polished surface conditions. Here, the nonlinearity parameter remained more or less constant over 95% of the specimens’ fatigue life and only deviated significantly from the zero value immediately before their final failure. However, a similar behavior was observed for all of the nitrided specimens that failed on the first stress level applied and is summarized in Fig. 3S for the three specimens that failed at 625, 650, and 675 MPa, respectively.
C. Fracture surfaces
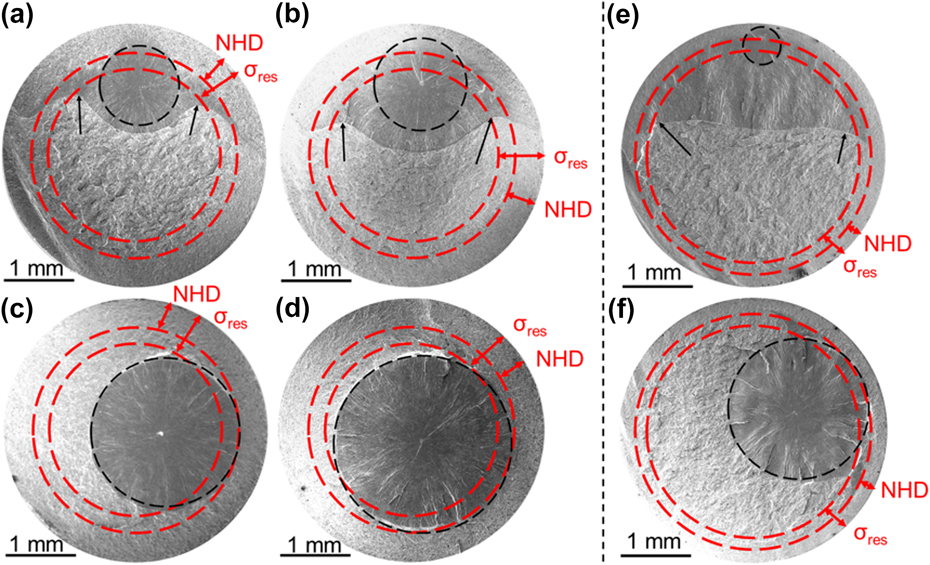
Differences in the appearance of fracture surfaces were observed depending on the NHD and the location of the internal defect with respect to the nitride layer, as summarized by Fig. 5. The dashed red circles correspond to the NHD (outer circle) and the zone of residual compressive stresses σres (inner circle). In all cases, typical fisheye fractures were observed due to the internal failure caused by NMIs. Thus, the protection of the specimen surface against crack initiation due to the residual compressive stresses was successful. Moreover, the location of crack initiation lay below the zone of the residual compressive stresses in all cases. However, different appearances of the fracture surfaces become evident as a function of the NHD and the location of the NMI with respect to the zone of compressive stresses. Thus, NMIs located close to the range of compressive stresses yielded a fracture surface comparable to the picture shown in Fig. 1S. However, at high NHD values, the circumferential edge crack described in Fig. 1S had a more or less penny-shaped form, which was strongly bent toward the specimen surface in regions close to the nitride layer [evident when comparing Figs. 5(a) and 5(b)]. In contrast, NMIs located in the core material caused classical fisheye fracture patterns without any edge cracks, as shown in Figs. 5(c), 5(d) and 5(f). In addition, the points where the curvature of the crack front of the penny-shaped crack changed direction and bent toward the surface correlated well with the zone of residual compressive stresses [see black arrows in Figs. 5(a), 5(b), and 5(e)]. Furthermore, in all cases, the fisheye grew in a circular shape up to the NHD. The influence of the NHD was also observable on the fracture surface. The bent form of the penny-shaped edge crack was less pronounced at lower NHDs for inclusions located close to the nitride layer, as shown in Fig. 5(e).
Fracture surfaces of specimens of batch 1 with NHD = 0.47 mm (a–d) and batch 2 with NHD = 0.225 mm (e, f). (a, b) Crack-initiating NMIs below the zone of residual compressive stress σres [(a) σai = 650 MPa, N i = 448,272,000, s inc = 924 µm; (b) σai = 675 MPa, N i = 9,282,000, s inc = 821 µm]. (c, d) Crack-initiating NMIs in the core material [(c) σa = 625 MPa, N f = 2,066,000, s inc = 1549 µm; (d) σa = 650 MPa, N f = 128,932,000, s inc = 1685 µm]. (e) Crack-initiating NMI below the zone of residual compressive stress σres (σai = 575 MPa, N i = 81,461,000, s inc = 154 µm). (f) Crack-initiating NMI in the core material (σa = 600 MPa, N f = 7,682,000, s inc = 1259 µm). Red dashed circles indicate the NHD and the zone of residual compressive stresses σres, respectively. Dashed black circles indicate the fisheye around crack-initiating NMIs.

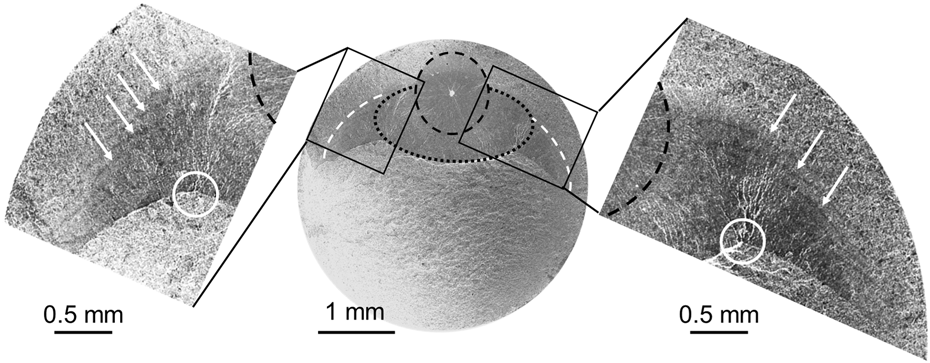
Figure 6 shows the fracture surface of a specimen that failed at σa = 725 MPa after increasing the stress amplitude by four times (see Fig. 3). However, as described in Fig. 3(e), it was assumed (according to the nonlinearity parameter βrel) that crack initiation had already occurred at the initial stress amplitude applied—σa = 650 MPa. The central part of Fig. 6 shows the complete fracture surface with the crack initiation point indicated in the center of the marked fisheye (dashed black circle). The shape of the fisheye changed at the interface of the nitride layer. After the fisheye reached a certain size determined by the distance of the crack initiation point below the nitride layer, the crack propagation rate changed and the crack front transformed from a circular to an elliptical shape (see dashed black lines in the enlarged views of the fracture surface at the left and right sides of Fig. 6). It was clearly visible that the crack fissures had changed their direction. The elliptical shape of the crack front was terminated by two pronounced triangulation points indicated in the areas of higher magnification by the small, bold white circles. These points mark the areas with the highest crack resistance, indicating that crack growth was impeded by the compressive stresses of the nitride layer. Here, additional marks on the fracture surface (bold white arrows) were detected that correlated well with crack arrests during cyclic loading and bore a reasonable resemblance to beach marks obtained by changes in the stress amplitude. Since all fracture surfaces of raised specimens exhibit such beach marks, it was most likely that these beach marks could be attributed to the discontinuities observed in the behavior of the nonlinearity parameter described according to Fig. 5 and were caused by local hardening and softening at different stress amplitudes.
Detailed view on the fracture surface of the specimen discussed in Fig. 5. Central part: Overview of the fracture surface with indicated fisheye fracture, region of faster crack growth toward the core material, and final crack growth toward the specimen surface. Left and right parts: Enlarged views of areas marked on overview image with indicated beach marks (white bold arrows) and the interface between the stable crack growth within the fisheye and faster crack growth toward the core material (black dotted line) and triangulation points (white circles), which mark the points of highest crack resistance.

Both the results from the analysis of the in situ parameters f res and βrel as well as the results of the fractographic characterization led to the assumption that crack initiation already took place at stress levels well below the final stress amplitude of failure. Crack initiation was followed by crack propagation, which was impeded by residual compressive stresses, leading to retardation of the crack growth by the nitride layer. Retardation of crack growth initiated by microporosity is also found in shot-peened and nitrided 42CrMo4 in HCF regimes. Reference Guagliano and Fernandez Pariente47 Nevertheless, crack initiation occurred at NMIs in all cases. Fatigue failure was not observed due to pores or other defects. Two main types of crack-initiating NMIs were detected: namely (i) manganese sulfides in combination with alumina particles and (ii) clusters of alumina in combination with MnS and/or Ti (see Fig. 4S).
IV. DISCUSSION
A. Influence of nitriding hardness depth on fatigue failure
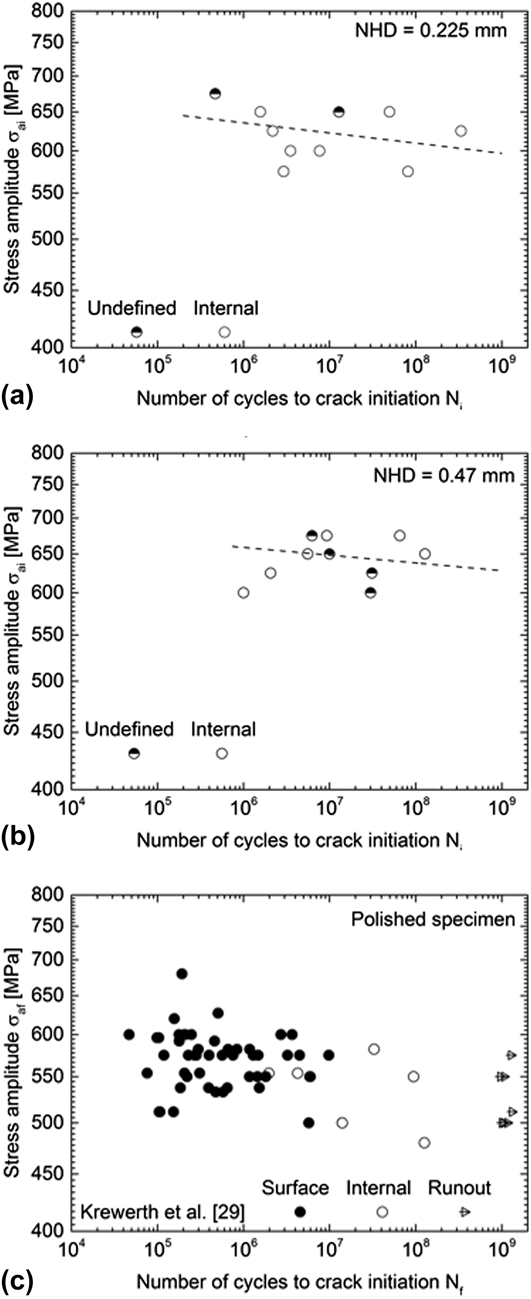
Figure 7 shows curves describing the stress amplitude versus the number of cycles to crack initiation for the two plasma-nitrided batches. Both the crack-initiating stress amplitude σai as well as the number of cycles to crack initiation N i were determined according to the nonlinearity parameter, as described in Section III.B. Open symbols mark specimens with internal crack initiations verified by SEM, while half-filled symbols represent specimens, where it was not possible to identify the crack initiation point [“unidentified”, see Figs. 7(a) and 7(b)]. Filled symbols indicate specimens with surface crack initiation, whereas run-out specimens are indicated by arrows [Fig. 7(c)]. Figure 7 shows comparable crack-initiating stress amplitudes for both batches. Moreover, the location of crack initiation could not be observed for four specimens out of 10 in batch 1. In contrast, the crack initiation point could not be observed for two specimens in batch 2. However, internal crack initiation can be assumed for these specimens.
Stress versus number of cycles to crack initiation N i curves for batch 2 (NHD = 0.225 mm) (a) and batch 1 (NHD = 0.47 mm) (b) in comparison with stress versus number of cycles to failure N f obtained on polished specimens by Krewerth et al. Reference Krewerth, Lippmann, Weidner and Biermann29 (c).

To demonstrate the influence of nitriding treatment on crack initiation, a comparison with ultrasonic fatigue tests on specimens with polished specimen surfaces is shown in Fig. 7(c). Here, results are shown of fatigue tests on a similar material (42CrMo4 QT) with polished specimen surfaces (Krewerth et al. Reference Krewerth, Lippmann, Weidner and Biermann29 ). Two aspects are obvious: (i) the crack-initiating stress amplitudes of nitrided specimens are slightly higher than the failure stress amplitudes of polished specimens and (ii) the nitriding treatment results in the shifting of crack initiation from the specimen surface toward the interior of the specimens. Thus, all nitrided specimens were failed by internal crack initiation. It should be noted that for the plasma-nitrided specimens, the number of cycles to crack initiation N i is given in contrast to polished specimens, where the number of cycles to failure N f is shown in Fig. 7(c). Finally, the number of cycles to crack initiation N i for nitrided specimens lay in the range of 5 × 10⁶ ≤ N i ≤ 5 × 10⁸, whereas the number of cycles to failure for polished specimens N f is in the range of 105 ≤ N f ≤ 107. Thus, the overall fatigue life of nitrided specimens is shifted to a higher number of cycles (see Refs. Reference Genel, Demirkol and Çapa32, Reference Çelik and Karadeniz33, and Reference Terres and Sidhom48). A significantly higher improvement in fatigue strength is reported by Genel et al. and Çelik et al. Reference Genel, Demirkol and Çapa32,Reference Çelik and Karadeniz33 for the plasma nitriding of AISI 4140 in a quenched and tempered state. However, the reader should bear in mind that the aim of the nitriding treatment applied in this study was not to increase fatigue strength. Instead, the shift of crack initiation from the surface to the interior of the specimens was the main goal to facilitate the study of crack initiation at the largest NMI present in the specimen’s bulk material.
B. Fatigue limit
The fatigue limit σw at internal defects was calculated according to Eq. (2) using Murakami’s
 $\sqrt {{\rm{area}}}$
parameter model
Reference Murakami and Beretta49
for both of the nitrided batches with the stress ratio R = −1:
 $${\sigma _{\rm{w}}} = {{C \cdot \left( {{\rm{HV}} + 120} \right)} \over {{{\left( {\sqrt {{\rm{area}}} } \right)}^{1{\rm{/}}6}}}}\quad ,$$
where HV is the Vickers hardness of the core material,
 $\sqrt {{\rm{area}}}$
is the measured size of the nonmetallic inclusion, and C is a coefficient related to the position of the crack-initiating defect (see Refs. Reference Murakami and Beretta49 and Reference Murakami50). The coefficient C in Eq. (2) was set at 1.56 due to internal crack initiation in all cases. Core hardness values of 349 HV10 and 369 HV10 were used for batch 1 and batch 2, respectively.
Figure 8(a) shows the calculated fatigue limit σw at crack-initiating NMIs, and Fig. 8(b) shows the ratio σai/σw of the crack-initiating stress amplitude σai to the calculated fatigue limit at inclusions σw, respectively. Although the crack-initiating stress amplitudes σai are comparable for both batches [see Figs. 7(a) and 7(b)], the estimated fatigue limit σw at inclusions is higher on an average for batch 2 than for batch 1. This can be understood in terms of both the different core hardness values due to different nitriding parameters as well as the different sizes of NMIs. Moreover, the calculated fatigue limit at inclusions shows a higher degree of scatter for batch 2 than for batch 1. Both effects can be related to a size effect caused by the so-called ‘protected volume’, which is about 21% of the total cross section for batch 2 and 41% for batch 1. In general, the calculated fatigue limit σw lies well below the determined crack-initiation stress amplitude σai, which yields values for the σai/σw ratio of well above 1, as shown in Fig. 8(b). Thus, the calculation of the fatigue limit using the
 $\sqrt {{\rm{area}}}$
model of Murakami is still conservative, since the fatigue limit calculated at the NMIs is underestimated.
(a) Calculated fatigue limit σw at NMIs using the
 $\sqrt {{\rm{area}}}$
parameter model of Murakami et al.
Reference Murakami and Beretta49
(b) Ratio of the crack-initiating stress amplitude σai to the calculated fatigue limit σw.

In summarizing the values obtained, the crack-initiating stress amplitude σai and the stress amplitude of failure σaf provide a remarkable result. In all cases, crack initiation occurred well below the nitride layer, as expected. However, the nonlinearity parameter indicated that crack initiation also occurred well below the stress amplitude of failure σaf. Nevertheless, several specimens showed run-out conditions, which were defined at 109 cycles. Even after repeated loading at higher stress levels for an additional 109 cycles, the specimens did not show a pronounced decrease of resonant frequency that could have been interpreted as failure. However, the fracture surfaces clearly indicated retarded growth of the internal cracks in the zone of residual compressive stresses.
V. CONCLUSIONS
The present investigations on the influence of plasma nitriding on fatigue crack initiation in the VHCF regime on quenched and tempered cast steel 42CrMo4 can be summarized as follows:
-
(1) The ultrasonic fatigue tests revealed the beneficial effect of the nitride layer on fatigue life. Thus, the higher NHDs produced higher fatigue limits—as expected. However, in most cases, crack initiation occurred at stress levels σai well below the stress amplitude at failure σaf, which was detected by a detailed analysis of the in situ parameters resonant frequency f res and nonlinearity parameter βrel. In some cases, crack initiation occurred at stress amplitudes of more than 100 MPa less than failure and even for repeated loading to run-out limits of 109 cycles. Thus, the nitride layer provided enormous crack resistance.
-
(2) Crack initiation was successfully shifted to the sample interior by residual compressive stresses, resulting in the characteristic appearance of fracture surfaces that indicated a crack arrest in the form of beach marks.
-
(3) In addition, the improvement in fatigue strength was illustrated by application of the
 $\sqrt {{\rm{area}}}$
parameter model. The higher values of the ratio of the crack-initiating stress amplitude to the calculated fatigue limit at inclusions σai/σw for higher NHDs illustrated the model’s more conservative design.

NOMENCLATURE

Supplementary Material
To view supplementary material for this article, please visit https://doi.org/10.1557/jmr.2017.308.
ACKNOWLEDGMENTS
The authors would like to thank the German Research Foundation (DFG) for its financial support of the Collaborative Research Center CRC 920, subproject C04. In addition, the authors would like to thank Mr. G. Franke (Institute of Iron and Steel Technology, TU Bergakademie Freiberg) for the two-step heat treatment. E. Siegismund, Dr. A. Dalke, and Prof. H-J. Spies (Institute of Materials Engineering, TU Bergakademie Freiberg) are gratefully acknowledged for the plasma nitriding of fatigue specimens and helpful discussions, respectively. Sincere thanks also to Prof. T. Niendorf and Dr. W. Zinn (Institute of Materials Engineering, University of Kassel) for their measurements and discussions on residual stresses.