1. Introduction
Nonlinear interactions of Alfvén waves (AWs) play a substantial role in the heating and acceleration of solar corona and in the auroral acceleration of particles in the Earth's magnetosphere. The collision between counter-propagating Alfvén waves has been investigated in term of magnetohydrodynamics (MHD) and kinetic plasma by a number of authors (e.g. Zhao, Wu & Lu Reference Zhao, Wu and Lu2011; Howes & Nielson Reference Howes and Nielson2013; Nielson, Howes & Dorland Reference Nielson, Howes and Dorland2013; Pezzi, Parashar & Servidio Reference Pezzi, Parashar, Servidio, Valentini, Vasconez, Yang, Malara, Matthaeus and Veltri2017; Howes, McCubbin & Klein Reference Howes, McCubbin and Klein2018; Verniero & Howes Reference Verniero and Howes2018). However, these studies have been focused mainly on the dynamics of turbulent energy transfer in the small perpendicular scales range.
The acceleration by parallel Alfvén waves interactions (APAWI) process described by Mottez (Reference Mottez2012, Reference Mottez2015) is the nonlinear interaction of two Alfvén wave packets propagating mainly in opposite directions, in an initially uniform plasma, with their wave vectors parallel to the ambient magnetic field. The APAWI process causes a significant modulation of the plasma density giving rise to cavities and electron depletion at the crossing region of the waves. Alfvén waves with the same circular polarization can generate a parallel magnetic gradient and electric field that accelerate electrons in the direction of the ambient magnetic field. APAWI can take place in regions associated with trapped Alfvén waves like the IAR (Ionospheric Alfvén Resonator) and radiation belts of the Earth or in magnetic loops in solar corona (see Mottez (Reference Mottez2015) for discussions). However, in such plasma configuration, waves can suffer from several parallel reflections giving rise to more complex interactions. Therefore, unlike previous studies (Mottez Reference Mottez2012, Reference Mottez2015) where only two sinusoidal waves or two wave packets were considered, we consider the interaction of a larger number of waves. For simplicity and to understand the basic physics of particle acceleration by multiple Alfvén wave collisions, we have carried out simulations of the interaction of three parallel Alfvén waves.
We use a particle-in-cell (PIC) numerical simulation code (Mottez, Adam & Heron Reference Mottez, Adam and Heron1998) to study the interaction of three parallel Alfvén wave packets in an initially homogeneous plasma. First, two wave packets interfere and behave according to the APAWI process. Then, a third Alfvén wave packet arrives at the crossing region (inhomogeneous plasma) of the two initial Alfvén waves, which, as we will show, is equivalent to the interaction of a single Alfvén wave packet with an inhomogeneous plasma.
A phase-mixing process occurs when an Alfvén wave propagates through a density inhomogeneity that is transverse to the background magnetic field (Heyvaerts & Priest Reference Heyvaerts and Priest1983). Initially, the Alfvén wave propagates in a parallel direction ($k_{\perp }=0$ ) with a plane surface front. However, when it hits a perpendicular gradient of density like a cavity (density depletion), the wavefront is distorted (phase mixing) because of the faster velocity propagation in the low-density region than in the outside according to the Alfvén velocity $V_A=B_0/(\mu _0\rho _m)^{1/2}$
 , where $\rho _m$
 is the mass density and $B_0$
 is the background magnetic field. Therefore, the wavefront becomes oblique to the parallel magnetic field and develops a perpendicular wave vector $k_{\perp }$
 along the transverse density gradients as well as small perpendicular scales. When this transverse scale $k_{\perp }^{-1}$
 is of the order of the electron inertial length ($c/\omega _{p0}$
 ) in the inertial regime, where $\beta << m_e/m_i$
 ($\beta =2 \mu _0 p/B_0^2$
 is the ratio kinetic pressure over the magnetic pressure), the AW develops a parallel electric field in strong density gradient regions which accelerates electrons in the parallel direction (Génot, Louarn & Le Quéau Reference Génot, Louarn and Le Quéau1999). The parallel electric field $E_{||}$
 is given by the general equation (Goertz Reference Goertz1985):

where $\omega _{p0}$ is the electron plasma frequency and $c$
 is the speed of light.
For a plasma cavity of density $n$ , the parallel electric field is obtained by replacing $k_{\perp }$
 with $(1/n) \partial _{\perp } n$
 , where $\partial _{\perp }$
 is the spatial derivative of the density in the transverse direction to the parallel magnetic field (Génot, Louarn & Mottez Reference Génot, Louarn and Mottez2000).
In the kinetic regime where $m_e/m_i<< \beta << 1$ , a parallel electric field is generated when the $k_{\perp }^{-1}$
 reaches the ion gyroradius length ($\rho _i=m_i v_{\perp }/e B_0$
 ) (see Bian & Kontar Reference Bian and Kontar2011).
Some electrons are accelerated to velocities larger than the wave phase velocity. Therefore, they escape from the acceleration regions and create a beam. In some cases, this beam becomes unstable when it interacts with the plasma giving rise to a beam-plasma instability which evolves to small-scale electrostatic structures where particles may be trapped. Electron phase-space holes are another kind of instability structures that can also stop the acceleration process by trapping particles in their electric field (Mottez Reference Mottez2001). They are associated with a positive potential perturbation and correspond to a low density of particles trapped by an initially low amplitude wave. We identify these structures in the phase space in the form of vortices of dimensions $\delta X$ and $\delta V_X$
 , where the middle of a vortex is centred at phase velocity and propagates with this velocity.
The outline of the paper is as follows: the simulation set-up and parameters are described in § 2. Numerical simulation of the crossing of three parallel Alfvén wave packets is presented in § 3. Two cases are discussed in this section: (i) Alfvén waves with the same polarization; (ii) Alfvén waves with different polarizations and initial positions. Finally, discussion and conclusions are presented in § 4.
2. Simulation set-up and parameters
All physical variables in the code are dimensionless, e.g. the frequency $\omega$ is normalized to electron plasma frequency $\omega _{p0}$
 , charge densities $n$
 to the electron density $n_0$
 , the masses to the mass of the electron $m_e$
 , the charges to the electron charge $e$
 and the velocities to the speed of light $c$
 . The dimensionless distances and wave vectors are given by the ratios $c /\omega _{p0}$
 and $\omega _{p0}/c$
 , respectively. The dimensionless background magnetic field $B_0$
 is given by the ratio $\omega _{ce}/\omega _{p0}$
 , where $\omega _{ce}$
 is the electron cyclotron frequency. The normalized electric field is $E \omega _{ce} /\omega _{p0} cB$
 .
The initial conditions consist of a uniform plasma with identical electron and ion temperatures $T_e=T_i$ .
The initialization of the AWs and their polarization is based on the resolution of the dispersion equation in the context of the bi-fluid theory of the cold plasma. In the case of parallel propagation to the background magnetic field, the fourth-order polynomial dispersion equation has four roots; the two with the highest frequencies are rejected, and the two with the lowest frequencies correspond to the right-handed (RH) and left-handed (LH) circularly polarized AWs. Then, the other perturbations are set depending on the choice of polarization solution (RH or LH). More details are given in the appendix of Mottez (Reference Mottez2008). It is important to note that the phase velocity of the RH wave is higher than the Alfvén velocity, whereas it is lower in the case of the LH wave.
The magnetic field can be written as the sum of the uniform $B_0$ along the $X$
 axis and the sum of the waves’ magnetic fields labelled $i$
 , with $i=1,2,3$
 :

We write the phase relations in the form

with $n_i =\pm 2$ for linear polarization, $n_i=+1$
 for RH waves and $n_i=-1$
 for LH waves. With circularly polarized waves, $B_{iY}=B_{iZ}$
 and we simply write $B_i$
 .
The simulation box size is $L_X \times L_Y= N_X {\rm \Delta} X \times N_Y {\rm \Delta} Y$ . The cell size is ${\rm \Delta} X={\rm \Delta} Y = V_{Te}= \lambda _{De}$
 , where $\lambda _{De}$
 and $V_{Te}$
 are the Debye length and the electron thermal velocity, respectively. The simulations are done in two dimensions ($N_X=4096$
 , $N_Y=64$
 ). The total duration of the simulations is $16\,384 \times {\rm \Delta} t = 1638.4$
 , where ${\rm \Delta} t$
 is the time step defined by ${\rm \Delta} t =0.1$
 . For all simulations, the ion to electron mass ratio is reduced to $m_i/m_e= 100$
 .
Following Mottez (Reference Mottez2015), the background magnetic field and the electron thermal velocity are $B_0=0.8$ and $V_{Te}=0.1$
 , respectively. With these plasma characteristics, we find $(m_i/m_e)\beta =(V_{Te}/B_0)^2=0.016$
 , which corresponds to a plasma in the inertial regime where $(m_i/m_e) \beta << 1$
 . This is the case for large regions in the high altitude auroral zone and inner solar corona. The size of the simulation box is $L_X=N_X \times {\rm \Delta} X=409.6$
 and $L_Y=N_Y \times {\rm \Delta} Y= 6.4$
 .
We consider that one Alfvén wave packet (AWP) is the sum of 16 sinusoidal waves, where the maximum of magnetic amplitude is located at an initial position $X_0/L_X$ . The waves have an RH circular polarization or an LH circular polarization. The wavelengths are $\lambda =\lambda _0/m$
 , where $\lambda _0=L_X=409.6$
 and the number of waves $m$
 varies from 1 to 16. The Alfvén velocity is $V_{A0}=0.08$
 , where the phase velocity varies from 0.2029 for the shortest wave to 0.0855 for the longest one in the case of RH AWP, and varies from 0.02846 to 0.07362 in the case of LH AWP.
The ratio $\omega /\omega _{ci} \approx 0.1639$ for RH waves of large wavelengths ($m=1$
 ). This corresponds to the high-frequency part of the MHD Alfvén waves ($\omega /\omega _{ci} \ll 1$
 ). With waves of short wavelengths ($m=16$
 ), the ratio $\omega /\omega _{ci} \approx 6.225$
 does not correspond to a purely MHD Alfvén wave, but to an electron cyclotron wave (or Whistler wave) which is situated on the upper frequency part of the same dispersion relation branch. All the LH wave frequencies are lower than the ion cyclotron frequency $\omega _{ci}$
 ($\omega /\omega _{ci} \approx 0.1412$
 for $m=1$
 and $\omega /\omega _{ci} \approx 0.8731$
 for $m=16$
 ). We are still in the high-frequency range of the MHD Alfvén waves branches.
According to Buti et al. (Reference Buti, Velli, Liewer, Goldstein and Hada2000), the LH AWPs are unstable and they can collapse or change the polarization in the $\beta \ll 1$ regime, while the RH waves are more stable in this regime. Because we are propagating LH Alfvén waves in our simulations, we have checked this possibility. A simulation of the propagation of a single LH wave with an initial amplitude of $\delta B/B_0=0.1$
 shows a localized wave packet as in the case of an RH wave. Both AWPs propagate without changing their direction and they are not destroyed by the dispersion.
We can notice that the initial Alfvén waves in Buti et al. (Reference Buti, Velli, Liewer, Goldstein and Hada2000) have a large value $\delta B/B_0=0.5$ , where the collapsed Alfvén wave packets seem to stabilize around an amplitude of $\delta B/B_0=0.2$
 . In our study, the amplitude is low, and this explains why we do not observe the instability described by Buti et al. (Reference Buti, Velli, Liewer, Goldstein and Hada2000).
3. Simulation of crossing of three parallel Alfvén wave packets
We present a series of numerical simulations of Runs (a), (b), (c) and (d). Table 1 shows the runs and initial conditions. In these simulations, the number of particles per cell is fixed to $N=50$ or $N=100$
 for the simulations. The first wave packet propagates towards increasing values of $X$
 (downward direction $D$
 ), whereas the second one propagates towards decreasing values of $X$
 (upward direction $U$
 ). The third wave packet propagates upward.
Simulation runs and initial conditions. The dash between two polarizations in the second column indicates the interaction of the initial AWPs. The observations concern the three AWPs crossing region.

3.1. Alfvén waves with the same RH polarization
3.1.1. Simulation (a)
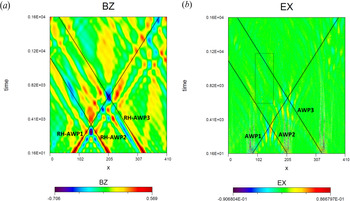
Simulation (a) shows the interaction of two Alfvén wave packets followed by the passage of a third wave packet. The initial positions of the three wave packets are $X_0/L_X=0.2, 0.5$ and 0.8, respectively. Their amplitudes and polarization (RH) are the same. Simulation (a) is shown in figure 1. Figure 1(a) shows the interaction of three wave packets of the same polarization (RH) through the temporal evolution of the component $B_Z(X,t)$
 . The oblique lines represent the time-distance path of the three RH-AWP centres. In this simulation, the crossing of the two first wave packets occurs from $t\approx 205$
 at the position $X\approx 145$
 . The third packet interacts with the crossing region from $t \approx 410$
 at the position $X \approx 205$
 . In fact, the third wave will interact initially with one of the initial RH waves before its passage through the crossing region. We can observe that the two initial and the third wave packets continue to propagate in their original directions. They are not destroyed after their interactions.
Run (a). Temporal variation of the components (a) $B_z(X,t)$ and (b) $E_X(X,t)$
 as a function of the parallel coordinate $X$
 . The oblique lines in both panels show the time-distance path of the three wave packet centres (RH-AWP). The rectangle in panel (b) circumscribes the electric fields that can emerge from a non-APAWI process.

We notice that because of the periodicity of the box in the $X$ direction, one of the initial waves $(X_0/L_X=0.5)$
 which has already interacted with the first one $(X_0/L_X=0.2)$
 reappears in the right side of the box and interacts once again with the first one at $X\approx 358$
 leading to what we call ‘artificial’ interactions mainly visible at the end of simulations.
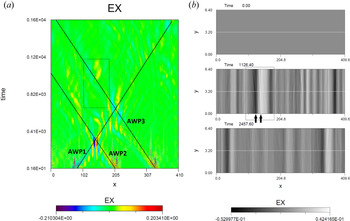
Figure 1(b) shows the temporal evolution of the parallel electric field $E_X(X,t)$ for simulation (a). A first quasi-stationary parallel electric field is observed at $X\approx 145$
 and it is associated with the collision between the two initial Alfvén waves according to the APAWI process. While the APAWI electric field vanishes at $t\approx 546$
 , a weaker one emerges mainly for $102 \le X \le 145$
 from $t\approx 600$
 and it seems to follow the propagation of the third AW. These non-APAWI electric fields are faintly visible inside the AWP1–AWP2 interaction region circumscribed by the rectangle.
A second APAWI quasi-stationary parallel electric field is observed at $X \approx 205$ from $t\approx 410$
 which is associated with the collision between the third AWP with the first initial one $(X_0/L_X=0.2)$
 .
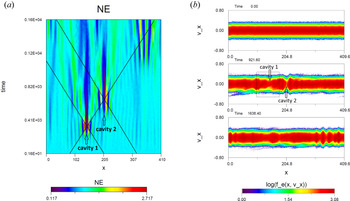
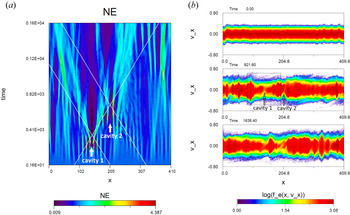
Simulations from Mottez (Reference Mottez2012, Reference Mottez2015) have shown the emergence of plasma density perturbation and cavities when two Alfvén waves interact (APAWI). Figure 2(a) shows the temporal evolution of the electron density $N_e(X,t)$ for simulation (a). As observed by Mottez (Reference Mottez2012, Reference Mottez2015), a large part of the density modulations that emerge from waves crossing does not dissipate and persists during all our simulations. The crossing of two initial RH Alfvén wave packets shows a high amplitude depletion of the electron density at the locus of the interaction between the two waves at $X \approx 145$
 (cavity 1). A second cavity observed at $X \approx 205$
 results from the interaction of the third wave packet with the first one (cavity 2).
Run (a). (a) Temporal variation of the electron density $N_e(X,t)$ , where cavity 1 and cavity 2 are the locations of the two emerged density depletions from the APAWI process. (b) Snapshots from $t = 0$
 to $t = 1638.4$
 of the electron parallel distribution function $f_e(X, V_X)$
 in logarithmic scale. The rectangle in the snapshot at $t = 921.6$
 circumscribes the AWP3–cavity 1 interaction region.

Figure 2(b) shows the parallel distribution function of electrons $f_e$ . At $t=921.6$
 , we observe electron phase-space holes in the form of vortices ($f_e$
 vortices) inside the rectangle where the AWP3 crosses the cavity 1 (from $X\approx 102$
 to $X\approx 205$
 ). The typical size of these structures is approximately $\delta X \le 15$
 . An electron beam of velocity $\sim 5 V_{Te}$
 emerges inside the rectangle in the distribution function near the position $110 \le X \le 128$
 .
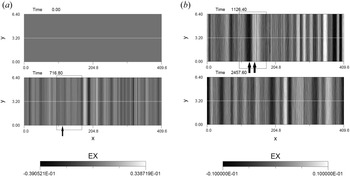
In figure 3(a), a very narrow size electric field ($|E| \sim 0.023$ ) is observed in the snapshot $t=716.8$
 at the position $X \approx 115$
 (see the black arrow). In figure 3(b), larger fibril electric fields of slightly less strength ($|E| \sim 0.011$
 ) are observed in the snapshot $t = 1126.4$
 at $X\approx 125$
 and $X \approx 143$
 , respectively (see black arrows). The small-scale electric field at $t=716.8$
 is visible at the bottom of the rectangle in figure 1(b), where the large size ones are faintly visible from the middle to the top of the rectangle. It is interesting to observe that the electron beam emerges between the locations of the small size electric field and the large ones.
Run (a): Snapshots from (a) $t = 0$ to (b) $t = 2457.6$
 of the parallel electric field $EX(X,Y)$
 . The black rectangles in snapshots (a) $t=716.8$
 and (b) $t=1126.4$
 circumscribe the region where AWP3 crosses the cavity 1. The black arrows show the location of the strong parallel electric fields that arise inside this region.

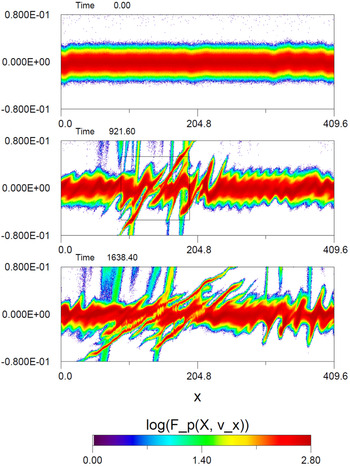
Ion beams are also observed in the region where the third AWP crosses the cavity 1 at $t=921.6$ (figure 4).
Run (a). Snapshots of ion parallel distribution function $f_p(X, V_X)$ in logarithmic scale.

3.1.2. Simulation (b)
Simulation (b) is the same as simulation (a) except that the wave amplitude is increased two times ($\delta B/B_0=0.1$ ). In figure 5(a), we observe a larger cavity depletion amplitude at both positions $X \approx 145$
 and $X \approx 205$
 . This is the consequence of the large-amplitude propagating waves in comparison to simulation (a). Larger amplitude electron vortices associated with the AWP3–cavity 1 interaction region were observed in the parallel distribution function of electrons in figure 5(b). This may be the direct consequence of the AW's higher amplitude and instabilities which catch more particles of the core distribution and the beams (Mottez Reference Mottez2001). A tiny and scattered electron beam (velocity $\sim 7 V_{Te}$
 ) emerges from the AWP3–cavity 1 crossing region ($93 \le X \le 205$
 ).
Run (b). (a) Temporal variation of the electron density $N_e(X,t)$ . The oblique white lines indicate the time-distance paths of the wave packet centres. (b) Snapshots from $t = 0$
 to $t = 1638.4$
 of the electron parallel distribution function $f_e(X, V_X)$
 in logarithmic scale.

Figure 6(a) shows the temporal variation of the parallel electric field $EX(X,t)$ . We can observe non-propagative high-frequency oscillations at the initial positions of the wave packets. This noisy background is caused by an imperfect initialization of the wave modes. They are visible also in figure 1(b). In comparison to simulation (a), larger and stronger APAWI quasi-stationary electric fields are observed at the crossing regions of two Alfvén waves. Other electric fields are observed at the region where the third Alfvén wave crosses the first cavity depletion from $t\approx 600$
 (the black rectangle region). The stronger ones are clearly visible at the top of the rectangle for $1000\le t \le 1200$
 . However, the last parallel electric field is more extended in space and it is not stationary like the APAWI ones.
Run (b). (a) Temporal variation of the component $E_X(X,t)$ as a function of the parallel coordinate $X$
 . The rectangle circumscribes the electric fields that can emerge from the AWP3–cavity 1 interaction. (b) Snapshots from $t = 0$
 to $t = 2457.6$
 of the electric field $EX(X,Y)$
 . The black arrows show the location of the strong parallel electric fields that arise inside the AWP3–cavity 1 crossing region.

The parallel electric fields associated with the AWP3–cavity 1 crossing region are visible in figure 6(b) at the snapshot $t=1126.4$ (see the black arrows). They are stronger than those of simulation (a) ($|E| \sim 0.038$
 ) and they also show a fibril structure.
3.2. Alfvén waves with different polarizations and initial positions
3.2.1. Simulations (c) and (d)
Simulation (c) concerns the interaction of an LH wave with two initial Alfvén waves of different polarization (RH–LH). The initial positions of the waves are the same as in simulation (a). Simulation (d) is for the interaction of an RH wave with two initial waves of different polarization (RH–LH). Unlike simulations (a), (b) and (c), the two initial wave packets in simulation (d) are initialized at $X_0/L_X=0.5$ and $X_0/L_X=0.8$
 , respectively, whereas the third wave packet started at the position $X_0/L_X=0.2$
 . In both simulations (c) and (d), we observe a weaker cavity depletion amplitude and a weaker parallel electric field strength in comparison to simulation (a).
3.3. Phase mixing and longitudinal density gradient
Given that, an interesting question emerges: can the phase-mixing process explain the observation of the non-APAWI parallel electric fields from the passage of the third Alfvén wave packet through the cavity-1 region (density inhomogeneity gradients)?
Phase mixing has been associated with density depletion or cavity (plasma under-density) in auroral regions (Génot et al. Reference Génot, Louarn and Le Quéau1999, Reference Génot, Louarn and Mottez2000; Mottez & Génot Reference Mottez and Génot2011) or more recently in interplume regions (Daiffallah & Mottez Reference Daiffallah and Mottez2017). This mechanism has been associated also with the density bump or plasma over-density in solar coronal loops (Tsiklauri Reference Tsiklauri2007, Reference Tsiklauri2011, Reference Tsiklauri2012, Reference Tsiklauri2016) or in a solar coronal holes (Wu & Fang Reference Wu and Fang2003).
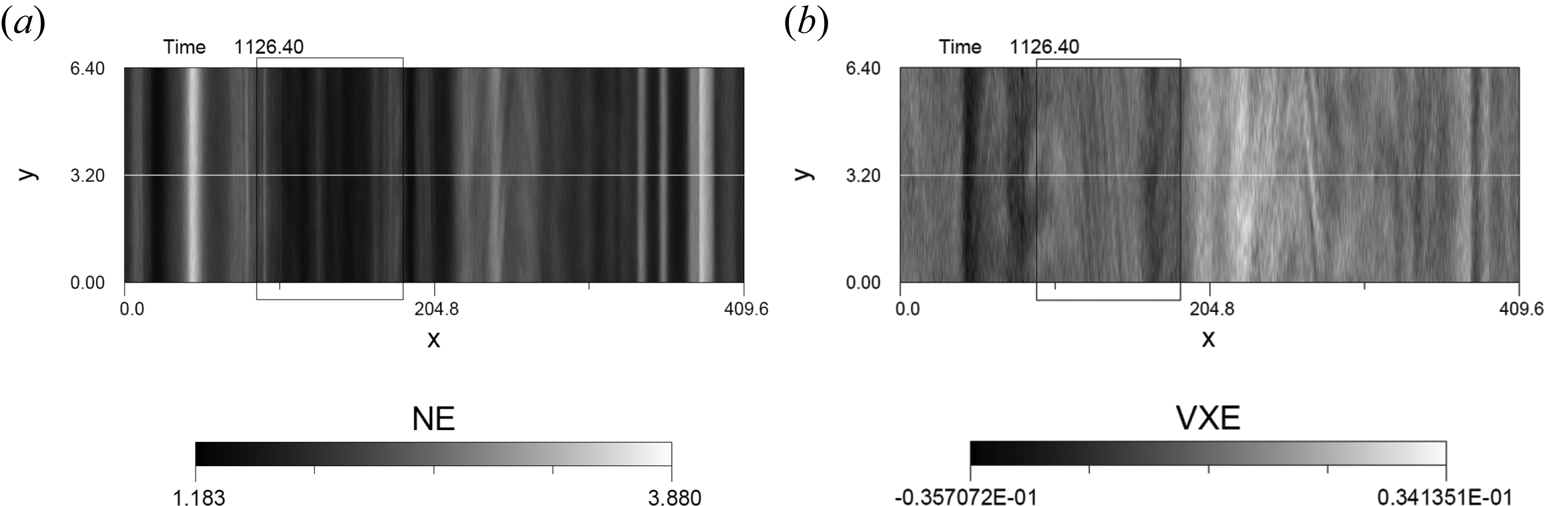
However, APAWI density gradients $N_e(X,Y)$ show a longitudinal modulation-like profile for all our simulations (see figure 7a). The parallel electric fields observed for simulations (a) and (b) in figures 3 and 6(b), respectively, show similar longitudinal profile.
Run (b). Snapshot at $t = 1126.4$ of (a) the electron density $N_e(X,Y)$
 and (b) the electron parallel velocity $VXE(X,Y)$
 .

The phase-mixing process in the case of a longitudinal gradient of density is more complex. In the context of resonant mode conversion and using analytic calculations, Xiang, Chen & Wu (Reference Xiang, Chen and Wu2019) showed that a kinetic Alfvén wave is hardly excited when $\alpha \le 40^{\circ }$ , where $\alpha$
 is the angle between the background parallel magnetic field and the density gradient of the plasma. Génot et al. (Reference Génot, Louarn and Le Quéau1999) demonstrated analytically that a pure parallel electric field is generated in the regions of transverse density gradients, whereas in the regions of longitudinal density gradients, the emerged parallel and perpendicular electric fields are coupled. Lysak & Song (Reference Lysak and Song2008) performed simulations where they considered the case of parallel and perpendicular density gradients in the Earth magnetosphere. They observed that a parallel electric field was developed at the gradient regions in the Alfvén speed.
In addition to the theoretical possibilities that are cited above, we suggest for our simulation that the passage of the Alfvén waves can induce a relative drift $\textit {V}_0=\textit {E} \times \textit {B}/B^2$ along the discontinuity boundary between the background plasma and the longitudinal APAWI density cavity structure. This will generate interface waves along the discontinuity which allows the incoming wave to interact with a wavy density gradient (oblique gradient). These wavy fibre-structures can be seen in figure 7(a) for simulation (b). When the wave reaches the oblique density cavity, the distorted wave front develops small-scale $k_{\perp }$
 structures in the transverse $Y$
 -direction. Because we are in an inertial regime, when $k_{\perp }^{-1}$
 reaches the electron inertial length $c/\omega _{p0}$
 , a parallel electric field is generated at this transverse gradient by the phase-mixing process.
The electron and ion drifts are at the same velocity $\textit {E} \times \textit{B}$ . Furthermore, the transverse size of our box $L_Y$
 is large in comparison to the ion gyroradius $\rho _i=1.25$
 . This gives an MHD behaviour to the plasma in the transverse direction (Faganello & Califano Reference Faganello and Califano2017).
In our simulations, interface waves can be generated when the third wave packet crosses the region of longitudinal density (cavity 1) that emerged from the APAWI process. Two drift terms can contribute to the creation of small-scale structures ($k_{\perp }^{-1}$ ) in the transverse direction $Y$
 : the first one is $\delta \textit{E}_{3Z} \times \textit{B}_0$
 , where $\delta E_{3Z}$
 is the electric field perturbation of the third AW in the $Z$
 -direction. The second term is $\textit {E}_X \times \delta \textit{B}_{3Z}$
 , where $\delta B_{3Z}$
 is the magnetic field perturbation of the third AW in the $Z$
 -direction and $E_X$
 is the parallel electric field that results from the collision between the two initial Alfvén waves (APAWI). This last term, which depends on the lifetime of $E_X$
 , vanishes rapidly in comparison to the first term. To compare the contribution of these two terms, we have calculated the ratio of the magnitude of the first term to the magnitude of the second term:

where $\delta E_{3Z}=V_3 \delta B_{3Z}$ , $V_3$
 is the phase velocity of the incoming third Alfvén wave, $\delta B_{3Z}/B_0=0.1$
 or $0.05$
 and $B_0=0.8$
 . In Mottez (Reference Mottez2015), the simulation AWC009 is quasi similar to the APAWI part (RH–RH) of simulation (a), where the maximum of APAWI parallel electric field $E_X$
 is approximately 0.013. In simulation (a), the phase velocity of the third Alfvén wave packet $V_3$
 varies from 0.0855 to 0.2029. Then the ratio in (3.1) for simulation (a) is between 5.26 and 12.49. This means that in simulation (a), the first drift term $\delta \textit {E}_{3Z} \times \textit {B}_0$
 is almost predominant in comparison to the second one.
It is possible that interface waves are generated along the longitudinal APAWI density structures earlier when the two initial waves (RH–RH) (or RH–LH) move away after their interaction. Thus, outgoing wave packets will cross a part of the emerged APAWI density generating primordial small-scale $k_{\perp }^{-1}$ structures in the transverse direction before the passage of the third wave packet. Given that, it is interesting to calculate the ratio of the velocity drift magnitude ($\delta\textit {E}_Z \times \textit {B}_0$
 ) of a single RH Alfvén wave to the velocity drift magnitude of a single LH wave. This ratio is approximately 1.16 ($m=1$
 ) and 7.13 ($m=16$
 ) for waves of the same amplitude, which means that the single RH Alfvén wave will induce more important transversal modulations in the APAWI longitudinal density structures than the single LH wave of the same amplitude. This result is in favour of a stronger parallel electric field generation in simulations (a) and (b).
In the phase-mixing process, a higher incoming wave amplitude can induce a higher concentration of space charge on the transverse density gradient regions, as well as the creation of stronger parallel electric fields, which in turn accelerate electrons more efficiently (see Génot et al. Reference Génot, Louarn and Le Quéau1999; Tsiklauri & Haruki Reference Tsiklauri and Haruki2008). This is the case of simulation (b), where the amplitude of the third incoming AW is larger compared with that of the other simulations.
For both simulations (a) and (b), the phase-mixed parallel electric fields associated with longitudinal density gradients show clearly wavy fibre-like structures ($93 \le X < 205$ for $t>600$
 ). In general, these tiny localized structures are difficult to observe, particularly for snapshots where a poor contrast shows mainly a global longitudinal modulation. They are better discerned in simulation (b) for the electron parallel velocity $VXE(X,Y)$
 (figure 7b) at $t=1126.4$
 . Different patterns of these structures can be seen depending on the size of the gradient and the wavelength of the perturbation along the transverse direction $Y$
 .
In simulation (a), the horizontal length of the small-scale parallel electric field associated with the phase-mixing process measured from figure 3(a) ($t=716.8$ ) is approximately $\delta X \sim 0.98$
 . In simulation (b), the parallel electric field associated with the acceleration region is rather formed by a cluster of small-scale fibre structures (figure 6b at $t=1126.4$
 ), where the the horizontal length of a single fibre is approximately $\delta X \le 0.98$
 . These sizes fit very well the size of the the electron inertial length ($c/\omega _{p0}=1$
 ).
In conclusion, when the AWP crosses the longitudinal APAWI density gradient structure, fibre structures start to oscillate in the transverse direction. Parallel electric fields are generated in each small structure by the phase-mixing process as long as the size of the fibre-transverse-section crossed by the wave front is in the range of $c/\omega _{p0}$ . Then, the large-size parallel electric fields associated with the modulations of density are the contribution of all fine-structure parallel electric fields.
4. Discussion and conclusion
The APAWI process causes a significant modulation of the plasma density and accelerates particles in the parallel direction. This process has been studied for higher and lower ambient magnetic fields by Mottez (Reference Mottez2012, Reference Mottez2015), respectively. In the present work, we are trying to generalize the APAWI process by interacting a third parallel Alfvén wave packet with two initial ones. The aim was to explain the observation of high-energy electrons through the nonlinear wave–wave interaction model.
We have investigated the nonlinear interaction of three crossed parallel Alfvén wave packets in an initially uniform plasma ($k_{\perp }=0$ ), by using a PIC numerical simulation code. The two closest Alfvén waves will collide first in the context of the APAWI process giving rise to an inhomogeneous plasma at the APAWI crossing region. Then the third Alfvén wave interacts in turn with the emerged density modulations and waves. We observe parallel electric fields and ion beams localized at the APAWI crossing region. We suggest that they result from a phase-mixing process between the third Alfvén waves and the APAWI density depletion. This is the case for waves with different polarizations like (RH–LH LH) or (RH–LH RH) configuration, where RH and LH refer to right and left circular polarization, respectively. However, electron beams ($V\sim 5\text{--}7 V_{Te}$
 ) associated with larger parallel electric fields are observed for the interaction (RH–RH RH), particularly when large amplitude propagating Alfvén waves are simulated.
While APAWI density structures show longitudinal gradients, we explain the transversal modulations to the propagation of interface waves generated mainly by the velocity drift $\delta\textit{E}_Z \times \textit {B}_0$ along the boundaries of the emerged longitudinal APAWI density structures, where $B_0$
 is the background magnetic field and $\delta E$
 is the electric field perturbation of the crossing waves. Our simulations were performed in the inertial regime. Therefore, the transverse size of the small-scale density gradients $k_{\perp }^{-1}$
 have to be of the order of $c/\omega _{p0}$
 to produce a strong parallel electric field that can accelerate electrons in the direction of the background magnetic field. We have estimated from simulation (b) that the longitudinal size of the large phase-mixed parallel electric field structure is of the order of 6 km in the auroral zone, where the transverse scale length (fine structures) $c/\omega _{p0}\sim 168$
 m. The possibility and the observation of electric field structures of comparable size have been discussed by Karlsson, Andersson & Gillies (Reference Karlsson, Andersson, Gillies, Lynch, Marghitu, Partamies, Sivadas and Wu2020). Nevertheless, large amplitude interface waves can evolve to Kelvin–Helmholtz instability. In this context, many authors have reported the important role that this instability plays in the Earth magnetosphere dynamics (see Faganello & Califano (Reference Faganello and Califano2017), and references therein). Structures and even vortices from this instability have been also observed in the auroral sheet (Hallinan & Davis Reference Hallinan and Davis1970).
Actually, the process of interaction of three parallel waves invoked in this study is different from the APAWI one. The APAWI process involves simultaneous crossing of parallel counter-propagating Alfvén waves, whereas in the mechanism studied here, the third wave packet arrives with a very short delay compared with the instant when the two initial waves interact. From a geometrical point of view, the two process are comparable because wave packets propagate in the parallel direction to the background magnetic field. Nevertheless, to compare the two processes from a physical point of view, the three propagating Alfvén waves have to cross together simultaneously. This can be possible only if the third wave packet propagates obliquely (or three oblique Alfvén waves). However, this involves a further $k_\perp$ from the oblique propagation in addition to $k_\perp$
 generated from the nonlinear coupling of the counter-propagating Alfvén waves, which slightly changes the problem. This may be the subject of further study.
It is interesting to notice that because of the periodic horizontal boundary conditions, the complex interaction that occurs at the final stage of simulations can give us an idea about phenomena related to multiple reflection of Alfvén waves in a resonant cavity. However, how are we able to justify the presence of waves of different polarization in our simulations because basically we want to study the self-interaction of a single Alfvén wave packet when it undergoes multiple reflection? To answer to this question, we can imagine a situation where an RH Alfvén wave packet propagates in ($\beta < m_e/m_i$ ) plasma as in our simulation but surrounded by a plasma with ($\beta > 1$
 ). Using a kinetic approach, Buti et al. (Reference Buti, Velli, Liewer, Goldstein and Hada2000) have shown that an RH Alfvén wave packet is unstable for a plasma with $\beta > 1$
 and can collapse when it arrives at a turning point depending on the initial amplitude of the wave packet. At this critical point, the RH wave packet would change polarization to become like an LH wave packet. Given that, this transformed LH wave packet can return back from a reflective boundary layer or from the strong conditions turning point and cross the initial RH wave packet. If this interaction (RH–LH) can occur, then three wave packets (or more) of different polarizations (and amplitudes) can interact also under the same circumstances. The mechanism of conversion from fast magneto-acoustic wave to Alfvén and slow waves above an active region ($\beta < 1$
 ) in low solar corona, including a change in polarizations and amplitudes, also offers a possibility for a single wave to collide with their counter-propagating parts after reflections and damping in regions of rapidly Alfvén speed increases in an open magnetic field (Khomenko & Cally Reference Khomenko and Cally2012), or in a closed magnetic field configuration like a coronal magnetic loop (Fletcher & Hudson Reference Fletcher and Hudson2008). Obviously, the wavelengths of the MHD waves and the size of the resonant cavity have to be in the range where kinetic effects of the plasma can take place.
Alfvén waves propagating through a longitudinal density gradient can undergo a reflection because the propagation velocity $V_A(X) =B_0/\sqrt {\mu _0 \rho _m(X)}$ changes along the parallel direction. Musielak, Fontenla & Moore (Reference Musielak, Fontenla and Moore1992) have calculated the critical frequency $f_c$
 under which an incident Alfvén wave can be reflected by a longitudinal gradient. In terms of our dimensionless variables, this frequency can be written as $\varOmega _{c} = \frac {1}{2} V_{A0} \sqrt {(V_A')^2 +|2V_AV_A''|}$
 , where the prime in this equation indicates the spatial ($X$
 ) derivative and $V_{A0}=0.08$
 is the Alfvén velocity at the background uniform plasma $N_{e0}$
 . The Alfvén velocity $V_A(X)$
 for a single wave is calculated along a typical APAWI cavity, which we approximate with a longitudinal Gaussian density profile. We assume that the maximum amplitude of a typical moderate cavity and its width are $Max(N_e(X)/N_{e0})=0.4$
 , $\delta X=18$
 , respectively. We find that $\varOmega _c \approx 1.4 \times 10^{-3}$
 . From initial conditions, the frequencies in the LH wave packet vary from $1.13 \times 10^{-3}$
 ($m=1$
 ) to $7 \times 10^{-3}$
 ($m=16$
 ), and the frequencies in the RH wave packet vary from $1.31 \times 10^{-3}$
 ($m=1$
 ) to $5 \times 10^{-2}$
 ($m=16$
 ), where $m$
 is the number of waves. Therefore, it is clear that a small part ($m=1$
 ) of the wave packet will undergo a reflection from APAWI longitudinal density cavities. However, the equation for $f_c$
 in Musielak et al. (Reference Musielak, Fontenla and Moore1992) is valid only for linear Alfvén waves of relatively low amplitude and for a non-fibril cavity. Furthermore, an Alfvén wave packet modulates in time the density gradient making it profile time-dependent, which makes the calculation of the dynamical $f_c$
 more complicated.
In addition to the nonlinear phase mixing process, it is possible that the reflection of the wave packets from the emerged longitudinal APAWI density gradients contributes to electron heating, which depends on the transmitted wave amplitude (Bose et al. Reference Bose, Carter, Hahn, Tripathi, Vincena and Savin2019). It is possible also that a part of the parallel Alfvén wave can be trapped between two reflective longitudinal APAWI gradients if the wavelength is smaller than the distance between these two gradients. At the MHD scale, Moore, Musielak & Suess (Reference Moore, Musielak, Suess and An1991) have shown that the heating of coronal holes is predominantly caused by the reflection and dissipation of the trapped Alfvén waves rather than of the transmitted waves. By invoking a turbulence cascade, a similar mechanism could possibly occur at the kinetic level. However, it is difficult to confirm these possibilities from our simulations because we observe the contribution of three propagating Alfvén waves. In this regard, it will be important to carry out simulations of a single parallel Alfvén wave propagation through longitudinal (fibril) density gradients of different sizes. These will be the topics of a forthcoming investigation.
Acknowledgements
I would like to express my sincere gratitude to F. Mottez from Observatoire de Paris for the original idea of the paper, and for years of discussion, inspiration and help. I am also thankful to the anonymous referee for constructive comments and suggestions that have greatly improved the quality of the paper.
Editor Antoine C. Bret thanks the referees for their advice in evaluating this article.
Declaration of interests
The author report no conflict of interest.
Data availability
The data that support the findings of this study are available within the article.