Compared with a femtosecond (fs) pulsed Ti:sapphire laser, that is, the conventional excitation light source of a typical two-photon microscope, an Yb-doped fs fiber laser is stable to a change in temperature.[Reference Ricaud, Jaffres, Wentsch, Suganuma, Viana, Loiseau, Weichelt, Abdou-Ahmed, Voss, Graf, Rytz, Hönninger, Mottay, Georges and Druon1] Furthermore, an fs fiber laser can be used in a high-humidity environment. Thus, if the fs fiber laser is used as the excitation light source of a two-photon fluorescence microscope, two-photon imaging can be realized even under severe conditions, such as in an operating room of a hospital or an animal research laboratory, where a Ti:sapphire laser may not be stable.
Although the oscillating wavelength of a Ti:sapphire laser is typically tunable between 680 and 1300 nm, an fs fiber laser is fixed at 1030 or 1050 nm. Therefore, to use an fs fiber laser as the excitation light source of a two-photon microscope, two-photon fluorescence dyes that are excitable at 1030 or 1050 nm are required. Fluorescence dyes possessing a one-photon absorption (OPA) band at around 500 nm, which is approximately half of the oscillating wavelength of an fs fiber laser, are the best candidates to be two-photon excitable using an fs fiber laser. In fact, oxygen mapping of living cells by two-photon excitation using an fs fiber laser has already been demonstrated by employing an Ir(III) complex whose OPA maximum is 510 nm.[Reference Moritomo, Fujii, Suzuki, Yoshihara, Tobita and Kawamata2] Using an fs fiber laser, two-photon excitation imaging of blood vessels in a mouse brain has also been achieved by employing Texas Red whose OPA maximum is 591 nm.[Reference Perillo, McCracken, Fernée, Goldak, Medina, Miller, Yeh and Dunn3]
Even if a fluorescence dye is excitable by an fs fiber laser, the dye may not always be applicable to two-photon microscopy. To stain living cells or tissues, the dyes should be water soluble. Most hemicyanine dyes are known to exhibit sufficient water solubility for staining living cells or tissues. For example, 4-[4-[4-(dimethylamino)phenyl]-1,3-butadienyl]-1-ethylquinolinium perchlorate (LDS-798) has been reported as a fluorescent probe of a living cell.[Reference Doan, Castillo, Bejjani, Nurekeyev, Dzyuba, Gryczynski, Gryczynski and Raut4] Therefore, hemicyanine dyes possessing a OPA band at around 500 nm should be useful fluorescent probes for fiber laser excitation two-photon microscopy.
Cationic dyes with elongated molecular structures tend to localize at mitochondria.[Reference Moritomo, Yamada, Kojima, Suzuki, Tani, Kinoshita, Sasaki, Mikuni, Kinjo and Kawamata5–Reference Zhang, Sun, He, Zhang, Tian, Feng, Zhang, Li, Guo, Yu and Zhang9] This is because such dyes interact with the negatively charged inner lipophilic membrane of mitochondria owing to their cationic property and adequate lipophilicity. In fact, it has been reported that LDS-798 localizes at mitochondria in living cells.[Reference Doan, Castillo, Bejjani, Nurekeyev, Dzyuba, Gryczynski, Gryczynski and Raut4] Thus, hemicyanine dyes are expected to be fluorescent probes for visualizing mitochondria. Hence, in this study, the optical properties, including the TPA spectra of hemicyanine dyes possessing an absorption band at around 500 nm, have systematically been investigated.
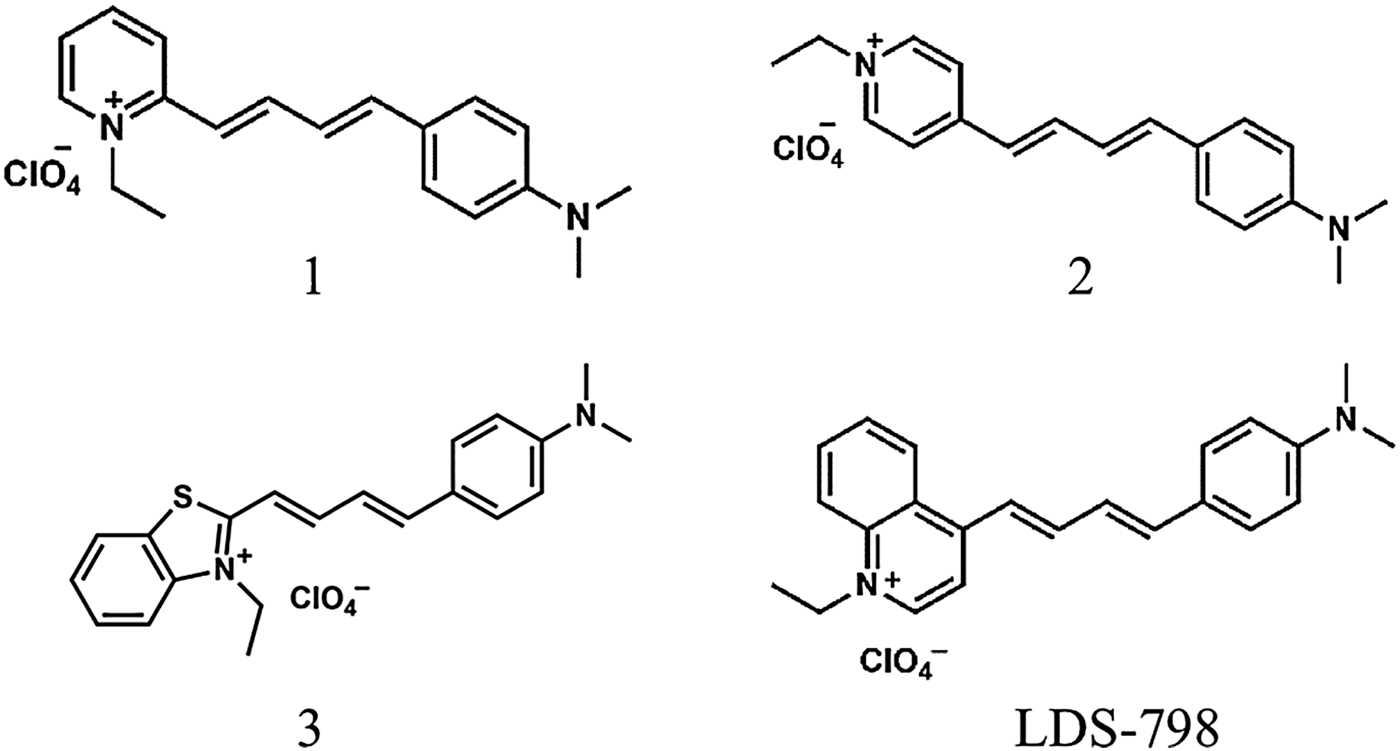
Commercially available hemicyanine dyes, provided by Exciton (Oakley, Inc., 2150 Bixby Road Lockbourne, OH 43137, USA), were used without further purification. The chemical structures of the hemicyanine dyes are shown in Fig. 1. Dimethylsulfoxide (DMSO) was used as a solvent for measuring the OPA and TPA and fluorescence spectra. OPA spectra were recorded on a JASCO V-670-UV-NIR spectrophotometer using 10 mm quartz cuvettes filled with a 1.0 × 10⁻⁵ mol/dm3 solution. Fluorescence spectra and fluorescence quantum yields of the dyes were obtained for the 1.0 × 10⁻⁶ mol/dm3 solutions using an absolute photoluminescence quantum yield measurement system (Hamamatsu Photonics C9920-02G). The excitation wavelengths were the OPA maxima of each compound. The solution was de-oxygenated by bubbling N2 for 30 min to ensure maximum quantum yields. TPA spectra were obtained by the two-photon-induced fluorescence technique reported previously.[Reference Xu and Webb10] Compounds 1–3 were dissolved in DMSO at a concentration of 0.2 × 10⁻³ mol/dm3. TPA cross-sections of dyes were estimated by using fluorescence quantum yields of a concentration of 0.2 × 10⁻³ mol/dm3 solutions. Although, the fluorescence quantum yields of a concentration of 0.2 × 10⁻³ mol/dm3 solutions were decreased compared with 1.0 × 10⁻⁶ mol/dm3 solutions, fluorescence quantum yields in the 0.2 × 10⁻³ mol/dm3 solutions were explained by the Stern–Volmer plot based on the quantum yields at 1.0 × 10⁻⁶ mol/dm3, which indicated that concentration quenching was not significant even in the 0.2 × 10⁻³ mol/dm3 solution. The TPA spectrum of compound 1 has already been reported for a chloroform solution.[Reference Makarov, Campo, Hales and Perry11] Therefore, a chloroform solution of compound 1 was used as the reference sample. An fs pulsed beam from an optical parametric amplifier (Spectra-Physics OPA-800C, Santa Clara, California), which was pumped by a regenerative amplifier (Spectra-Physics Spitfire), was used as the light source. The averaged incident power was 0.02–0.1 mW. The pulse duration was typically 150–200 fs and the repetition rate was 1 kHz. The incident beam was focused by a plano-convex lens (f = 80 mm), and the emitted fluorescence was detected with a liquid-nitrogen-cooled CCD (Princeton Instruments LN/CCD-1100PB, Trenton, New Jersey). We confirmed the quadratic dependence of fluorescence intensity on excitation laser power for all data points of TPA spectra. As exemplified in Supplementary Fig. S1, the slopes of log–log plots of two-photon-excited fluorescence intensities of compounds 1–3 against incident laser power at 1030 nm were 2.1, 2.1, and 2.0, respectively.
Chemical structures of hemicyanine dyes investigated in this study (compounds 1–3) and that of LDS-798.

One-photon fluorescence microscopy was performed with an IX-81 microscope (Olympus, Tokyo, Japan) equipped with a CCD camera (DP50, Olympus). Two-photon fluorescence microscopy images were observed using a specific microscope designed for fs fiber laser excitation. A galvano scanner (C10516, Hamamatsu Photonics, Shizuoka, Japan) was used as the laser-scanning unit. The beam was focused on samples through a water immersion objective (UApo 340 40X, Olympus). The fluorescence signal was detected by a photon counting head (H7421-40, Hamamatsu Photonics). As for the excitation light source, an Yb-doped fs fiber laser oscillating at 1030 nm (L12948, Hamamatsu Photonics) was employed. The pulse duration was typically 150 fs and the repetition rate was 40 MHz.
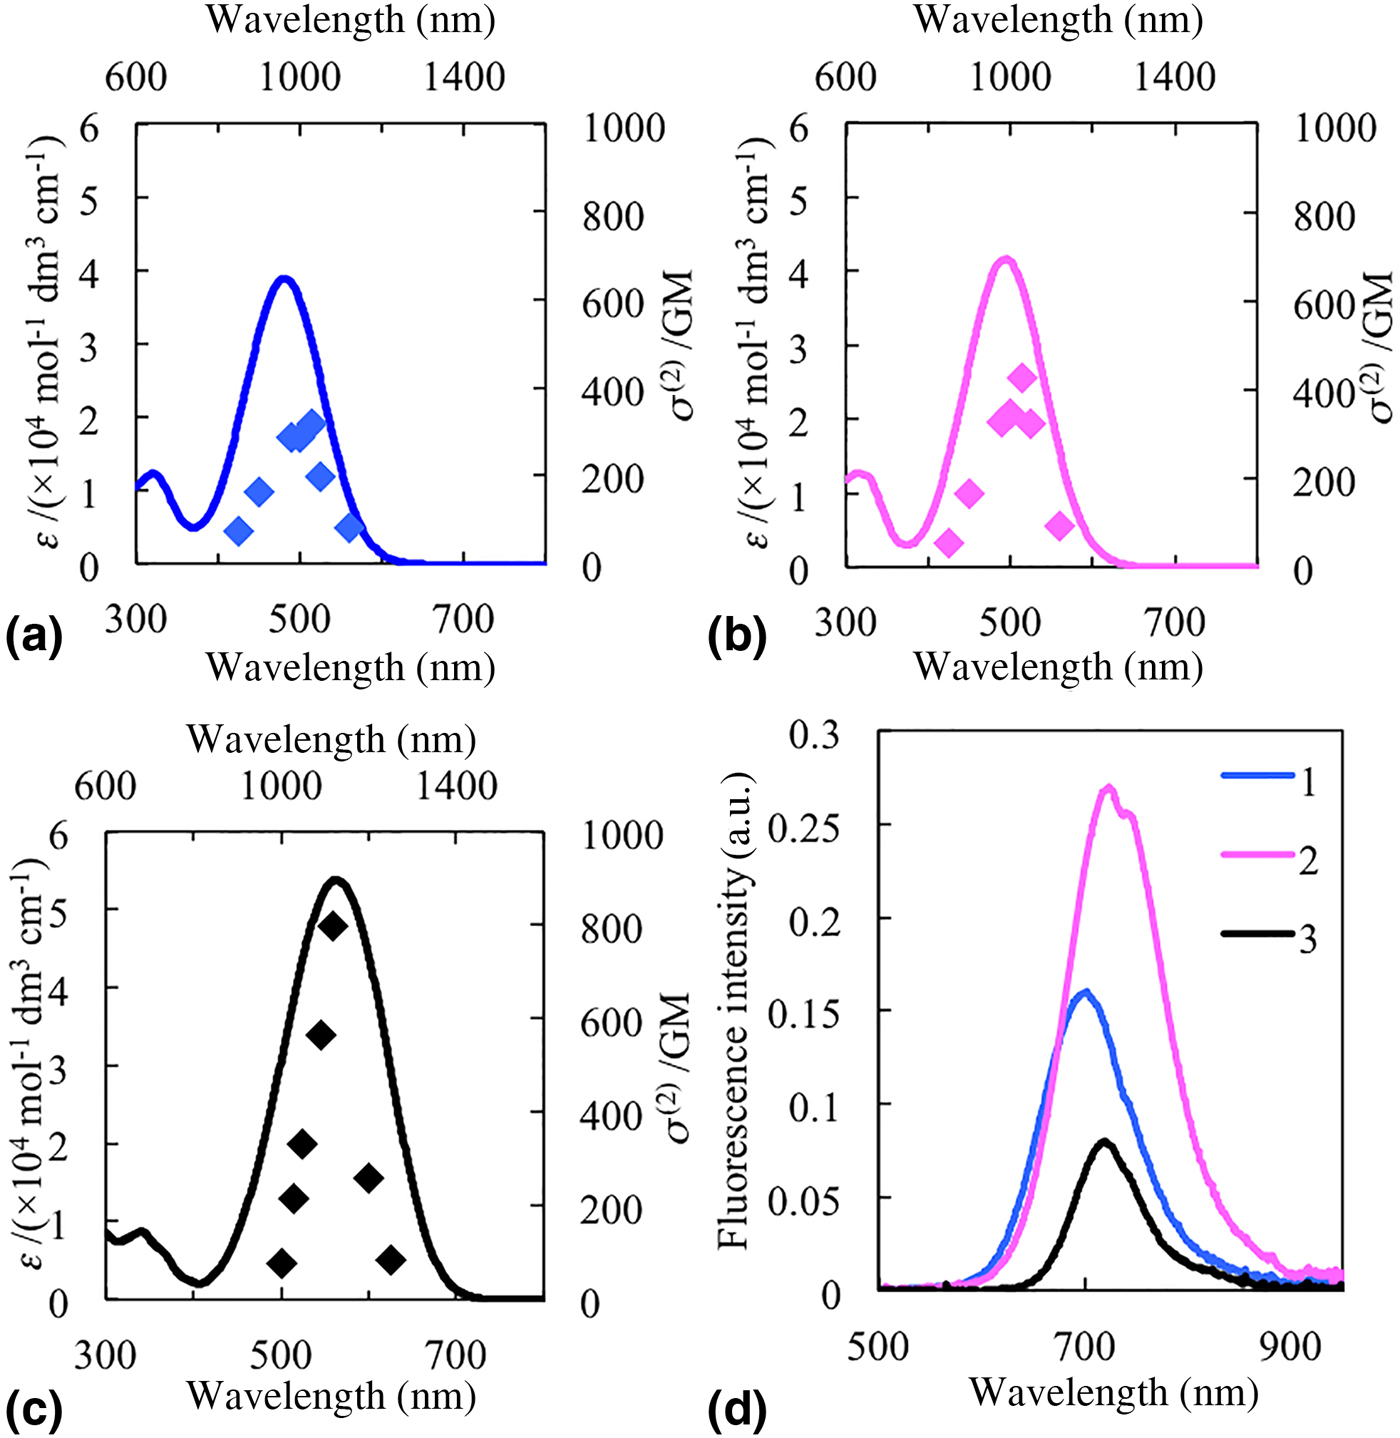
OPA and TPA spectra of compounds 1–3 are shown in Figs. 2(a)–2(c), respectively. OPA maxima, molar absorption coefficients (ε) at the OPA maxima, and the peak values of TPA cross-sections [σ (2)peak], σ (2) at 1030 nm are summarized in Table I. The OPA maximum of 2 at 494 nm was longer than that of 1 at 481 nm. Intramolecular charge transfer is known to be enhanced with the increment of distance between electron donor (D) and electron acceptor (A).[Reference Eisenthal12] The distance between D (dimethylamino group) and A (alkylpyridinium moiety) of compound 2 was longer than that of compound 1. Hence, the longer absorption maximum of compound 2 compared with that of compound 1 can be attributed to the difference in the location of the alkyl pyridinium moiety. The OPA maximum of compound 3 was 563 nm, which was longer than that of compounds 1 and 2. In addition, the molar absorption coefficient of compound 3 was larger than those of compounds 1 and 2. Introduction of a sulfur atom into the π-conjugated system is known to contribute to the red shift of the absorption band and to increasing the molar absorption coefficient of compounds.[Reference Dickey, Towne, Bloom, Moore, Smith and Hedberg13] The longer OPA maximum and larger value of the molar absorption coefficient of 3 were thought to reflect the effect of introducing a sulfur atom into the π-conjugate system.
One- (solid line, left vertical, and bottom axes) and two-photon absorption (markers, right vertical, and top axes) spectra of compounds 1(a), 2(b), and 3(c). Fluorescence spectra of a 1 × 10⁻⁶ mol/dm3 DMSO solution of compounds 1–3(d).

One- and two-photon absorption properties of compounds 1–3 in DMSO.

The wavelength regions of the TPA bands of each compound were almost double those of the OPA bands. These results suggest that the primary OPA allowed bands were also allowed for TPA transitions, which reflected the asymmetry of the molecular structures of compounds 1–3.[Reference Peticolas14] σ (2)peak of compounds 1–3 were 317, 427, and 889 GM (1 GM = 10−50 cm4 s/photon/molecule), respectively. According to the three-state model,[Reference Rumi, Ehrlich, Heikal, Perry, Barlow, Hu, McCord-Maughon, Parker, Röckel, Thayumanavan, Marder, Beljonne and Brédas15] which is often employed for explaining σ (2)peak of a variety of compounds,[Reference Ohta, Antonov, Yamada and Kamada16–Reference Moritomo, Nakagawa, Sugihara, Suzuki and Kawamata18] σ (2)peak is written as:
 $$\sigma _{{\rm peak}}^{(2)} {\rm \propto} \displaystyle{{ \vert \mu _{{\rm kg}} \vert ^2 \vert \mu _{{\rm ek}} \vert ^2} \over {\Delta E^2{\it \Gamma} _{{\rm eg}}}}E_{{\rm eg}},$$
where μ kg and μ ek are the transition dipole moment from the ground state (g) to the lowest OPA-allowed level (k), and from k to the lowest TPA-allowed state, respectively. E eg is the energy gap between g and e, Γ eg is a damping factor, and ΔΕ is the resonance term called the detuning energy, which is equal to the difference between the energy gap from g to k and the photon energy of the two-photon excitation. The value of μ kg2 is proportional to the oscillator strength (f) of the OPA band. Because there is no means for predicting μ ek, the relation of μ kg ∝ μ ek or  $\sigma _{{\rm peak}}^{(2)} \propto f^2$ was assumed, as is conventionally done for the case of organic compounds. When ε was approximated to be proportional to f, f of compounds 2 and 3 were estimated to be 1.08 and 1.38 times larger than that of compound 1. The squares of the ratio of f were calculated to be 1.16 and 1.92, respectively, while the corresponding ratios of the observed σ (2) were 1.35 and 2.51, respectively. The absolute ratios were not always quantitatively consistent with the three-state model. The most probable reason of this discrepancy was attributed to the rough approximation. However, the ordering of σ (2) was consistent with a consideration of the three-state model.
σ (2)peak of compound 1 in DMSO (317 GM) was smaller than the reported value of 395 GM in chloroform.[Reference Makarov, Campo, Hales and Perry11] This discrepancy can also be explained by the three-state model. ε of compound 1 in DMSO was 39000/mol dm3/cm, whereas the value in chloroform was 42,000/mol dm3/cm. By assuming that the relationship between e and f was linear, the σ (2)peak of compound 1 in DMSO was estimated to be 0.86 times that in chloroform. The estimated ratio was consistent with the observed ratio of 0.80.
Among the compounds examined in this study, the largest σ (2)peak of 889 GM at 1120 nm was observed for compound 3. However, the σ (2) of compound 3 at 1030 nm was only 241 GM. σ (2)peak of compounds 1 and 2 were 317 and 427 GM, respectively. Thus, the compound that exhibited the largest σ (2) at 1030 nm was found to be compound 2.
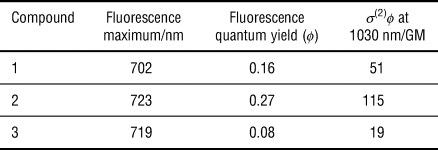
The fluorescence spectra of compounds 1–3 are shown in Fig. 2(d). Table II summarizes the fluorescence maxima, fluorescence quantum yields, and the products of σ (2) at 1030 nm and the fluorescence quantum yield [σ (2)ϕ, which indicates the efficiency of two-photon-induced fluorescence at 1030 nm]. For compounds 1–3, the fluorescence maxima were 702, 723, and 719 nm and the quantum yields were 0.16, 0.27, and 0.08, respectively. The σ (2)ϕ of compounds 1–3 at 1030 nm were 51, 115, and 19.0, respectively. Owing to the large σ (2) at 1030 nm and the large quantum yield of compound 2, compound 2 exhibited the largest σ (2)ϕ at 1030 nm. Thus, it was expected that compound 2 should be the most efficient two-photon dye for use in fiber laser excitation two-photon microscopy.
Fluorescence properties of a 1 × 10⁻⁶ mol/dm3 DMSO solution of compounds 1–3.

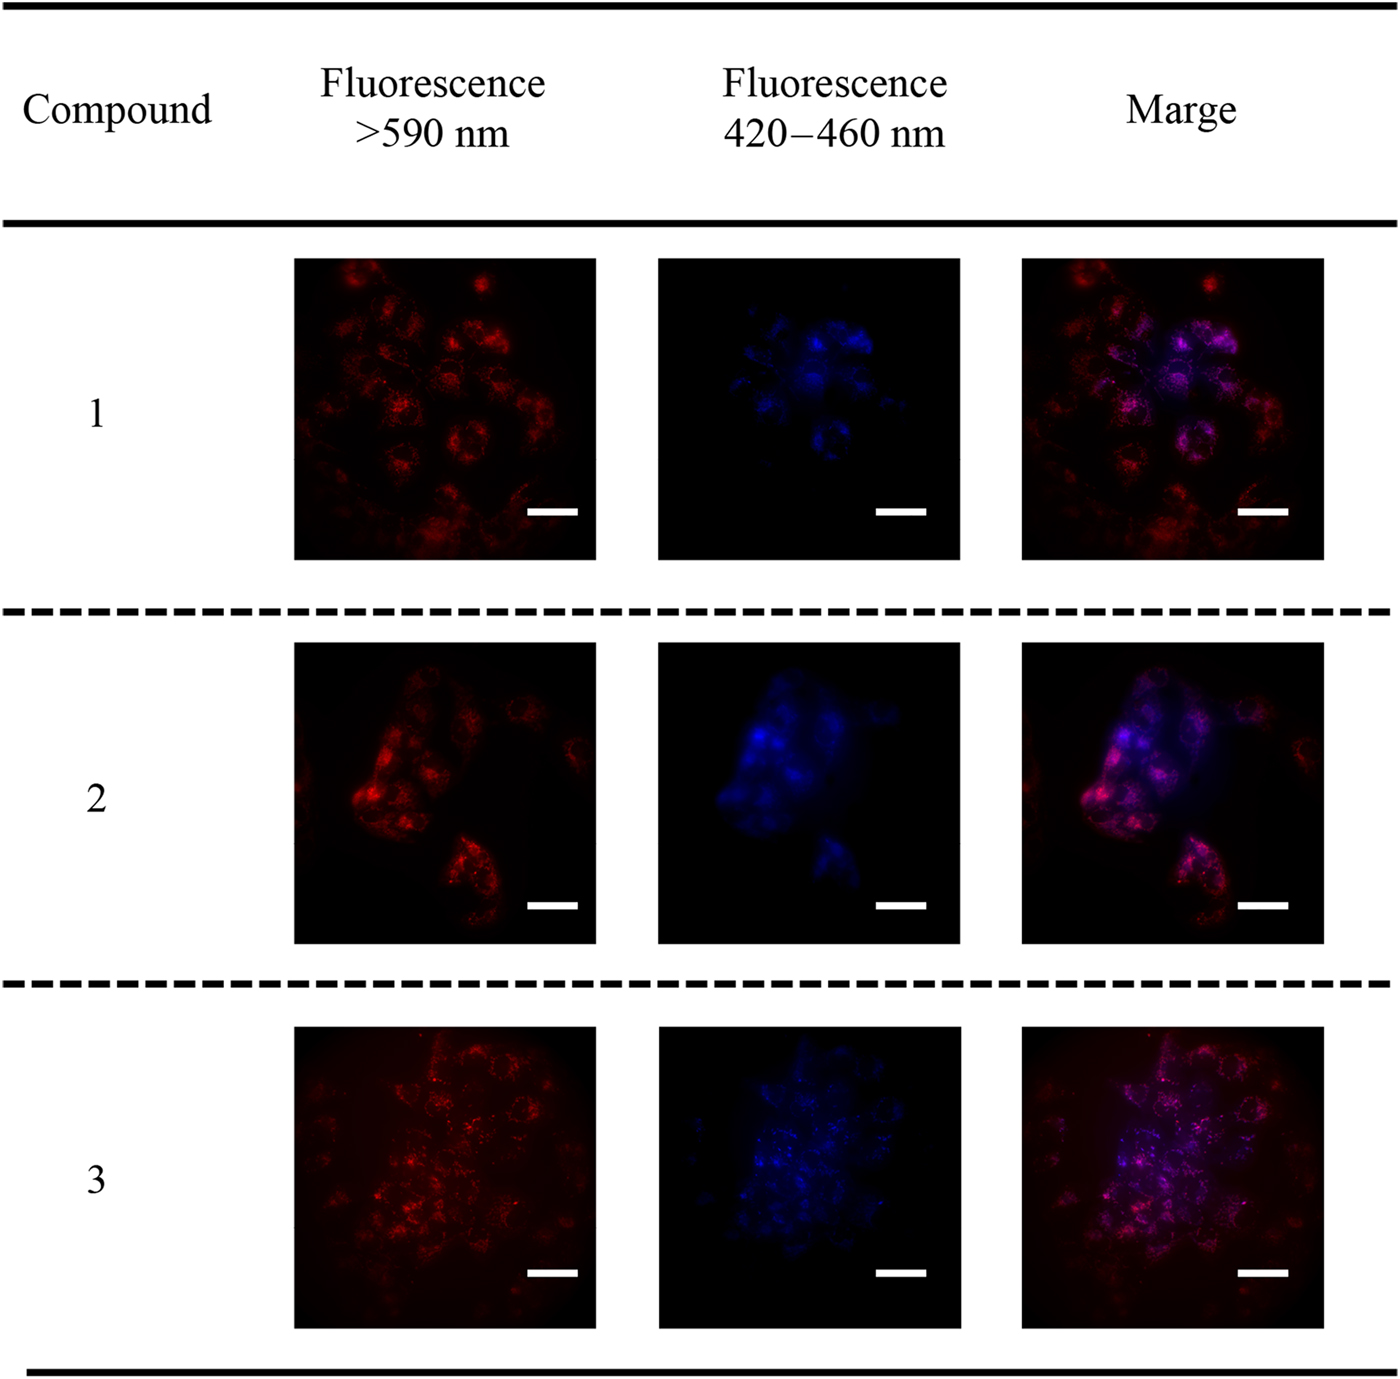
As described above, compounds 1–3 are expected to localize in mitochondria. To characterize the localization behavior of compounds 1–3, we conducted co-staining experiments using a mitochondrion-selective probe [1,1′-dimethyl-4,4′-(2,6-naphthalediyl)dipyridinium diiodide; NPJ]. We confirmed NPJ localized at mitochondria through co-staining experiments with Mitotracker Red.[Reference Onishi, Asamura, Seki, Niko, Tani, Kawamata and Suzuki19] The fluorescence microscopy images obtained using a one-photon fluorescence microscope are shown in Fig. 3. Red (excitation filter 510–550 nm, longpass filter 590 nm) and blue (excitation filter 360–370 nm, bandpass filter 420–460 nm) channels were used for the detection of fluorescence from compounds 1 to 3 and NPJ, respectively. The merged image revealed that the structure stained with compounds 1–3 were very similar to that stained with NPJ. Thus, it was confirmed that compounds 1–3 were localized at mitochondria in HEK293 cells.
One-photon fluorescence microscopy images of HEK293 cells stained with compounds 1–3 and a mitochondrian-selective probe, 1,1′-dimethyl-4,4′-(2,6-naphthalediyl)dipyridinium diiodide. Left images are obtained by using the red channel (excitation filter 510–550 nm, longpass filter 590 nm). Center images are obtained by using the blue channel (excitation filter 360–370 nm, bandpass filter 420–460 nm). Right images are the merged images of both channels. Scale bar is 20 µm.

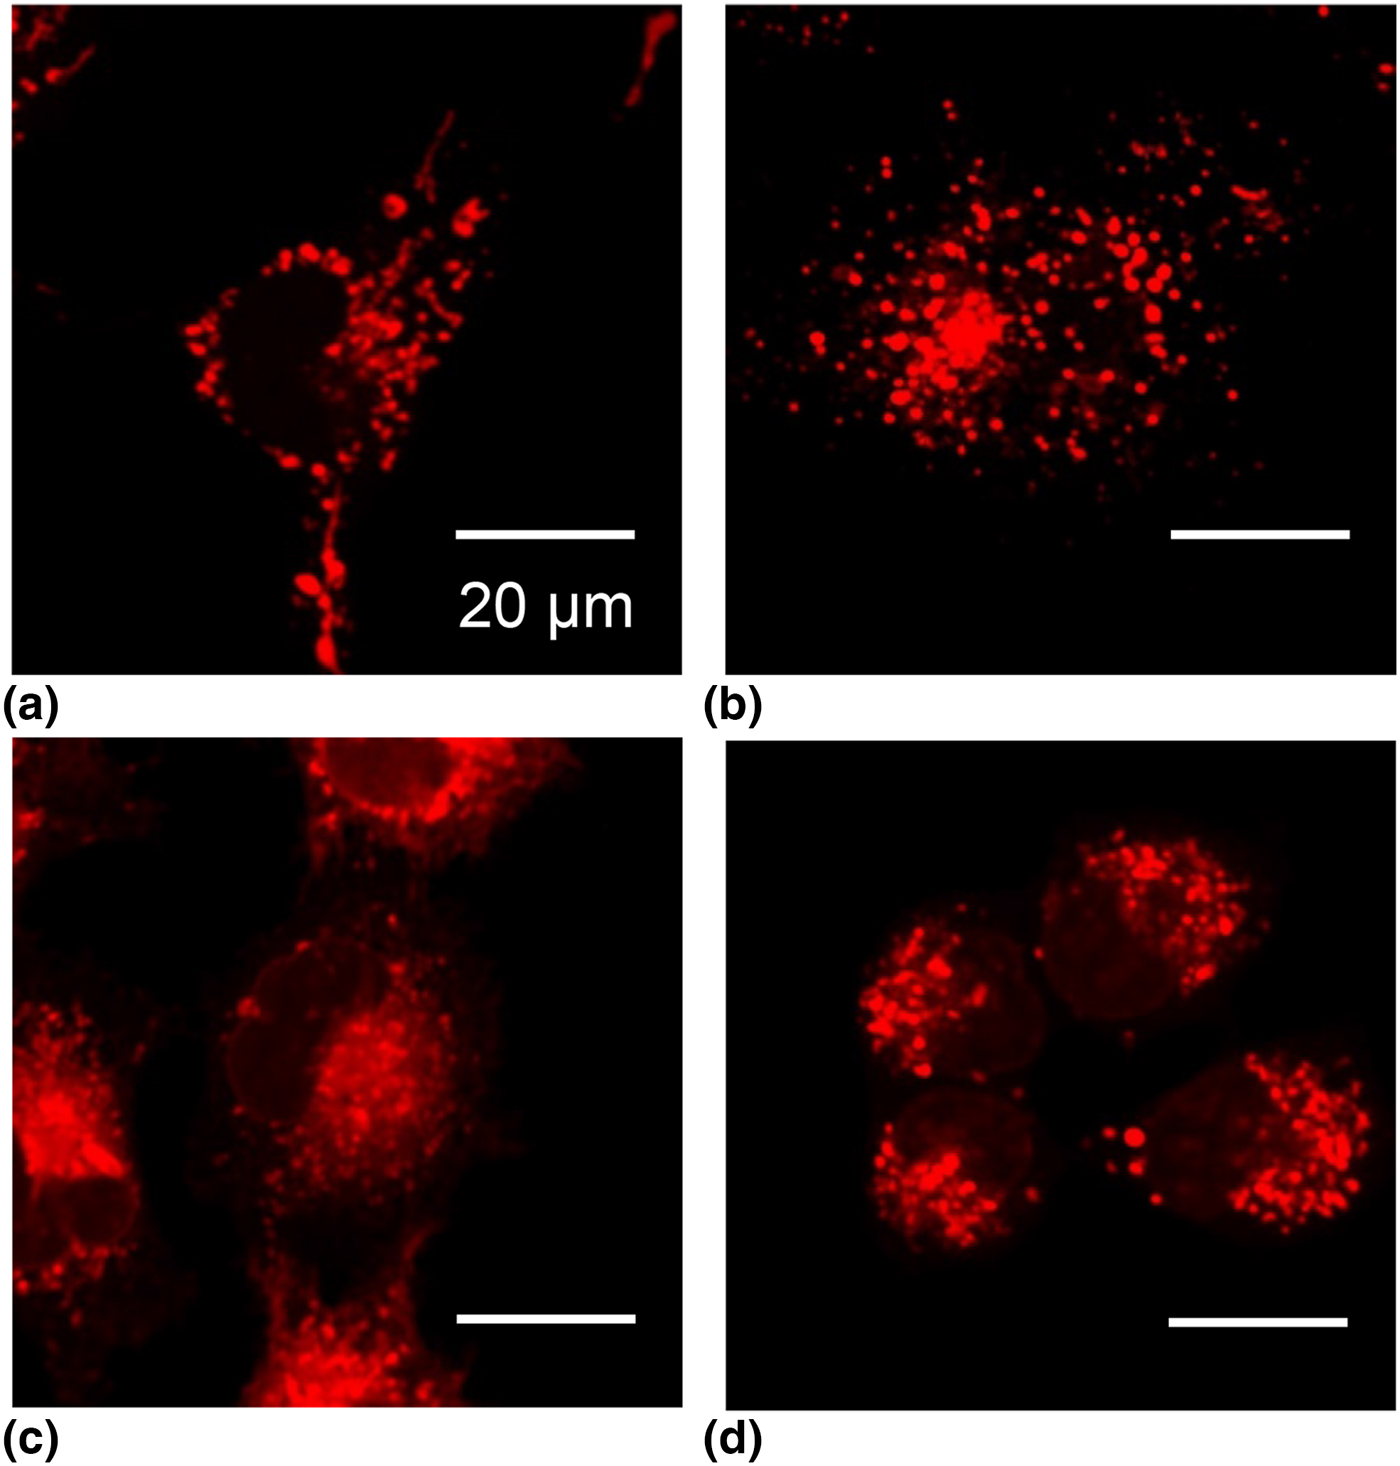
Two-photon fluorescence microscopy images of HEK293 cells stained with compounds 1–3 are shown in Figs. 4(a)–4(c), respectively. For comparison, the image obtained from staining HEK293 cells with LDS-798 is also shown in Fig. 4(d). As for the excitation light source, an fs fiber laser was employed. Clear two-photon fluorescence microscopy images of the mitochondria in HEK293 cells were obtained in all cases. The laser power after the objective that was required to obtain similar brightness images were 5, 3, 10, and 10 mW for compounds 1, 2, 3, and LDS-798, respectively. The required laser power corresponded to the order of σ (2)ϕ at 1030 nm, as summarized in Table II. We estimated the σ (2)ϕ value at 1030 nm of LDS-798 to be 9.0 GM. Owing to the large σ (2)ϕ of compound 2, the required power was indeed small when compound 2 was employed as the fluorescent probe. The laser power of 3 mW (in our set up, the intensity at the focal point was calculated to be 0.35 MW/cm2) was comparable to the other studies that have realized low-power two-photon excitation imaging.[Reference Tominaga, Mochida, Sugihara, Satomi, Moritomo, Fuji, Tomoyuki, Suzuki and Kawamata7] It should be noted here that the phototoxicity expected by excitation at 1030 nm has been reported to be lower than the case with excitation at a shorter wavelength such as 800 nm.[Reference Icha, Weber, Waters and Norden20] In fact, no cell abnormality was observed throughout the process of two-photon imaging.
Two-photon fluorescence microscopy images of HEK293 cells stained with compounds 1–3 and LDS-798; (a), (b), (c), and (d) correspond to compounds 1, 2, 3, and LDS-798, respectively.

The use of an fs fiber laser as the excitation light source for two-photon microscopy is expected to realize minimally invasive deep tissue imaging. As described, when compound 2 was employed, the excitation and fluorescence wavelengths were 1030 and 719 nm, respectively. Both wavelengths are within the wavelength region called the “tissue optical window (650–1300 nm)”, where the transparency of light in living tissues or organs is high.[Reference Weissleder21] Thus, employment of a low-power fs fiber laser for excitable near-infrared fluorescence compound 2 as a two-photon probe should realize minimally invasive deep tissue imaging.
In this study, we investigated the TPA characteristics of three hemicyanine dyes. All dyes investigated in this study exhibited two-photon-induced fluorescence when excited by an fs fiber laser. The value of σ (2)ϕ at 1030 nm of compound 2 was the largest among the compounds investigated in this study. Thus, hemicyanine dyes, especially compound 2, should be efficient TPA probes. All hemicyanine dyes were found to localize at mitochondria in HEK293 cells. When compound 2 was employed as a probe, a clear two-photon microscopy image was observed even when an fs fiber laser beam of 3 mW was used. Thus, it was concluded that compound 2 is a suitable fluorescent probe for fs fiber laser excitation two-photon imaging and provides an opportunity to realize highly sensitive, minimally invasive deep tissue imaging.
Acknowledgments
This work was supported by JSPS KAKENH (No. 15K17845, No. 16H04134, No. 17H05466). The authors thank Edanz Group (www.edanzediting.com/ac) for editing a draft of this manuscript.
Supplementary material
The supplementary material for this article can be found at https://doi.org/10.1557/mrc.2018.143