1. Introduction
The genesis of mafic magma in both interplate and intraplate areas is a key concern in igneous petrology. Mafic magmas are generated as a result of (i) rise of local geothermal gradient by physical convection, (ii) subsequent lowering of solidus by influx of volatile constituents or by (iii) localized spike in geothermal gradient (frictional heating) due to tectonic conditions (Wyllie, Reference Wyllie1988). Mafic magmas also undergo fractional crystallization and crustal contamination, which facilitates change in their chemical composition (Rollinson, Reference Rollinson1993; Pe-piper et al. Reference Pe-piper, Matarangas, Reynolds and Chatterjee2003). Variations in the trace element and isotopic abundances in the mafic magmas point to geochemically distinct sources in the mantle (Wyllie, Reference Wyllie1988). The presence or absence of incompatible/mobile trace elements and high/low isotopic signatures in the melt can define a source as enriched or depleted (Pearce & Norry, Reference Pearce and Norry1979; Anderson, Reference Anderson1995). Melts from the depleted reservoir are mostly prominent at spreading ridges. On the other hand, it is suggested that enriched magmas are most evident in infant subduction zones, new rifting regions and intraplate environments away from spreading ridges (Anderson, Reference Anderson1995). Therefore, geochemical studies of mafic igneous rocks can provide insights into the processes of generation of mafic magmas from mantle, magma evolution and related tectonic setting.
The Indian subcontinent is endowed with mafic magmatic bodies emplaced over a wide range of time intervals from the Archaean belts of south India to the Cretaceous-Tertiary Deccan basalt sequences (Watts & Cox, Reference Watts and Cox1989; Ahmad & Tarney, Reference Ahmad and Tarney1991). Imprints of mafic magmatism are observed in all the Precambrian cratonic blocks of the Indian shield (Ray et al. Reference Ray, Saha, Koeberl, Thoni, Ganguly and Hazra2013). Numerous mobile belts separate these cratonic blocks. Among the prominent mobile belts, the Central Indian Tectonic Zone (CITZ) is an E-W striking belt, extending eastward through the Chotanagpur Granite Gneiss Complex (CGGC) to the Assam-Meghalaya Gneissic Complex (AMGC) (Acharyya, Reference Acharyya2001). The AMGC of northeastern India comprises a variety of rock types including migmatitic gneisses, metasedimentary rocks, mafic magmatic rocks and several granitoid plutons. It is considered that thermal disturbances in the upper mantle initiated rifting within the AMGC resulting in the formation of a basin now known as the Shillong Basin. Subsequent sedimentation within this basin resulted in the formation of the Shillong Group of metasedimentary rocks (Bhattacharjee & Rahman, Reference Bhattacharjee and Rahman1985). A group of mafic intrusives (i.e. metadolerites) are found within the Shillong Group of rocks. These intrusives are considered evidence of subduction-related mafic magmatism in the AMGC (Ray et al. Reference Ray, Saha, Koeberl, Thoni, Ganguly and Hazra2013). Stratigraphically, they have been classified as the Khasi greenstones (Mazumder, Reference Mazumder1986; Srinivasan et al. Reference Srinivasan, Sen and Bandopadhyay1996).
Studies on mafic rocks from different parts of the CITZ have been carried out by various researchers (Ghosh et al. Reference Ghosh, Fallick, Paul and Potts2005; Kumar & Ahmad, Reference Kumar and Ahmad2007; Ghose & Chatterjee, Reference Ghose, Chatterjee, Srivastava, Sivaji and Chalapathi Rao2008; Srivastava & Ahmad, Reference Srivastava and Ahmad2008; Ahmad & Wanjari, Reference Ahmad and Wanjari2009; Srivastava, Reference Srivastava2012; Alam et al. Reference Alam, Choudhary, Mouri and Ahmad2017; Ahmad et al. Reference Ahmad, Paul, Negi, Akhtar, Gogoi and Saikia2021). However, work on its easternmost extension, that is, the AMGC, is limited. Even though some amount of work has been done on the Proterozoic mafic rocks (i.e. Khasi greenstone) of the Khasi Hills in Meghalaya (Hazra & Ray, Reference Hazra and Ray2009; Mallikharjuna et al. Reference Mallikharjuna Rao, Poornachandra Rao and Sarma2009; Ray et al. Reference Ray, Saha, Koeberl, Thoni, Ganguly and Hazra2013), very few reports exist on the mafic rocks of the Mikir Massif in Assam. This paper focuses on the Proterozoic mafic rocks (metadolerites) of the Mikir Massif. Petrological studies on the basis of field relationships, petrography, mineral compositional analyses with electron probe micro-analyser and geochemistry with major and trace element data are being carried out to give a detailed overview of the genesis of these rocks and their tectonic setting. Inferences of the study will elucidate the formation of the Proterozoic Shillong Basin.
2. Geological setting
The CITZ is an ENE–WSW-trending Proterozoic mobile belt which divides the Greater Indian Landmass into two crustal provinces, viz. Northern Indian Block and Southern Indian Block (Acharyya, Reference Acharyya2003). The Mahakoshal Mobile Belt (MMB) occupies the northern region of the CITZ, while the southern belt of the CITZ consists of the Sausar Mobile Belt, the CGGC and the AMGC. The Bathani volcano-sedimentary sequence (BVSs) is a volcano-sedimentary suite located in the northern fringe of the CGGC and is the eastern continuation of the MMB. Bora et al. (Reference Bora, Kumar, Yi, Kim and Lee2013) attained a U–Pb SHRIMP zircon 206Pb/238U age of 1753 ± 9 Ma, and Yadav et al. (Reference Yadav, Ahmad, Kaulina and Bayanova2015) reported a U–Pb ID-TIMS zircon age of 1873 ± 13 Ma from the calc-alkaline granitoids of MMB. Chatterjee & Ghose (Reference Chatterjee and Ghose2011) obtained a 1697±17 Ma monazite crystallization age from the porphyritic granites of northern CGGC close to BVSs. Saikia et al. (Reference Saikia, Gogoi, Kaulina, Lialina, Bayanova and Ahmad2017, Reference Saikia, Gogoi, Ahmad, Kumar, Kaulina and Bayanova2019) reported a U–Pb ID-TIMS ages of ca. 1700–1600 Ma and a Rb-Sr whole rock isochron age of 1664 ± 130 Ma for the granites of BVSs.
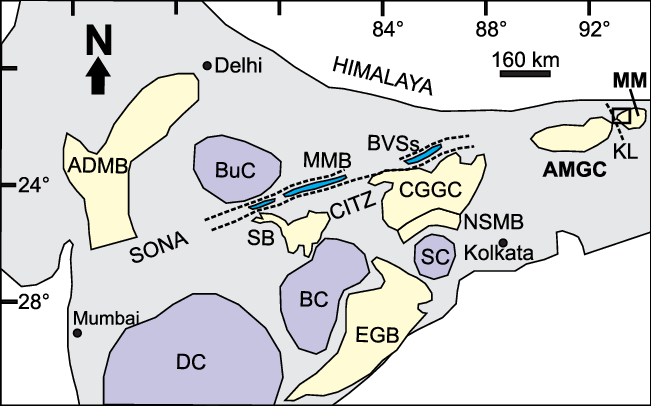
The AMGC is the lone illustration of the Proterozoic gneissic basement rocks in Northeast India. This area is tectonically disconnected from mainland India by the Garo-Rajmahal depression (Eremenco et al. Reference Ermenco, Negi, Nasianov, Seregin, Despande, Sengupta, Talukdar, Sastri, Sokaluv, Pavbukov, Dutta and Raju1969). The AMGC is also flanked by two subduction zones, viz. (i) the Indian Plate subducted beneath the Burmese Plate to its southeast and (ii) Indian Plate subducted beneath the Eurasian Plate to its north. This seismically and geodynamically active area is suggested to be the eastern extension of the Chotanagpur Granite Gneissic Complex (Desikachar, Reference Desikachar1974). This sector is restricted dominantly in the states of Meghalaya and Assam in Northeast India. The Mikir Massif is separated from the Meghalaya part of AMGC by the NW-SE-trending Kopili lineament (Fig. 1). The NE-SW-trending Mesoproterozoic Shillong Basin occupies the northwestern part of Mikir Massif.
Tectonic map of India showing the location of Mikir Massif (MM) along with the Archean cratons and Proterozoic mobile belts (modified after Chatterjee & Ghose, Reference Chatterjee and Ghose2011). The study area is shown within the black square. Abbreviations: ADMB, Aravalli Delhi Mobile Belt; AMGC, Assam-Meghalaya Gneissic Complex; BC, Bastar Craton; BuC, Bundelkhand Craton; BVSs, Bathani volcano-sedimentary sequence; CGGC, Chotanagpur Granite Gneiss Complex; CITZ, Central Indian Tectonic Zone; DC, Dharwar Craton; EGB, Eastern Ghats Belt; KL, Kopili Lineament; MMB, Mahakoshal Mobile Belt, MM, Mikir Massif; NSMB: North Singhbhum Mobile Belt; SB, Satpura Belt; SC, Singhbhum Craton; SONA, Son-Narmada lineaments.

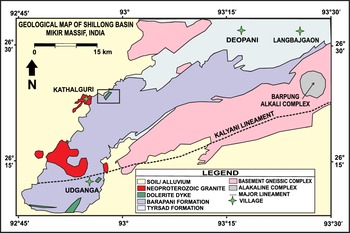
Lithologically, the AMGC comprises basement gneissic complex, amphibolites, migmatites, calc-silicate rocks, granulites, Shillong Group of metasedimentary rocks and Mesozoic-Tertiary igneous and sedimentary rocks (Nandy, Reference Nandy2001; Srivastava & Sinha, Reference Srivastava and Sinha2004). The Shillong Group of rocks is divided into two formations, viz. the Lower Metapelitic Formation and the Upper Quartzitic Formation. The Shillong Group of rocks unconformably overlies the basement gneissic complex (Nandy, Reference Nandy2001; Srivastava & Sinha, Reference Srivastava and Sinha2004). Several discordant granitoid plutons (500–700 Ma) are found intruded within the basement gneissic complex as well as the Shillong Group of rocks (Ghosh et al. Reference Ghosh, Bhalla, Paul, Sarkar, Bishui and Gupta1991; Kumar, Reference Kumar1990). Moreover, Gogoi et al. (Reference Gogoi, Majumdar, Cottle and Dutta2019) reported an LA-inductively coupled plasma mass spectrometry (ICP-MS) U–Pb zircon age of 1644 ± 33 Ma, 1599 ± 17 Ma and 1550 ± 25 Ma from the porphyritic granites of Shillong Basin in the Mikir Massif. Metadolerites occur as concordant and discordant bodies within the Shillong Group (Fig. 2) and are referred to as Khasi greenstone (Mazumder, Reference Mazumder1986). These Khasi greenstones had been subjected to low-grade metamorphism (Srinivasan et al. Reference Srinivasan, Sen and Bandopadhyay1996).
Regional geological map of Mikir Massif showing the study area within the black box (modified after Dhurandhar et al. Reference Dhurandhar, Pandey and Raminaidu2019).

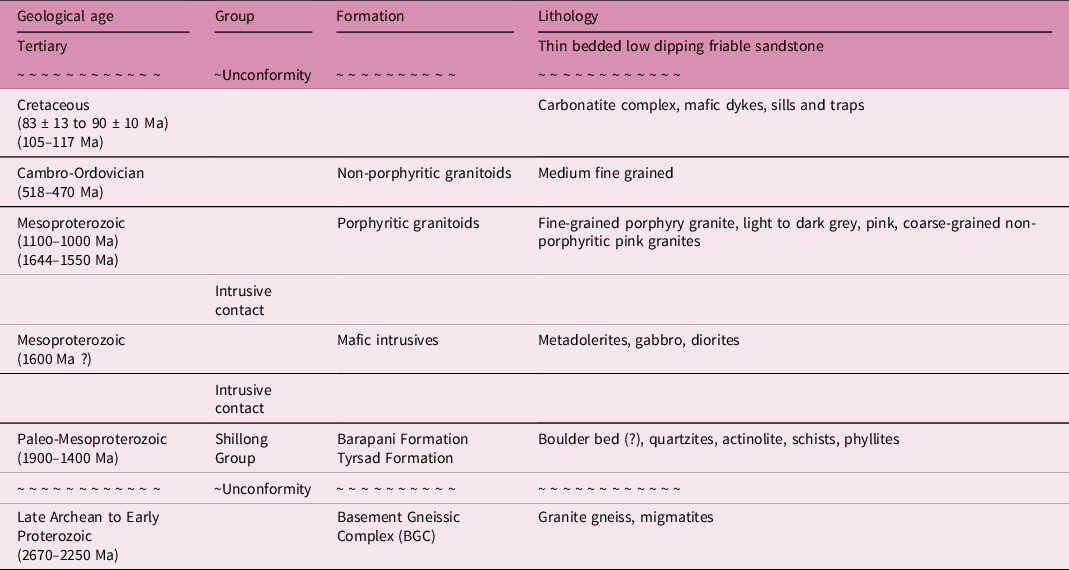
The major lithological components of the Mikir Massif consist of amphibolites, sillimanite-bearing gneisses, granulites, banded iron formation and granite gneisses (Ghosh et al. Reference Ghosh, Fallick, Paul and Potts2005; Gogoi et al. Reference Gogoi, Majumdar, Cottle and Dutta2019). The Shillong Group of rocks in Mikir Massif is illustrated by low-grade schists such as quartz sericite, garnetiferous and ferruginous schists, quartzite, conglomerate and cross-bedded arenites (Dhurandhar et al. Reference Dhurandhar, Pandey and Raminaidu2019), although the Mikir Massif is similar in lithology to the Meghalaya part of AMGC but it differs in the metamorphic grade. A generalized stratigraphic succession of the Mikir Massif is presented in Table 1. The present study is carried out near the Borjuri village of Assam in Northeast India. Here, metadolerites related to the Khasi greenstone are found to be in contact with quartzites of the Shillong Group. These mafic bodies are exposed at a number of places within the Shillong Group of rocks. However, due to very thick vegetation, it is difficult to undertake field investigations in our study area. The present study has been carried out at a large quarry site near the Borjuri village spreading across an area of about 2 sq km (Fig. 2).
A generalized stratigraphic succession of Mikir Massif (after Awati et al. Reference Awati, Harikrishnan, Sinha, Gupta and Gupta1995; Majumdar & Gogoi, Reference Majumdar and Gogoi2020)

?No absolute age is available for the metadolerites of the Shillong Basin. The age of these rocks are estimated from palaeomagnetic investigations and age of other rock associations from the Shillong Basin.
3. Field relationships
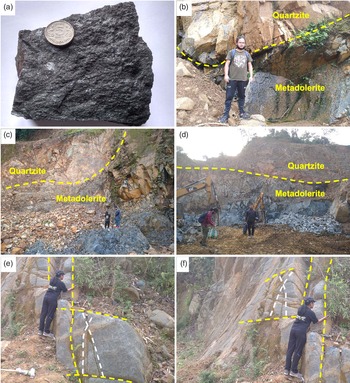
The Proterozoic mafic intrusives occur in the northwestern domain of the Mikir Massif near the Borjuri village of Nagaon district, Assam. These mafic rocks are basically melanocratic metadolerites (Fig. 3a). The metadolerites share sharp contacts with the quartzitic rocks of the Shillong Group (Fig. 3b-d). The metadolerites show variation in grain size. The rocks are relatively finer towards contact with the quartzites. The metadolerites and the metasedimentary quartzite sequence in the study area have a regional trend of NE-SW and a regional dip towards SE. The area is highly jointed and consists of two sets of prominent joints. The dominant regional joints are systematic, closely spaced joints striking N45°E. The regional joints are crisscrossed by another set of joints at a higher angle striking N30°W. A set of conjugate joints are also seen sporadically in the area (Fig. 3e, f).
Field photographs showing (a) a metadolerite hand specimen. (b–d) Quartzites of the Shillong Group share sharp contacts with the metadolerites or Khasi greenstones. (e, f) Closely spaced vertical joints crisscrossed by another set of joints at a higher angle (shown by yellow lines) and a set of conjugate joints (shown by white lines) were observed in metadolerites.

4. Analytical methods
Mineral chemical analyses of the metadolerites were performed on polished thin-sections using a CAMECA SX 100 electron microprobe at Electron Microprobe Analyser Laboratory, Geological Survey of India, Faridabad (India). The analyses were carried out using an acceleration voltage of 15 kV and beam current of 10 nA with a beam diameter of ca. 1 μm. Standards used include periclase for Mg, wollastonite for Si and Ca, albite for Na, rhodonite for Mn, orthoclase for K, corundum for Al, apatite for P, hematite for Fe, metallic chromium and titanium for Cr and Ti, halite for Cl, metallic zinc for Zn, fluorite for F and barite for Ba. The error in major element concentrations is <1%, whereas the error on trace elements varied between 3 and 5%. For all the elements, Kα lines were analysed with a peak counting time of 10 s and a background counting time of 5 s. The corrections applied to the raw data were that of Pouchou and Pichoir (PAP) procedure (Pouchou & Pichoir, Reference Pouchou, Pichoir, Brown and Packwood1987).
The major oxides, trace elements and rare earth element (REE) analyses were carried out at the Wadia Institute of Himalayan Geology, Dehradun (India). Major oxides and selected trace elemental analyses were performed using a Bruker S8 Tiger Sequential X-ray Spectrometer with Rh excitation source, following the processes explained by Saini et al. (Reference Saini, Mukherjee, Rathi and Khanna2000). The operating conditions for major oxides were no filter, vacuum path and 20/40 kV; for trace elements, they were no filter, vacuum path and 55/60 kV. For major and minor oxides, the overall accuracy in relative standard deviation (RSD) percentage is <5%; for trace elements, it is <12%. The average precision is better than 2% (Saini et al. Reference Saini, Mukherjee, Rathi, Khanna and Purohit2007). The ICP-MS analyses of the REEs were done using the equipment PerkinElmer SCIEX quadrapole type ICP-MS, ELAN DRC-e. For REE analysis, sample solutions were introduced into the argon plasma by means of a peristaltic pump and a cross flow nebulizer. Sample digestion and preparation of solutions were carried out following the procedures of Balaram et al. (Reference Balaram, Saxena, Manikyamba and Ramesh1990). To minimize matrix effect, United States Geological Survey (BHVO-1, AGV-1) and Geological Survey of Japan (JB1-a, JP-1) samples were used as rock standards. RSD for most of the samples is better than 10%.
5. Results
5.a. Petrography
Petrographically, the metadolerites can be divided into medium-grained and coarse-grained varieties. However, mineralogically they are similar and dominantly consist of amphibole, biotite, plagioclase and minor amounts of chlorite, apatite, titanite and Fe-oxides. Amphibole, plagioclase and biotite were analysed by an electron microprobe to determine their compositions. Representative mineral chemical analyses of these minerals are presented in Supplementary Tables S1, S2 and S3.
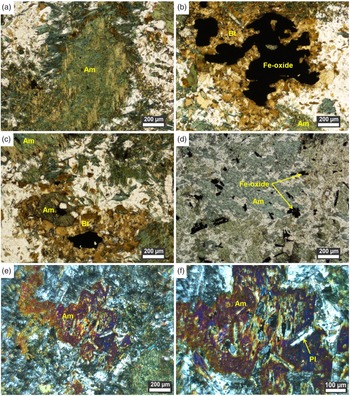
The amphiboles are basically secondary phases after pyroxene and are medium to coarse-grained having an elongated prismatic habit and some occur as anhedral masses as well (Fig. 4a). On the amphibole classification diagram (Hawthorne et al. Reference Hawthorne, Oberti, Harlow, Maresch, Martin, Schumacher and Welch2012), the amphiboles plot in the field of magnesio-hornblende and pargasite (Supplementary Fig. S1). Hence, the amphiboles can be classified as calcic-amphiboles. The Ca content of the amphiboles ranges from 1.57 to 1.95 apfu (atom per formula unit), Aliv varies from 1.49 to 1.72 apfu, (Na+K)A from 0.42 to 0.62 apfu and Mg# ranges from 0.37 to 0.42. The biotite grains are brown-coloured tabular crystals showing mottled birds-eye extinction (Fig. 4b, c). On the biotite classification diagram (Tischendorf et al. Reference Tischendorf, Gottesmann, Förster and Trumbull1997), the biotites are classified as Fe-biotites (Supplementary Fig. S2). The Si value of biotite ranges from 6.28 to 7.10 apfu, total Al abundance ranges from 1.35 to 1.50 apfu and Fe+Mg values ranges from 2.45 to 2.70 apfu. On the FeO+MnO–MgO–10TiO2 ternary diagram (Nachit et al. Reference Nachit, Ibhi and Ohoud2005), the analysed biotite crystals distinctly plot within the re-equilibrated biotite field (Supplementary Fig. S3), which suggests that biotite crystals in the studied rocks are secondary in nature. The plagioclase crystals generally occur as medium-grained, lamellar-twinned lath-shaped crystals. The analysed plagioclase grains are of oligoclase and andesine composition (An21 to An32) (Supplementary Fig. S4). Minor acicular apatite grains and anhedral Fe-oxides occur as discrete mineral phases in the section (Fig. 4d).
Representative photomicrographs of the metadolerites illustrating the mineral assemblages (a) plane-polarized light (PPL) images of secondary amphibole, (b, c) amphibole, biotite and Fe-oxide, (d) amphibole and Fe-oxide and (e, f) cross-polarized light (CPL) images of plagioclase laths embedded within secondary amphibole. Mineral abbreviations: Am, amphibole; Bt, biotite; Pl, plagioclase.

Both the coarse-grained and medium-grained metadolerites show inequigranular, holocrystalline texture. Primarily, plagioclase laths are embedded within amphibole grains, which resemble an ophitic texture (Fig. 4e, f). There is a possibility that the amphiboles present are secondary minerals formed by the transformation from pre-existing pyroxene grains. This suggests that the mafic rocks have been influenced by metamorphism leading to the formation of secondary amphiboles.
5.b. Geochemistry
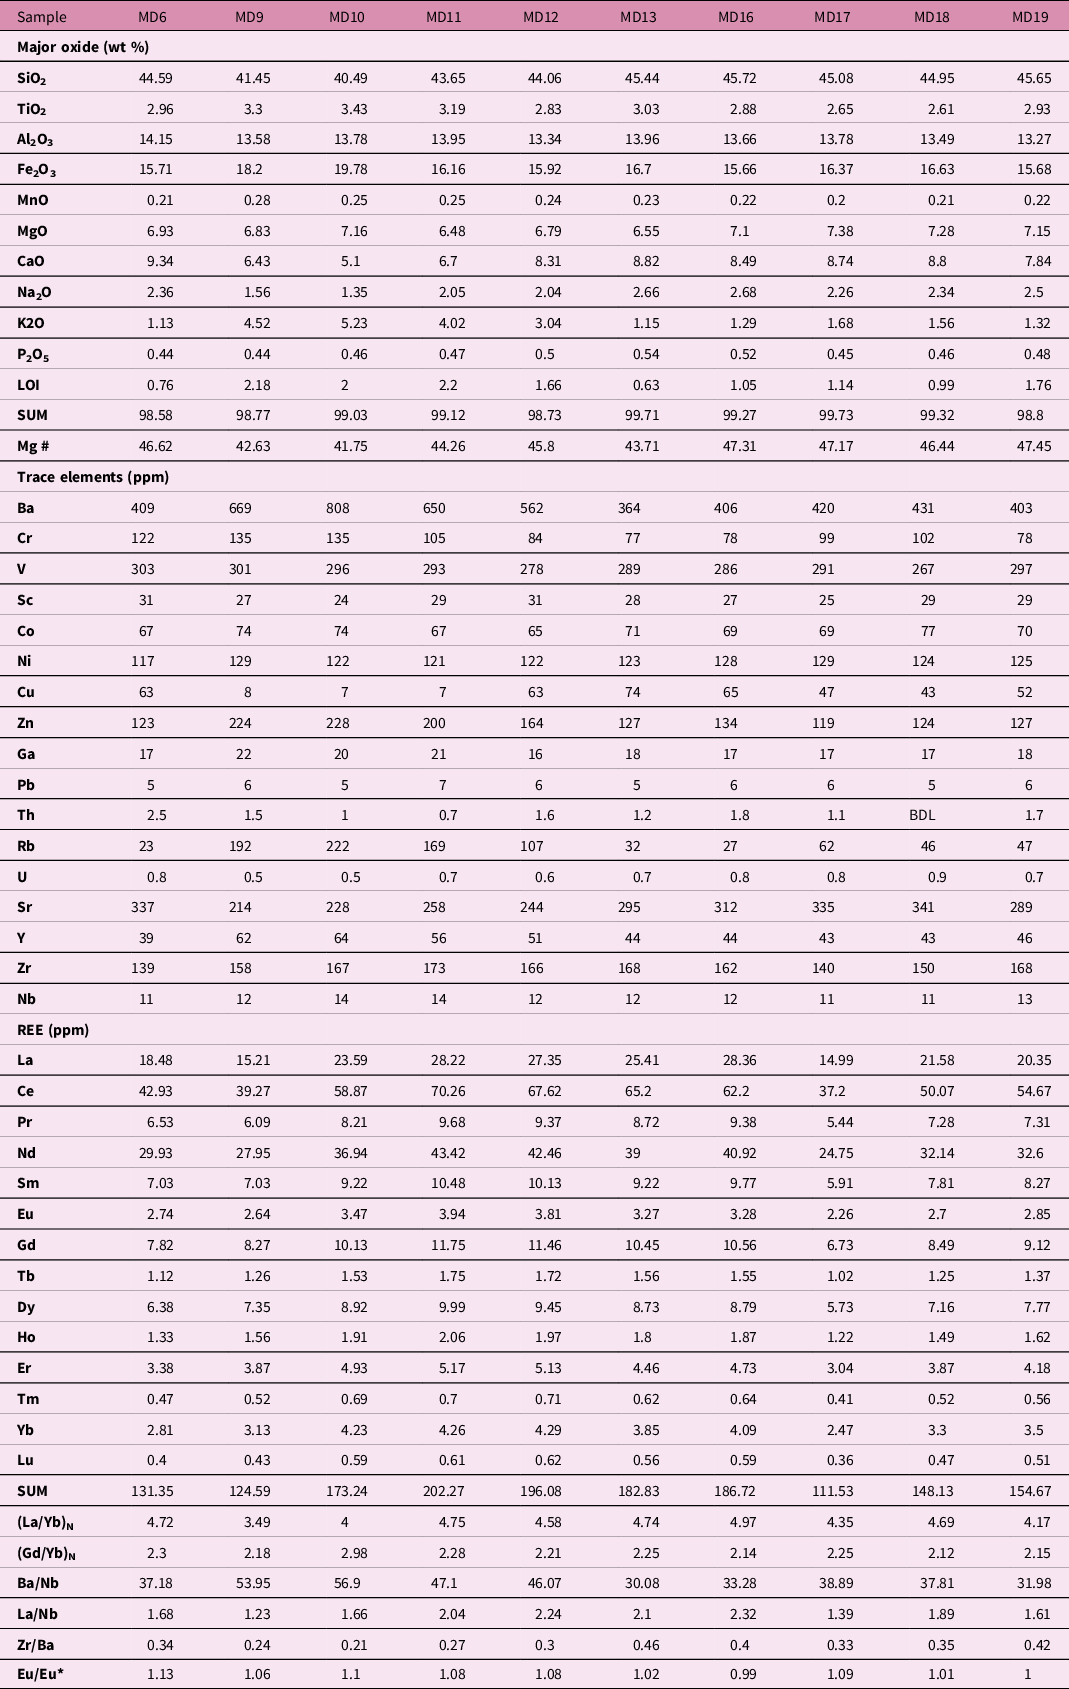
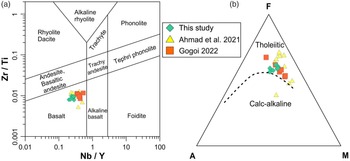
The major and trace element distributions of the Borjuri metadolerites are presented in Table 2. In general, for the geochemical classification of subvolcanic rocks for un-metamorphosed samples, the total alkali versus silica diagram is used (La Bas et al. Reference Le Bas, Le Maitre, Streckeisen and Zanettin1986). However, the studied mafic rocks have undergone deformation and metamorphism. Hence, the immobile trace elements such as REEs and high field strength elements (HFSEs) are given more importance. The HFSE ratio of parent rocks is similar to that of the altered rocks (Finlow-Bates & Stumpfl, Reference Finlow-Bates and Stumpfl1981; MacLean & Barrett, Reference MacLean and Barrett1993). We have therefore adopted a classification diagram based on immobile elements, which is generally used for altered rocks. In the Zr/Ti versus Nb/Y discrimination diagram after Pearce (Reference Pearce and Wyman1996), all the studied samples plot in the field of basalt (Fig. 5a). The mafic rocks show tholeiitic trend in the (Na2O+K2O)-FeOT-MgO or AFM (alkalis-iron-magnesium) plot (Fig. 5b; Irvine & Baragar, Reference Irvine and Baragar1971). We have drawn a comparison of our data with known Indian occurrences of Proterozoic mafic rocks from the BVSs of CGGC: pillow basalts and dolerites after Ahmad et al. (Reference Ahmad, Paul, Negi, Akhtar, Gogoi and Saikia2021) and dolerites after Gogoi (Reference Gogoi2022).
Major oxides (wt %), trace and rare earth elements (ppm) composition of the metadolerites of Borjuri from Mikir Massif part of Assam-Meghalaya Gneissic Complex

LOI, loss on ignition; BDL, below detection limit.
(a) Geochemical classification diagram based on immobile trace elements (after Pearce, Reference Pearce and Wyman1996) and (b) AFM diagram displaying tholeiitic nature of magma for the metadolerites of Borjuri (after Irvine & Baragar, Reference Irvine and Baragar1971). Data used for comparison are from Proterozoic mafic rocks of Bathani volcano-sedimentary sequence: Ahmad et al. (Reference Ahmad, Paul, Negi, Akhtar, Gogoi and Saikia2021) and Gogoi (Reference Gogoi2022).

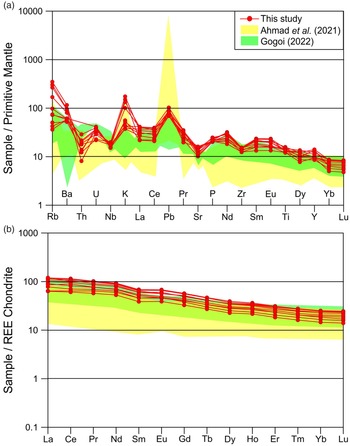
The primitive mantle-normalized multi-element diagram is shown in Figure 6a. The diagram exhibits distinct peaks at large ion lithophile elements (LILE) Rb, K and Pb, and noteworthy troughs at HFSEs Nb, Zr and Yb. The elevated concentrations of LILE in the rocks can be attributed to dehydration of the subducted slab and transportation of the LILE-rich fluids to the overlying mantle wedge (Saunders et al. Reference Saunders, Tarney and Weaver1980; Wilson & Davidson, Reference Wilson and Davidson1984). The negative aberrations depicted by Nb and Yb can be ascribed to the subduction zone magmatic regime (Sheraton et al. Reference Sheraton, Black, McCulloch and Oliver1990; Zhao et al. Reference Zhao, Shiraishi, Ellis and Sheraton1995). Chondrite-normalized REE diagram of the studied metadolerites displays elevated patterns for LREE ((La/Yb)N=3.49–4.97; (Gd/Yb)N=1.98–2.30)) and nearly flat patterns for HREE (Fig. 6b). Most of the samples exhibit positive europium anomaly (Eu/Eu*=0.99–1.13) indicating accumulation of plagioclase. The REEs displaying sub-parallel trends suggest that the rocks are cogenetic in nature. The trace and REE patterns of mafic rocks from the Shillong Basin are similar to those of mafic rocks from the BVSs, with the samples from the former displaying slightly enriched character (Fig. 6a, b).
(a) Primitive mantle-normalized multi-element diagram (normalizing values after Sun & McDonough, Reference Sun and McDonough1989) and (b) chondrite-normalized rare earth element patterns (normalizing values after Boyton, Reference Boynton1984) for the metadolerite samples of Borjuri. For comparison purpose, trace element data in yellow and green patterns are plotted from Ahmad et al. (Reference Ahmad, Paul, Negi, Akhtar, Gogoi and Saikia2021) and Gogoi (Reference Gogoi2022) respectively.

5.c. Pressure and temperature estimates
For geothermobarometric studies, six pairs of mineral chemical data of plagioclase and amphibole were selected from the metadolerites. Various researchers have proposed several methods (Blundy & Holland, Reference Blundy and Holland1990; Holland & Blundy, Reference Holland and Blundy1994; Anderson & Smith, Reference Anderson and Smith1995; Anderson, Reference Anderson1996) for geothermobarometry calculations. Amphiboles are crucial minerals for geothermobarometry as they are combinedly affected by parameters such as pressure, temperature and oxygen fugacity. From experimental and field studies regarding the depth of emplacement of plutons, it is seen that the Al content of amphibole is considered a function of pressure and temperature (Hollister et al. Reference Hollister, Grissom, Peters, Stowell and Sisson1987; Thomas & Ernst, Reference Thomas and Ernst1990; Blundy & Holland, Reference Blundy and Holland1990; Schmidt, Reference Schmidt1992; Anderson & Smith, Reference Anderson and Smith1995).
The metamorphic P-T conditions were estimated using the amphibole-plagioclase geothermobarometry. To calculate pressure, we have used the formulation of Al-in-hornblende barometer by Anderson & Smith (Reference Anderson and Smith1995). The errors associated with the Al-in-hornblende barometer are ± 0·6 kbar. The pressure obtained for the samples varies between 7 and 8 kbar (Supplementary Table S4). Holland & Blundy (Reference Holland and Blundy1994) proposed two geothermometers. One applies to quartz-bearing igneous rocks (edenite + 4quartz = tremolite + albite), while the other is for both quartz-bearing and quartz-free igneous rocks (edenite + albite = richterite + anorthite). For our samples, compositions of amphibole along with coexisting plagioclase were used for temperature calculations. The calculation was carried out with the help of amphibole-plagioclase geothermometer (edenite-richterite thermometer) after Holland & Blundy (Reference Holland and Blundy1994). The errors associated with the thermometer are ± 40°C. The temperature of the samples ranges from 633°C to 703°C with an average of 664°C (Supplementary Table S4). In the calcic amphibole discrimination diagram (Supplementary Fig. S5) by Fleet & Barnett (Reference Fleet and Barnett1978), the amphiboles distinctly plot in the low-pressure metamorphic field. In the temperature–pressure diagram, the estimated temperature and pressure of the metadolerites plot in the amphibolite facies and medium P-T zone (Supplementary Fig. S6).
6. Discussion
6.a. Post-crystallization alteration and crustal contamination
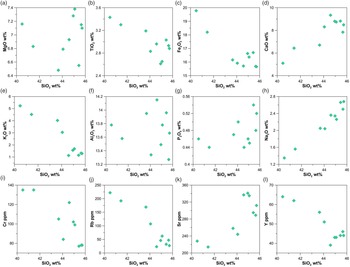
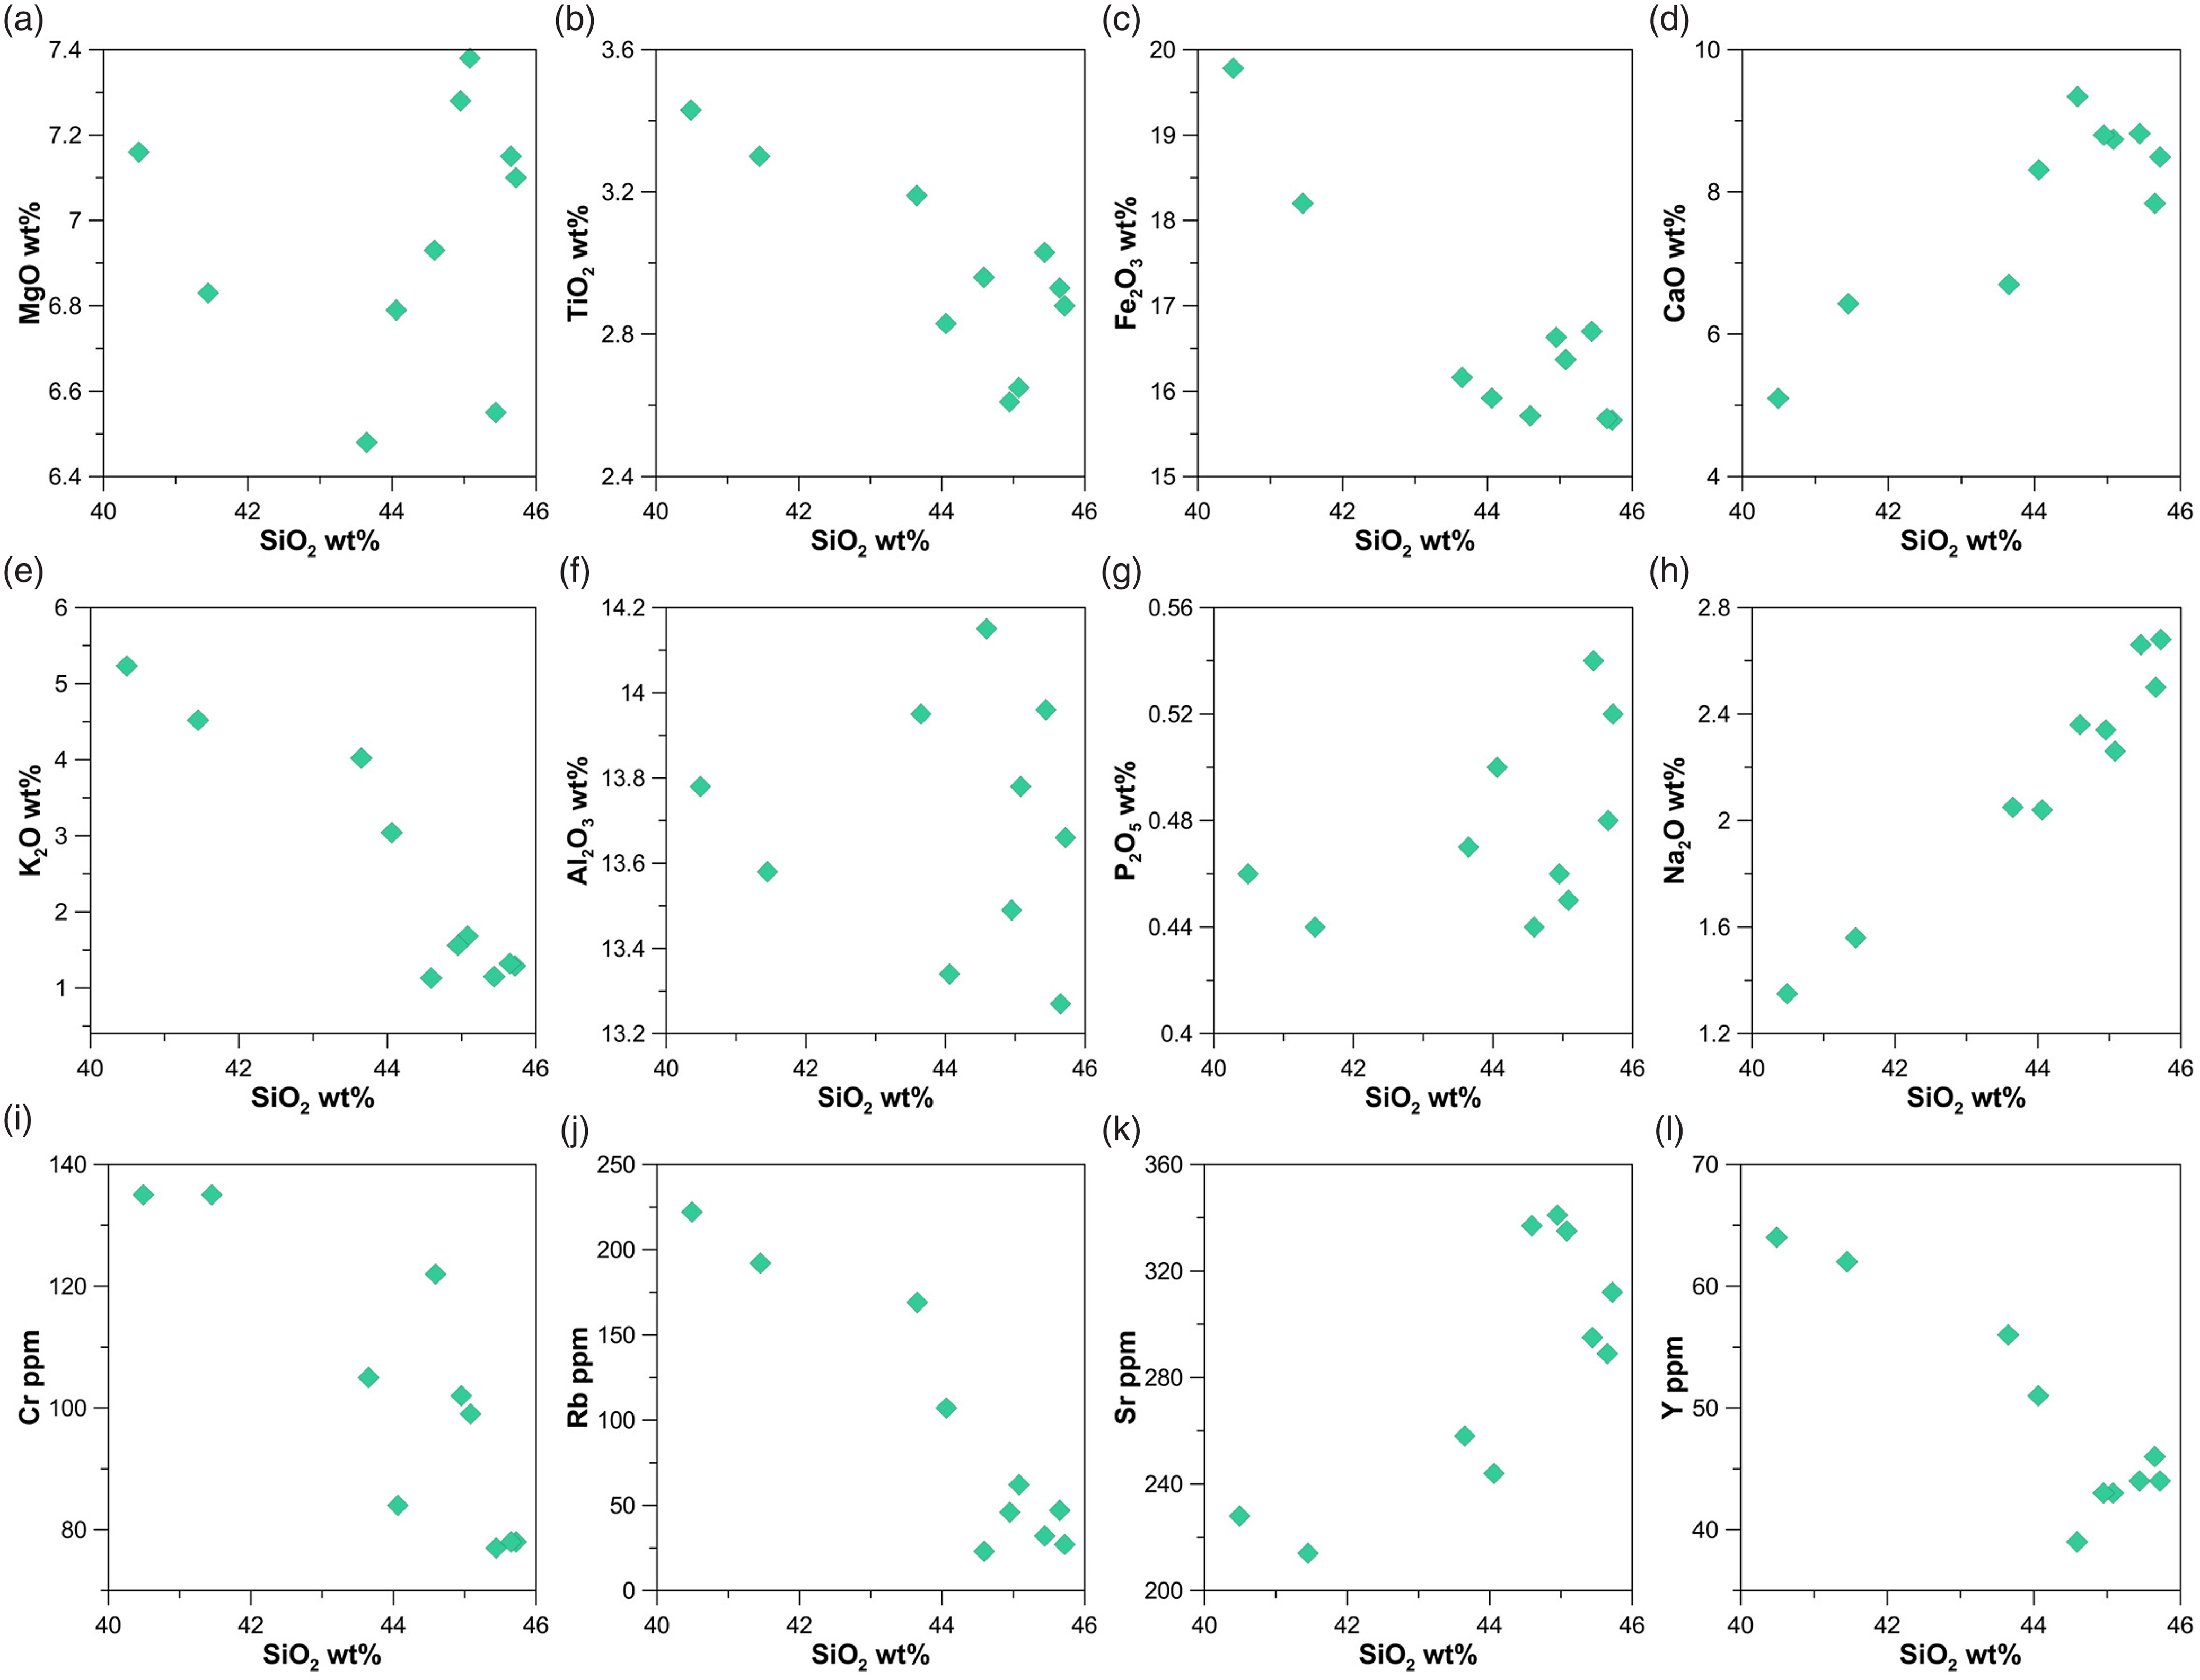
The field as well as petrographic observations shows post-crystallization alteration effects in the metadolerites of Borjuri area. Amphibole, biotite and chlorite observed under a microscope are secondary minerals that have formed from the replacement of primary Fe-Mg minerals, such as pyroxene. Isochemical and volume-to-volume replacement are responsible for the replacement of original pyroxene by amphiboles which do not bring about any changes in the original igneous textures (Redman & Keays, Reference Redman and Keays1985). The occurrence of such secondary metamorphic minerals helps to ascertain the degree of alteration. Other than the petrographic study, the extent of post-magmatic alteration processes can also be evaluated with the help of Harker variation diagrams. A series of binary variation diagrams (Fig. 7) of selected major and trace elements have been plotted against SiO2, and the observations show positive, negative and scattered trends. The elements CaO, Na2O, P2O5 and Sr show positive trends in a linear or non-linear way, which is suggestive of the accumulation of plagioclase and apatite in the evolving magma. However, with an increase in SiO2, the elements Fe2O3, TiO2, K2O, Rb, Cr and Y all show negative trends. This is indicative of the fractionation of amphibole, biotite, clinopyroxene, titanite and Fe-Ti oxides in the evolving magma. The positive and negative trends displayed by these major and minor elements suggest near primary magmatic characteristics. On the other hand, the elements MgO and Al2O3 show plots of scattered nature, which decipher post-crystallization alteration effects or the post-magmatic mobility of these elements.
Bivariate diagrams of (a–h) major elements versus SiO2 and (i–l) selected trace elements versus SiO2.
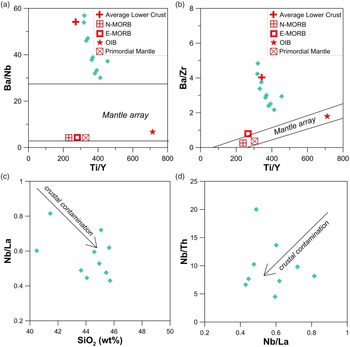
Mantle-derived mafic magmas are prone to crustal assimilation during ascent or when emplaced in crustal magma chambers (Mohr, Reference Mohr, Halls and Fahrig1987; Pe-piper et al. Reference Pe-piper, Matarangas, Reynolds and Chatterjee2003). It is therefore crucial to assess the effects of crustal contamination on the chemical composition of the primary mafic magma. Elemental ratios such as Ba/Nb, Ti/Y, La/Yb, Ba/Zr, La/Sm, Zr/Y, Nb/La, Nb/Th and Nb/Y are frequently used to evaluate crustal assimilation in mafic rocks (Rollinson, Reference Rollinson1993). Trace-element ratio plots for the Borjuri metadolerites are presented in Figure 8a–d. Plots show that the studied metadolerites plot away from the mantle array, which likely suggests an influence of crustal assimilation (Fig. 8a, b). The Nb/La versus SiO2 and Nb/Th versus Nb/La diagrams also suggest a crustal contamination in the samples (Fig. 8c, d).
(a) Ti/Y versus Ba/Nb, (b) Ti/Y versus Ba/Zr, (c) Nb/La versus SiO2 and (d) Nb/La versus Nb/Th variation diagrams of the mafic rocks of Borjuri.

6.b. Magmatic evolution
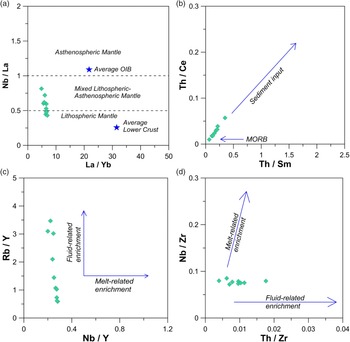
Mafic rocks derived from the lithospheric mantle have higher LILE and LREE element abundances and lower HFSE than those generated by the asthenospheric mantle melting. As a result of these variations in elemental abundances between the asthenospheric and lithospheric mantle, an arrangement of HFSE–LREE ratios is useful for understanding the source of mantle-derived rocks. The Zr/Ba values are being routinely used to differentiate between asthenospheric (Zr/Ba > 0.5) and lithospheric sources (Zr/Ba = 0.3–0.5) (Ormerod et al. Reference Ormerod, Hawkesworth, Leeman and Menzies1988; Menzies et al. Reference Menzies, Kyle, Jones and Ingram1991). The Zr/Ba range of the studied samples varies from 0.21 to 0.46 indicating the involvement of the lithospheric mantle. Moreover, the elemental ratio of La/Nb of the Borjuri metadolerites ranges from 1.23 to 2.32. This is comparable to the lithospheric mantle where La/Nb > 1 (Fitton et al. Reference Fitton, James, Kempton, Ormerod and Leeman1988; Thompson & Morrison, Reference Thompson and Morrison1998). The ratio La/Nb also therefore suggests an origin from the lithospheric mantle for the metadolerites. As HFSEs like Nb are depleted in the lithospheric mantle with respect to the LREEs, low Nb/La implies a lithospheric mantle origin and higher Nb/La suggests an OIB-like asthenospheric mantle source. The plot of (La/Yb) versus (Nb/La) (Smith et al. Reference Smith, Sánchez, Walker and Wang1999) further confirms the origin of the metadolerites from lithospheric and mixed lithospheric–asthenospheric mantle sources (Fig. 9a).
(a) La/Yb versus Nb/La (Smith et al. Reference Smith, Sánchez, Walker and Wang1999) plot showing lithospheric and mixed lithospheric mantle source for Borjuri mafics. (b) Th/Sm versus Th/Ce plot of the Borjuri mafics shows the input of subducted sediment. (c) Nb/Y versus Rb/Y and (d) Nb/Zr versus Th/Zr, indicating fluid-related enrichment in Borjuri mafics.

The trace elemental signatures such as enrichment of LILE with respect to HFSE and negative Nb anomaly are all aspects of subduction-related mantle metasomatism. Generally, the enrichment of mantle source region can be ascribed to metasomatism by (1) fluxing of slab-derived fluids obtained from the dehydration of oceanic crust (Hawkesworth et al. Reference Hawkesworth, Gallagher, Hergt and McDermott1993; Turner et al. Reference Turner, Hawkesworth, Rogers and King1997) and (2) addition of hydrous melts of subducted sediments (Peacock et al. Reference Peacock, Rushmer and Thompson1994; Hawkesworth et al. Reference Hawkesworth, Turner, McDermott, Peate and Van Calsteren1997) or of the MORB segment of the slab (Peacock et al. Reference Peacock, Rushmer and Thompson1994; Stern & Kilian, Reference Stern and Kilian1996). The distribution and variability of elements such as REE, Th and Ba provide valuable constraints for identifying the role of slab-derived fluids and slab-derived melts in mantle metasomatism (Spandler & Pirard, Reference Spandler and Pirard2013; Guo et al. Reference Guo, Li, Fan, Li, Zhao, Huang and Xu2015). In the Th/Sm versus Th/Ce plot (Fig. 9b), the metadolerites illustrate a sediment-input trend indicative of sediment-related melt enrichment. The vertical and horizontal trends shown by the ratio plots of Rb/Y versus Nb/Y (Fig. 9c) and Nb/Zr versus Th/Zr (Fig. 9d), respectively, indicate fluid-related enrichment of the mafic magma. Source enrichment by fluids from the subducted slab is also supported by high Ba/Nb (> 28; Fitton et al. Reference Fitton, James, Kempton, Ormerod and Leeman1988). Ba/Nb ratio of the studied metadolerites ranges from 30.08 to 56.90. Fluids obtained from the subducted slab will modify the overlying mantle wedge geochemically. It will also lower the peridotite solidus to generate magmas (Stolper & Newman, Reference Stolper and Newman1994; Grove et al. Reference Grove, Parman, Bowring, Price and Baker2002). Trace elemental geochemical attributes of the metadolerites of Borjuri strongly suggest derivation from a fluid-enriched lithospheric mantle source in a subduction regime.
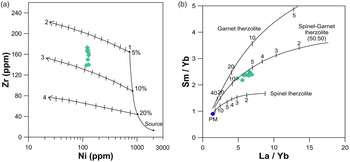
A petrogenetic model based on Ni versus Zr was used for evaluating the lherzolite mantle composition. It is evident from the Ni versus Zr plot (Condie et al. Reference Condie, Bobrow, Card, Halls and Fahrig1987) that the metadolerites are products of a primary magma generated by 6%–10% melting of a lherzolite mantle source (Fig. 10a). REE ratios and their abundances (e.g. Sm/Yb and La/Yb) are extensively used to determine the source of mafic magmas and the degree/variation of mantle melting (McKenzie & O’Nions, Reference McKenzie and O’Nions1991; Su et al. Reference Su, Zheng, Griffin, Zhao, Tang, Ma and Lin2012). In the Sm/Yb versus La/Yb diagram, the studied samples plot below or near the spinel + garnet lherzolite (50:50) melting curve with primitive mantle as the initial composition (Fig. 10b). Here, the Sm/Yb values are lower than that of the garnet lherzolite melting curve and higher than that of the spinel lherzolite melting curve. Therefore, it can be inferred that the parental mafic magma for metadolerites was obtained from a mantle source incorporating spinel + garnet lherzolite. Moreover, the Sm/Yb versus La/Yb plot indicates an approximately 6%–10% partial melting of mantle lherzolite was necessary for the generation of parental magma of the metadolerites. Thus, from the trace element ratio plots it is evident that the parental magma of the metadolerites from Borjuri area was produced by 6%–10% melting of the lherzolite mantle source.
Plots for the metadolerites of Borjuri (a) Ni versus Zr petrogenetic model for a lherzolite mantle composition. Curve 1 signifies batch melting at 1500 °C (1 atm. equivalent) with percentages along the line representing degree of partial melting. Curves 2, 3 and 4 demonstrate olivine fractionation with elimination of olivine marked in 5% increments (after Condie et al. Reference Condie, Bobrow, Card, Halls and Fahrig1987). (b) La/Yb versus Sm/Yb diagram where the Borjuri metadolerites cluster near the spinel+garnet lherzolite curve (after Liu et al. Reference Liu, Ma, Zhang, Xiong, Huang and Jiang2014). Abbreviation: PM, primitive mantle.

6.c. Geotectonic framework
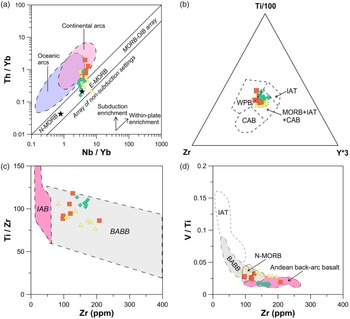
Rocks of basaltic composition are ubiquitous in every tectonic environment. They are geochemically sensitive to the changes in the geotectonic framework. Thus, the geochemical signature of basaltic rocks is commonly used to discriminate tectonic settings. The metadolerites of Borjuri area show high LREE/HREE and LILE/HFSE ratios, which are distinguishing traits of magmas produced in subduction zones (Hawkesworth et al. Reference Hawkesworth, Gallagher, Hergt and McDermott1993; Gorton & Schandl, Reference Gorton and Schandl2000). In the Th/Yb versus Nb/Y tectonic discrimination diagram (Pearce, Reference Pearce2008), composition of the metadolerites clusters near E-MORB composition (Fig. 11a) displaying resemblance to back-arc basalts and dolerites of the BVSs (Ahmad et al. Reference Ahmad, Paul, Negi, Akhtar, Gogoi and Saikia2021; Gogoi, Reference Gogoi2022). Furthermore, fluid immobile elements such as Zr, Ti, V and Y, which are independent of secondary processes (e.g. weathering and metamorphism), help in evaluating the tectonic setting of altered basic rocks. In the Ti/100-Zr-Yx3 ternary diagram (after Pearce & Cann, Reference Pearce and Cann1973), the metadolerites display mixed signatures of mid-oceanic ridge basalt, island arc tholeiites and calc-alkali basalts (Fig. 11b). The observed hybrid mixture between mid-oceanic ridge basalt and island arc tholeiites for the studied mafic rocks can be associated with back-arc basin basalts (Pearce & Peate, Reference Pearce and Peate1995; Pearce & Stern, Reference Pearce, Stern, Christie, Fisher, Lee and Givens2006). In the Ti/Zr versus Zr (Fig. 11c) and V/Ti versus Zr (Fig. 11d) discrimination diagrams after Woodhead et al. (Reference Woodhead, Eggins and Gamble1993), the mafic rocks distinctly plot in the field of back-arc basin. Thus, it can be inferred that the parental magmas responsible for the generation of the metadolerite intrusives were produced in a back-arc extensional basin associated with subduction dynamics. Our data show similar geochemical characteristics to the known occurrences of mafic rocks from the BVSs.
Tectonic discrimination diagrams for the Borjuri metadolerites. (a) Nb/Yb versus Th/Yb plot after Pearce (Reference Pearce2008). (b) Ti/100-Zr-Yx3 ternary diagram after Pearce & Cann (Reference Pearce and Cann1973). (c) Ti/Zr versus Zr after Woodhead et al. (Reference Woodhead, Eggins and Gamble1993). (d) Zr versus V/Ti after Woodhead et al. (Reference Woodhead, Eggins and Gamble1993). Field of Andean back-arc basalt is taken from Espanon et al. (Reference Espanon, Chivas, Kinsley and Dosseto2014). Abbreviations: BABB, Back-arc basin basalt; CAB, Calc-alkali basalts; IAB, Island-arc basalt; IAT, Island-arc tholeiites; MORB, Mid-oceanic ridge basalt; WPB, Within plate basalt. Symbols as in Figure 5.

6.d. Geodynamic implications
The Shillong Basin is an integral unit of AMGC that developed in the east-central part of the Meghalaya plateau and continued up to the Mikir Massif. This NE-SW interior basin is believed to have originated due to a thermal event followed by subsidence in a tensional stress regime (Nandy, Reference Nandy2001). The initiation of sedimentation in the basin commenced as early as 1900 Ma and continued till 1400 Ma (zircon dates of quartzites by Bidyananda & Deomurari, Reference Bidyananda and Deomurari2007). The metasedimentary province of Shillong Basin is intruded by several mafic and felsic dykes and sills. These mafic units, which have been subjected to amphibolite-facies metamorphism, occur in close association with the quartzites of the Shillong Group of rocks in the Mikir Massif (Fig. 3b-d). In this study, we attempt to give the tectonic framework responsible for the formation of the Shillong Basin. The geochemical signatures of the metadolerites presented in this work indicate a subduction zone setting for the generation of these rocks induced by fluid flux melting of the lithospheric mantle in a back-arc region. This implicates that the Shillong Basin represents a back-arc rift basin.
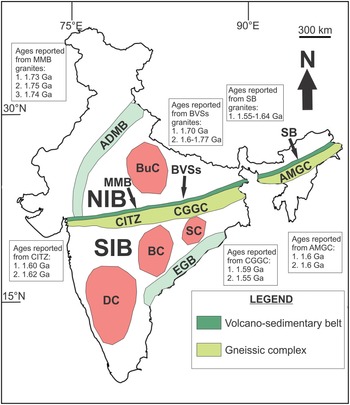
Recorded geochronological evidence suggests that AMGC has undergone Columbian, Grenvillian and Pan-African magmatic events (Yin et al. Reference Yin, Dubey, Webb, Kelty, Grove, Gehrels and Burgess2010; Chatterjee et al. Reference Chatterjee, Bhattacharya, Duarah and Mazumdar2011; Kumar et al. Reference Kumar, Rino, Hayasaka, Kimura, Raju, Terada and Pathak2017; Gogoi et al. Reference Gogoi, Majumdar, Cottle and Dutta2019). Shreds of evidence of such events from AMGC establish its involvement in the amalgamation and break-up of Columbia, Rodinia and Pangea. The Paleo-Mesoproterozoic felsic magmatism of the AMGC (Bidyananda & Deomurari, Reference Bidyananda and Deomurari2007; Yin et al. Reference Yin, Dubey, Webb, Kelty, Grove, Gehrels and Burgess2010; Kumar et al. Reference Kumar, Rino, Hayasaka, Kimura, Raju, Terada and Pathak2017; Gogoi et al. Reference Gogoi, Majumdar, Cottle and Dutta2019; Doley et al. Reference Doley, Bhagabaty, Sarma, Singh and Zou2022) is comparable to the Aravalli Belt of northwest India (Kaur et al. Reference Kaur, Zeh, Chaudhri, Gerdes and Okrusch2013), Eastern Ghats Mobile Belt of southeast India (Dobmeier et al. Reference Dobmeier, Lütke, Hammerschmidt and Mezger2006), MMB of central India (Bora et al. Reference Bora, Kumar, Yi, Kim and Lee2013) and CGGC (Ray Barman et al. Reference Ray Barman, Bishui and Sarkar1990; Ray Barman & Bishui, Reference Ray Barman and Bishui1994; Acharyya, Reference Acharyya2003; Hossain et al. Reference Hossain, Tsunogae, Rajesh, Chen and Arakawa2007; Saikia et al. Reference Saikia, Gogoi, Kaulina, Lialina, Bayanova and Ahmad2017; Gogoi, Reference Gogoi2022). On drawing a comparison between the geochemical trends shown by the metadolerites of Shillong Basin and mafic rocks of BVSs, it is clear that the similarity is very significant. Moreover, in the present study it is noted from field observations that the joints present in the metadolerites show a trend of NE-SW and a dip towards SE which is directly comparable to the regional trend of CITZ (ENE-WSW). From a comparative analysis of our geochemical data, similar lithological and structural frameworks and associated geological dates given by previous authors, we envisage that the Shillong Basin is the eastern continuation of the BVSs and MMB of the CITZ (Fig. 12).
Map of Indian subcontinent displaying the ENE-WSW-trending Central Indian Tectonic Zone (CITZ), Chotanagpur Granite Gneiss Complex (CGGC) and Assam-Meghalaya Gneissic Complex (AMGC) (modified after Saikia et al. Reference Saikia, Gogoi, Kaulina, Lialina, Bayanova and Ahmad2017). This continuous mobile belt demarcates the boundary between the North Indian Block (NIB) from the South Indian Block (SIB) (Acharyya Reference Acharyya2003; Bhandari et al. Reference Bhandari, Pant, Bhowmik and Goswami2011; Chatterjee & Ghose, Reference Chatterjee and Ghose2011; Rekha et al. Reference Rekha, Upadhyay, Bhattacharya, Kooijman, Goon, Mahato and Pant2011; Bhowmik et al. Reference Bhowmik, Wilde, Bhandari, Pal and Pant2012). The NIB comprises of the Bundelkhand Craton (BuC), whereas the SIB is a union of the Dharwar Craton (DC), the Singhbhum Craton (SC) and the Bastar Craton (BC). The Aravalli Delhi Mobile Belt (ADMB) and the Eastern Ghats Belt (EGB) are also shown. Two volcano-sedimentary sequences of CITZ, namely Mahakoshal Mobile Belt (MMB) and its eastern continuation Bathani volcano-sedimentary sequence (BVSs), are shown. The present study projects the Shillong Basin of AMGC as the eastern continuation of the BVSs. The ages reported from the MMB are taken from: 1) Sarkar et al. (Reference Sarkar, Boda, Kundu, Mamgain and Shankar1998); 2) Bora et al. (Reference Bora, Kumar, Yi, Kim and Lee2013); 3) Yadav et al. (Reference Yadav, Ahmad, Kaulina and Bayanova2015). The ages reported from the BVSs are taken from: 1) Chatterjee & Ghose (Reference Chatterjee and Ghose2011); 2) Saikia et al. (Reference Saikia, Gogoi, Kaulina, Lialina, Bayanova and Ahmad2017, Reference Saikia, Gogoi, Ahmad, Kumar, Kaulina and Bayanova2019). The ages reported from the Shillong Basin are taken from: 1) Gogoi et al. (Reference Gogoi, Majumdar, Cottle and Dutta2019). The ages reported from the CITZ are taken from: 1) Bhandari et al. (Reference Bhandari, Pant, Bhowmik and Goswami2011); 2) Bhowmik et al. (Reference Bhowmik, Wilde and Bhandari2011). The ages reported from the CGGC are taken from: 1) Pandey et al. (Reference Pandey, Gupta and Lall1986); 2) Chatterjee et al. (Reference Chatterjee, Crowley and Ghose2008). The ages reported from the AMGC are taken from: 1) Chatterjee et al. (Reference Chatterjee, Mazumdar, Bhattacharya and Saikia2007); 2) Yin et al. (Reference Yin, Dubey, Webb, Kelty, Grove, Gehrels and Burgess2010).

In various hypothesized models, the Greater Indian Landmass has been an essential element in the build-up of the Columbia supercontinent (Zhao et al. Reference Zhao, Cawood, Wilde and Sun2002; Hou et al. Reference Hou, Santosh, Qian, Lister and Li2008; Pesonen et al. Reference Pesonen, Mertanen and Veikkolainen2012; Zhang et al. Reference Zhang, Li, Evans, Wu, Li and Dong2012; Pisarevsky et al. Reference Pisarevsky, Biswal, Wang, DeWaele, Ernst, Södurlund, Tait, Ratre, Singh and Cleve2013; Bhowmik, Reference Bhowmik2019; Chattopadhyay et al. Reference Chattopadhyay, Bhowmik and Roy2020; Sequeira et al. Reference Sequeira, Bhattacharya and Bell2022). On the basis of previous literatures, it can be deduced that Columbia supercontinent assembled during 1900–1600 Ma and fragmented at around 1500–1200 Ma (Evans, Reference Evans2013). An even wider time span for tectonic history of the Columbia supercontinent, that is, ca 2100–1800 Ma for its amalgamation, 1800–1600 Ma for intracontinental rifting and 1300–1200 Ma for break-up, have been considered (Saha et al. Reference Saha, Bhowmik, Bose and Sajeev2016; Wang et al. Reference Wang, He, Carranza and Cui2019; Meert & Santosh, Reference Meert and Santosh2022). A large number of literatures are available regarding the position of Indian subcontinent within the Columbia supercontinent. India was placed near Laurentia and the North China Craton by Hou et al. (Reference Hou, Santosh, Qian, Lister and Li2008), while Zhang et al. (Reference Zhang, Li, Evans, Wu, Li and Dong2012) have placed it adjacent to Australia, and Pisarevsky et al. (Reference Pisarevsky, Biswal, Wang, DeWaele, Ernst, Södurlund, Tait, Ratre, Singh and Cleve2013) have positioned India next to the Sarmatia margin of Baltica. Thus, India’s position in Columbia reconstructions has largely remained dubious due to inadequate geological and geochronological data. During Columbia formation, the northern and southern Indian blocks merged to form a single continental block, that is, the Greater Indian Landmass. Thus, India was not a single continental block until the amalgamation of Columbia (Saikia et al. Reference Saikia, Gogoi, Kaulina, Lialina, Bayanova and Ahmad2017). To get a closer outlook on the assembly, configuration and breaking up of the Greater Indian Landmass in relation to Columbia supercontinent, it is necessary to look for a continuation of mobile belts similar to CITZ in other continental blocks. Identifying Paleo-Mesoproterozoic mobile belt with an associated back-arc rift basin will allow us to position the hypothesized proto-continental blocks in the hypothetical supercontinental models.
7. Conclusions
The AMGC is exemplary of a number of magmatic events which have led to many felsic and mafic intrusives within the basement gneisses as well as the Shillong Group of rocks. The studied metadolerites related to the Khasi greenstones are found as intrusive in contact with quartzites of the Borjuri area in the Mikir Massif. These metadolerites have undergone metamorphism reaching amphibolite facies conditions with estimated pressure and temperature of 7–8 kbar and 664 °C, respectively. The studied mafic rocks depict well-preserved signatures that define the geotectonic framework of a subduction zone setting, more specifically a back-arc extensional setting. Comparing geochemical data of the metadolerites and taking into consideration structural affiliations along with available geochronological dates, marked similarity is seen between the Shillong Basin of AMGC and BVSs of CGGC. Thus, we can conclude that the Shillong Basin is the eastern extension of the BVSs and also MMB of the CITZ.
Supplementary material
To view supplementary material for this article, please visit https://doi.org/10.1017/S0016756823000237
Acknowledgements
Bibhuti Gogoi acknowledges the DST-SERB grant vide Project No. CRG/2020/002635. Pallabi Basumatary acknowledges the CSIR-JRF fellowship No. 09/1236(11154)/2021-EMR-I. We would like to express our sincere gratitude to three anonymous reviewers for their insightful and constructive comments. We thank Dr. Sarah Sherlock for editorial handling of the manuscript. Useful suggestions by Dr. Amiya Baruah are gratefully acknowledged.
Competing interests
The authors declare that in this present work there is no conflict of interests.