Introduction
Materials with at least one dimension of their constituent structures between 1 nm and 100 nm are known as nanomaterials.Reference Xia, Rogers, Paul and Whitesides 1 These have received steadily growing interest owing to their unique position as a bridge between atoms and bulk materials, as well as their remarkable properties and important applications. The ability to generate nanomaterials with well-controlled sizes, shapes, compositions, and internal structures (e.g., solid versus hollow) is central to advances in many areas of modern science and technology. Among various types of functional materials, metals deserve our special attention because they represent more than two-thirds of the elements in the periodic table. Essentially, all of them have found extensive use in applications ranging from catalysis to electronics, photonics, information storage, sensing, imaging, medicine, photography, as well as generation, conversion, and storage of energy.Reference An and Somorjai 2 – Reference Hervés, Pérez-Lorenzo, Liz-Marzán, Dzubiella, Lu and Ballauff 7 Most of these applications require the use of metals in a finely divided state to maximize the specific surface area, preferably in the form of nanocrystals with well-defined facets.
In principle, the size of a nanocrystal determines how the electrons are confined, as well as the surface-to-bulk atomic ratio and the proportions of different types of atoms located at specific sites of a nanocrystal (e.g., vertex, edge, and face), whereas the shape defines the types of facets on its surface and thus the arrangement of atoms on the faces. The shape and size of a metal nanocrystal not only determine its physicochemical properties but also its relevance for various applications. Considering platinum as an example, it plays a central role in a variety of applications, such as catalytic converters, petroleum refining, and fuel cell technology.Reference Chen, Lim, Lee and Xia 8 However, the extremely limited supply of this scarce metal means that we have to maximize performance in these applications by controlling the shape and size of the platinum nanocrystals, so their loading in the catalysts or devices could be substantially reduced to achieve economical and sustainable use of this precious metal. Other good examples are silver and gold; their nanocrystals have fascinating optical properties known as localized surface plasmon resonance (LSPR) and surface-enhanced Raman scattering (SERS).Reference Anker, Hall, Lyandres, Shah, Zhao and Van Duyne 4 Again, both of these properties have a strong dependence on the shape of the nanocrystals.Reference Rycenga, Cobley, Zeng, Li, Moran, Zhang, Qin and Xia 9 These and many other examples clearly demonstrate the importance of shape control to more efficiently utilize metal nanocrystals.
The last decade has witnessed the successful synthesis of metal nanocrystals with a variety of shapes, with notable examples including a sphere; spheroid; cube; cuboctahedron; octahedron; tetrahedron; right bipyramid; decahedron; icosahedron; thin plate with a triangular, hexagonal, or circular profile; and rod or wire with a circular, square, rectangular, pentagonal, or octagonal cross-section.Reference Xia, Xiong, Lim and Skrabalak 10 Our research has mainly focused on solution-phase methods because they are inherently more powerful and versatile (at the same time, more complicated) than vapor-phase methods for generating metal nanocrystals with different shapes. Although the first documented solution-phase synthesis of metal nanocrystals can be traced back to work by Faraday more than 150 years ago on gold colloids, only within the last decade have solution-phase methods blossomed and become a powerful route to the synthesis of metal nanocrystals with the quality, quantity, and reproducibility required for a meaningful study of their shape-property relationships and exploration of their applications. Interestingly, the chemical reactions involved in the synthesis of metal nanocrystals are often very simple, and most of them can be easily found in standard textbooks. In contrast, controlling the assembly of metal atoms into nanocrystals with specific shapes is still in a rudimentary stage, as it typically involves nucleation and growth steps, which are still too complicated to be fully understood.
We started our research journey on this subject with silver,Reference Sun and Xia 11 a noble metal with a broad range of unique properties. For example, silver has the highest electrical and thermal conductivities among all metals, making its nanostructures the best candidates for the fabrication of conductive coatings. Silver mirrors are known to be more reflective than those using other metals, and silver nanocrystals also prevail in applications related to LSPR and SERS.Reference Rycenga, Cobley, Zeng, Li, Moran, Zhang, Qin and Xia 9 In addition, silver is an important catalyst for reactions such as oxidative coupling, and it has been widely used as an antimicrobial agent. Last but not least, silver is much cheaper compared to other noble metals, making it an attractive candidate for the purpose of methodology development. Since silver shares the same crystal structure as other noble metals, it should be easy and straightforward to extend the methodologies developed for silver to other metal systems. Furthermore, silver is the most reactive noble metal, so nanocrystals made of silver can also be easily transformed into other noble metals through galvanic replacement reactions.
From silver mirrors to silver nanowires
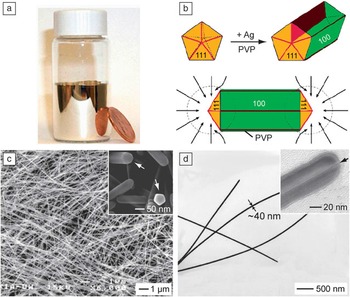
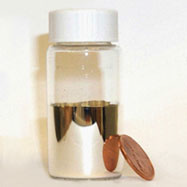
We began our synthesis with the silver mirror reaction, a simple reaction that can be easily found in any organic chemistry textbook.Reference Wade 12 When aldehyde is mixed with a silver ammonia complex, it will quickly reduce the silver ions to atoms, which then nucleate and grow on the surface of a reaction container to generate a shiny mirror-like layer of silver ( Figure 1 a). This reaction is so sensitive that it can be used to tell whether an organic compound contains an aldehyde group, the so-called Tollens’ test. A similar reaction involving the use of a sugar (e.g., glucose) as the reducing agent has long been used to produce silver mirrors for bathrooms and reflective coatings for large surfaces such as telescopes.Reference Song, Sprague, Macleod and Jacobson 13
From silver mirrors to silver nanowires. (a) Photograph of a silver mirror on the inner surface of a glass vial. (b) Schematic illustration of the mechanism responsible for the growth of silver nanowires with pentagonal cross-sections. PVP, poly(vinyl pyrrolidone). (c) SEM and (d) TEM images of typical silver nanowires. The inset in (c) is a magnified SEM image showing the pentagonal cross-sections of the nanowires. The inset in (d) is a high-resolution TEM image taken from the end of a nanowire, showing the existence of a twin plane along the longitudinal axis. (b‒c) are modified with permission from Reference 17. © 2003 American Chemical Society.

When the reactants were reduced in concentration and a polymeric stabilizer was added, the same reaction could be adapted to prepare silver colloids,Reference Yin, Li, Zhong, Gates, Xia and Venkateswaran 14 which display a yellowish color due to the LSPR peak at 400 nm. Characterization by transmission electron microscopy (TEM) indicated that most of the silver nanoparticles in the sample had irregular shapes, together with a broad size distribution. The polydispersity in shape and size could be attributed to twinning, a process very common to face-centered cubic (fcc) metals. When twinning occurred in a random fashion, the final products could contain any number of twin defects ranging from none to a handful. Our further analysis suggested that random twinning was likely a product of fast and non-uniform reduction since the synthesis was typically performed by quickly mixing reagents with high initial concentrations.Reference Yin, Li, Zhong, Gates, Xia and Venkateswaran 14 One potential solution to this problem is to bring the reaction kinetics under control by switching to a relatively mild and controllable reduction process.
After searching the literature, we came across a process known as polyol reduction.Reference Fievet, Lagier and Figlarz 15 In this process, ethylene glycol (EG) is heated to 140–160°C under ambient atmosphere to generate glycolaldehyde,Reference Skrabalak, Wiley, Kim, Formo and Xia 16 whose aldehyde group can reduce silver ions to atoms, initiating nucleation and then growth of silver nanocrystals in the solution phase. What is unique about this process is that the reductant is generated in situ (rather than being added) and then consumed immediately to maintain a relatively low but stable concentration. As a result, both nucleation and growth could be controlled to avoid the formation of twin defects in a random fashion. EG itself is also a good solvent for a large number of salt precursors, including those of the noble metals.
When the polyol synthesis was conducted with silver nitrate (a precursor to silver atoms) and poly(vinyl pyrrolidone) (PVP, a stabilizer and capping agent) in EG without chloride or ferric/ferrous impurities, the seeds would be dominated by decahedrons with five twin defects arranged around a fivefold rotation axis. Since PVP has a “magic” power to bind selectively to the Ag(100) surface due to their good match in geometric structures,Reference Xia, Xiong, Lim and Skrabalak 10 , Reference Sun, Mayers, Herricks and Xia 17 the decahedral seeds could be directed to grow into nanowires with a pentagonal cross-section along the fivefold axis, with the five side faces being covered by {100} planes and stabilized by PVP (Figure 1b). Figure 1c–d shows scanning electron microscope (SEM) and TEM images of a typical sample of silver nanowires, which can be readily prepared with a uniform diameter between 30–100 nm and lengths up to 100 μm. Since silver has the highest electrical and thermal conductivity among all metals, silver nanowires can be dispersed in polymer matrices to fabricate conductive, flexible, and transparent electrodes sought for applications such as touch screen displays, flexible electronics, and flexible solar cells. In fact, our technology on silver nanowires has been licensed to Cambrios, which is developing replacements for ITO films used in display devices. New products (Cambrios ClearOhm, a class of high-performance transparent conductive electrodes) based on this technology have already been incorporated into commercial devices for mobile computing, communications, and entertainment.
From silver nanowires to nanocubes and right bipyramids
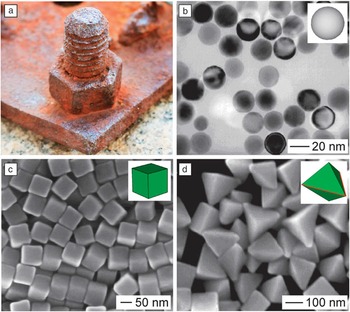
Twinned decahedral seeds have to be avoided or eliminated in order to obtain nanocrystals other than the pentagonal nanowires. We accomplished this by following the same procedure as the nanowire synthesis, but with the introduction of oxidative etching, a process similar to the corrosion or rusting of a piece of steel in salt-saturated wet air ( Figure 2 a).Reference Bailar, Moeller, Kleinberg, Guss, Castellion and Metz 18 In the presence of chloride ions (on the ppm level) and oxygen (from air), we accidently discovered that the defects in the twinned seeds would cause them to be selectively etched away due to their higher reactivity relative to single-crystal seeds.Reference Wiley, Herricks, Sun and Xia 19 In a typical synthesis, the solution turned light yellow within the first minute of reaction, indicating the formation of silver nanoparticles through polyol reduction of silver nitrate. Our TEM analysis indicated that most of the silver nanoparticles contained twin defects at this time.Reference Wiley, Herricks, Sun and Xia 19 The yellow color kept increasing in intensity up to 10 minutes and then started to fade due to the dissolution of the twinned nanoparticles into soluble silver ions. The solution then became colorless after about seven hours and maintained this appearance until a very light yellow color reappeared about 17 hours later. This yellow color grew slowly in intensity over the next 20 hours until it attained a slight red-brown tint. TEM analysis indicated that the silver nanoparticles responsible for the renewed yellow color were essentially all single crystals (Figure 2b). Although multiple twinned seeds are typically more favorable than single-crystal seeds due to the presence of {111} facets in high proportions, the twin defects are more reactive toward an oxidative etchant. As a result, single-crystal seeds could accumulate and gradually increase in concentration at the expense of twinned seeds and eventually become the dominant species in the reaction solution. Again, due to the selective capping effect of PVP, the single crystals were directed to evolve into silver nanocubes enclosed by {100} facets (Figure 2c).Reference Sun and Xia 11 , Reference Xia, Zeng, Oetjen, Li and Xia 20 So long as there was sufficient PVP in the reaction solution, the growth could be continued with the addition of more silver precursor to generate nanocubes with edge lengths up to several hundred nanometers.Reference Zhang, Li, Christine, Zeng, Chen, Wen and Xia 21
The role of oxidative etching in the synthesis of silver nanocrystals. (a) Photograph of a piece of rusty steel in wet air. Photograph was taken by Xiaohu Xia. (b) TEM image of single-crystal silver nanospheres obtained by selectively etching away the twinned nanoparticles. Modified with permission from Reference 19. © 2004 American Chemical Society. (c) SEM image of silver nanocubes enclosed by {100} facets. Modified with permission from Reference 20. © 2012 American Chemical Society. (d) SEM image of single twinned silver right bipyramids. Modified with permission from Reference 22. © 2006 American Chemical Society. The insets in (b–d) show 3D models of the corresponding silver nanocrystals.

The power of an etchant could also be manipulated to selectively remove multiple twinned seeds only, leaving behind seeds with a single twin plane in the solution. In one demonstration, we accomplished this by replacing chloride ions with bromide ions at a proper concentration. In the presence of PVP, the single twinned seeds quickly grow into right bipyramids (Figure 2d).Reference Wiley, Xiong, Li, Yin and Xia 22 This observation is also in agreement with the syntheses of silver nanocubes and nanowires, in which the selective capping of the Ag(100) surface by PVP and relatively fast growth of other surfaces led to the formation of nanocrystals bounded by {100} facets. Significantly, oxidative etching is a common phenomenon in the synthesis of metal nanocrystals, which could be used to help control their size and shape.Reference Xiong, Chen, Wiley, Xia, Aloni and Yin 23 – Reference Rodríguez-Fernández, Pérez-Juste, Mulvaney and Liz-Marzán 25
We further improved the production of silver nanocubes by adding a trace amount of sulfide (S2‒) or hydrosulfide (HS‒) into the chloride-mediated polyol synthesis and by switching the precursor to elemental silver from silver nitrate (AgNO3) to silver trifluoroacetate (CF3COOAg).Reference Siekkinen, McLellan, Chen and Xia 26 – Reference Zhang, Li, Wen, Chen and Xia 28 In this new protocol, Ag2S nanocrystallites formed at the very beginning could serve as nuclei to help induce and maintain a single-crystal structure for the seeds. The exclusion of the nitrate group, which could decompose to form NO2 and other gaseous species, also allowed us to avoid some unwanted effects on the nucleation and growth processes. As a result, we can now routinely produce silver nanocubes with uniform size, on the scale of 1 gram per batch of synthesis, and within one hour. The size of the nanocubes could be readily tuned from 30 to 100 nm by controlling the reaction time. Most recently, we were able to push the nanocubes down to a short edge length of 18 nm by replacing ethylene glycol with diethylene glycol.Reference Wang, Zheng, Huang and Xia 29
Seed-mediated growth and shape control through surface capping
One of the breakthroughs in metal nanocrystal synthesis is the realization that the shape taken by a nanocrystal in a solution phase has a direct correlation with the twin structure or crystallinity of the seed.Reference Wiley, Sun, Mayers and Xia 30 This correlation was initially established by sampling metal nanocrystals at different stages of a synthesis and then analyzing their structures by extensive electron microscopy.Reference Wiley, Sun, Mayers and Xia 30 Our study of the silver system suggested that the seeds formed in the very early stage of a synthesis typically took a quasi-spherical shape, together with a single-crystal, single twinned, or multiple twinned structure. During growth, these seeds evolved into larger nanocrystals with well-defined shapes and thus specific facets on the surface. Specifically, we found that cubes, octahedrons, cuboctahedrons, octagonal rods, and rectangular bars could all grow from single-crystal seeds; right bipyramids could grow from originally single twinned seeds; pentagonal rods or wires could be obtained from multiple twinned, decahedral seeds; and triangular or hexagonal plates could be derived from plate-like seeds with stacking faults in the vertical direction.Reference Xia, Xiong, Lim and Skrabalak 10 , Reference Xiong and Xia 31 For the same type of seed, the variations in shape can be attributed to the difference in binding strength for various types of facets by the same capping agent, as well as the growth kinetics. In order to obtain metal nanocrystals with one specific shape to the exclusion of others, one has to tightly control both the crystallinity of the seed and the capping agent present in solution.Reference Xia, Xiong, Lim and Skrabalak 10 , Reference Wiley, Sun, Mayers and Xia 30
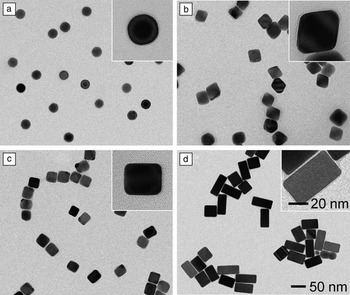
Nanocrystal synthesis is typically conducted using a single-pot approach, in which nucleation and growth are entangled. The experimental conditions needed for generating one particular type of seed are not necessarily well-suited for the growth process. As a result, seed-mediated growth has recently emerged as a powerful and productive route to the synthesis of metal nanocrystals with well-controlled sizes, shapes, elemental compositions, and structures that would be otherwise inaccessible by the single-pot methods.Reference Xia, Zeng, Zhang, Moran and Xia 32 In addition, seed-mediated growth can also be used to investigate many of the fundamental aspects of nanocrystal synthesis, including the explicit roles played by the capping agent and the impact of growth kinetics. For example, we recently designed an experiment based on seed-mediated growth to single out the roles played by citrate ions and PVP in the shape evolution of single-crystal seeds.Reference Zeng, Zheng, Rycenga, Tao, Li, Zhang, Zhu and Xia 33 We conducted two parallel syntheses under identical reaction conditions except for the introduction of sodium citrate or PVP as the capping agent. Specifically, the syntheses involved the use of silver single-crystal spheres with a diameter of 28 nm as the seeds ( Figure 3 a), together with L-ascorbic acid, silver nitrate, and citrate (or PVP) serving as the reductant, precursor, and capping agent, respectively, in an aqueous system. In the presence of citrate as a capping agent, we obtained silver octahedrons of 40 nm in edge length (Figure 3b). In contrast, the use of PVP as a capping agent resulted in the formation of silver nanocubes and nanobars (Figure 3c) from the same spherical seeds. The surfaces of both nanocubes and nanobars were enclosed by {100} facets, which can be selectively passivated and stabilized by PVP. The formation of silver nanobars was likely caused by slow growth kinetics (see the discussion in the next section). This can also be attributed to the selective activation (due to etching) and thus accelerated growth of a specific face of a nanocube.Reference Xiong, Cai, Wiley, Wang, Kim and Xia 34 As evidence to support the etching mechanism, we found that silver nanobars could be grown with controllable aspect ratios by introducing bromide ions into the reaction solution (Figure 3d).Reference Zhang, Moran, Xia, Rycenga, Li and Xia 35
Shape control of silver nanocrystals through a combination of surface capping and seed-mediated growth. (a) TEM image of spherical, single-crystal silver seeds. (b‒d) TEM images of different types of silver nanocrystals grown from the single-crystal seeds in the presence of: (b) sodium citrate, (c) PVP, and (d) a bromide salt. The insets show TEM images of individual nanocrystals at a higher magnification. The scale bar in (d) and the inset of (d) applies to all other images. (a‒c) Modified with permission from Reference 33. © 2010 American Chemical Society. (d) Modified with permission from Reference 35. © 2012 American Chemical Society.

Extension from silver to other metals
What we have learned from the synthesis of silver nanocrystals can be readily extended to other metals, in particular to those with a face-centered cubic structure similar to silver.Reference Xia, Xiong, Lim and Skrabalak 10 , Reference Xiong and Xia 31 , Reference Zhang, Jin, Xiong, Lim and Xia 36 – Reference Kim, Yu, Cho, Ma, Park and Xia 38 This transferrable knowledge includes the correlation between the crystallinity of a seed and the shape taken by the final product, the role of capping agent in determining the area proportions of different facets, and the possible involvement of oxidative etching in both the nucleation and growth steps. Of course, due to their differences in electronic structure and chemical reactivity (or the standard reduction potential), we have to identify the right combination of experimental conditions for a specific metal and an explicit shape.
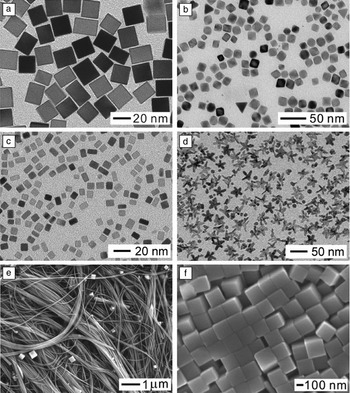
Considering palladium as an example, we could obtain nanocrystals with all different shapes that we demonstrated for silver, including nanocubes ( Figure 4 a), octahedrons (Figure 4b), and nanobars (Figure 4c).Reference Xiong and Xia 31 , Reference Zhang, Jin, Xiong, Lim and Xia 36 These two metals share similar mechanisms for nucleation and growth, including the use of oxidative etching to eliminate seeds with twin defects. However, the capping agents for these two metals are quite different, with PVP being most effective for Ag(100) surfaces and bromide ions working best for Pd(100) surfaces. Due to the involvement of oxidative etching, the ionic ligand released from the precursor during a synthesis may also cause alterations to the shape or morphology displayed by the product. For example, starfish-like rhodium nanocrystals with a fivefold twin structure (Figure 4d) could be obtained in high yields via polyol reduction by replacing the conventional RhCl3 or Na3RhCl6 precursor with [Rh(CF3COO)2]2.Reference Zhang, Xia, Li, Zeng, Dai, Yang and Xia 24 The success of this synthesis can be attributed to the use of a chloride-free precursor to completely prevent oxidative etching during the synthesis. Our mechanistic study suggests that both decahedral and icosahedral nanocrystals of rhodium were formed in the early stages of synthesis, and branched arms then evolved from the five corners of decahedral nanocrystals along the <110> direction to form starfish-like nanocrystals at the expense of icosahedral nanocrystals, as driven by Ostwald ripening.
Shape-controlled synthesis of nanocrystals for metals other than silver. (a‒c) TEM images of palladium nanocubes, octahedrons, and nanobars, respectively. Modified with permission from Reference 36. © 2013 American Chemical Society. (d) TEM image of fivefold twinned, starfish-like rhodium nanocrystals. Modified with permission from Reference 24. © 2010 Wiley-VCH. (e–f) SEM images of copper nanowires and nanocubes, respectively. Modified with permission from Reference 37. © 2011 Wiley-VCH.

Most recently, we also extended the synthetic strategy to copper, a metal that is more reactive and thus more difficult to handle than silver. Specifically, we demonstrated the synthesis of copper nanocrystals with controlled shapes in high purity and quality by reducing copper chloride with glucose in an aqueous system in the presence of hexadecylamine (HDA) as a capping agent for the Cu(100) surface.Reference Jin, He, Zhang, Zeng, Xie and Xia 37 The success of this approach relies on the ability of glucose to reduce cupric ions to elemental copper, the ability of HDA to selectively bind to Cu(100) rather than Cu(111), and the feasibility to manipulate the distributions of single-crystal versus multiple twinned seeds by varying the concentration of HDA to manipulate oxidative etching. At a high concentration of HDA, multiple twinned seeds prevailed as oxidative etching was blocked due to the effective capping and protection by HDA. The seeds then evolved into pentagonal wires with diameters as thin as 24 nm and lengths up to several millimeters (Figure 4e). When oxidative etching was allowed at a relatively low concentration of HDA, single-crystal seeds were formed, followed by their growth into nanocubes (Figure 4f). The reduction rate also played a major role in determining the morphology of the resultant copper nanowires, with slow reduction leading to pentagonal nanowires with uniform diameters and fast reduction to pentagonal bipyramids and then tadpole-like nanowires with tapered diameters.
Site-selected overgrowth
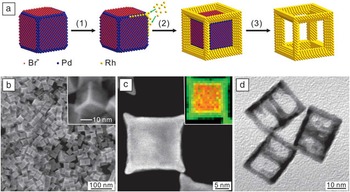
The concept of seeded growth can be applied to all types of seeds that may have different shapes and/or crystallinity. When nanocrystals with a well-defined shape are used as the seeds, we have to take into consideration the possible difference in “availability” for atomic deposition between various types of facets or sites on the surface. For example, when palladium nanocubes are synthesized in the presence of bromide ions, the {100} side faces will be capped by the bromide ions due to chemisorption and thus blocked for growth while the corner and edge sites, covered by {111} and {110} facets, respectively, will be available for growth.Reference Xie, Lu, Xie, Wang, Kim and Xia 39 As a result, when a rhodium compound was introduced at a relatively slow rate using a syringe pump to avoid self-nucleation and thus achieve kinetically controlled growth, the newly formed rhodium atoms could only nucleate at the corner and edge sites of the seed ( Figure 5 a). With the deposition of rhodium atoms at all corners and edges, we eventually obtained palladium-rhodium bimetallic nanocubes with a core-frame structure and concave surfaces covered by Pd{100} and Rh{110} facets (Figure 5b–c).
Synthesis of palladium-rhodium core-frame concave nanocubes and cubic nanoframes of rhodium by site-selected overgrowth and selectively etching away the palladium cores. (a) Schematic illustration of the mechanism. (b) SEM image of palladium-rhodium core-frame concave nanocubes. The inset shows SEM image of an individual palladium-rhodium core-frame concave nanocube at a higher magnification. (c) High-angle annular dark-field scanning TEM (HAADF-STEM) image together with the energy-dispersive x-ray (EDX) mapping (inset) of an individual palladium-rhodium concave nanocube. (d) TEM image of rhodium cubic nanoframes. Modified with permission from Reference 39. © 2012 Wiley-VCH.

Significantly, the palladium cores could be selectively dissolved from the core-frame nanocubes using an aqueous etchant containing ferric and bromide ions, generating cubic nanoframes of rhodium with a highly open structure (Figure 5d). In principle, this strategy based on site-specific overgrowth and selective etching can also be extended to other combinations of materials to generate nanocrystals with highly open structures and related properties.
Kinetic control and unsymmetrical growth
In addition to the thermodynamic approach based on the use of capping agents to alter the free energies of different facets,Reference Xia, Zeng, Zhang, Moran and Xia 32 kinetic control is another powerful means to control the shape of metal nanocrystals. The concept of kinetic control is based on the manipulation of growth rate at which atoms are generated from a precursor and added to the surface of a growing seed.Reference Zhang, Li, Jin, Zeng, Yu, Yang and Xia 40 When a synthesis is under kinetic control, it is no longer necessary to achieve the lowest total surface free energy as required by thermodynamic control.
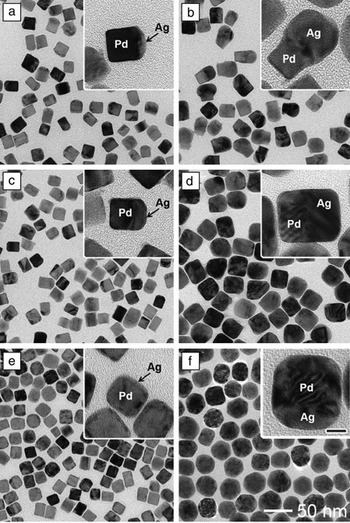
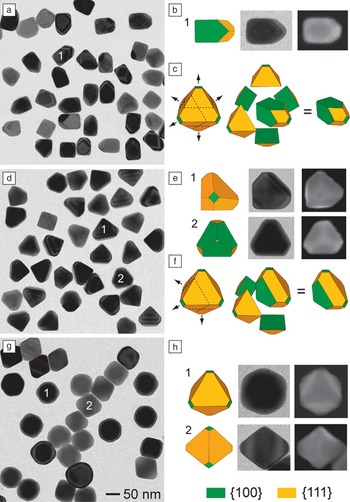
By carefully controlling the reaction kinetics, newly formed atoms can be selectively added to specific sites rather than the entire surface of a growing seed, leading to unsymmetrical growth patterns. For example, we recently demonstrated a new approach to the synthesis of novel palladium-silver bimetallic nanocrystals with asymmetrical structures.Reference Zeng, Zhu, Tao, Jin, Zhang, Li, Zhu and Xia 41 The typical synthesis involved the use of 18 nm palladium nanocubes as seeds in an aqueous system, with ascorbic acid, silver nitrate, and PVP serving as the reductant, precursor to silver, and stabilizer, respectively. We found that the growth of a palladium cubic seed could be directed to selectively take place on one, three, or six of the faces of a cubic seed by simply increasing the injection rate of silver nitrate, resulting in the formation of palladium-silver hybrid dimers, palladium-silver non-concentric nanocubes, and palladium-silver concentric core-shell nanocubes, respectively ( Figure 6 ). Most recently, we further extended this strategy to the silver system. Growth could be directed to occur on one, three, and six of the faces of a silver cubic seed to generate silver 5/6-truncated octahedrons, 3/6-truncated octahedrons, and conventional octahedrons, respectively ( Figure 7 ).Reference Xia and Xia 42
Synthesis of different types of palladium-silver bimetallic nanocrystals by controlling the injection rate of silver nitrate solution during the growth of palladium cubic seeds. (a, b) TEM images of palladium-silver hybrid dimers obtained by injecting the precursor solution at 1 mL/h; the total addition volumes were (a) 0.4 and (b) 2.7 mL. (c, d) TEM images of palladium-silver non-concentric nanocubes obtained by injecting the precursor solution at 30 mL/h, the total volumes added were (c) 0.5 and (d) 3.3 mL. (e, f) TEM images of palladium-silver concentric core-shell nanocubes obtained by adding all the precursor solution at one time using a pipette, the total volumes added were (e) 0.5 and (f) 3.3 mL. The insets are individual nanocrystals at a higher magnification. The scale bar in the inset of (f) is 10 nm and applies to all other insets. Modified with permission from Reference 41. © 2012 Wiley-VCH.

Synthesis of silver nanocrystals with unsymmetrical shapes by controlling the injection rate of silver nitrate solution during the growth of silver cubic seeds. (a‒c) TEM image, an example, and a 3D model of the silver 5/6-truncated octahedrons, respectively, that were prepared at an injection rate of 0.7 mL/h for the precursor solution. (d‒f) TEM image, examples, and a 3D model of the silver 3/6-truncated octahedrons, respectively, that were prepared at an injection rate of 8.0 mL/h for the precursor solution. (g, h) TEM image and examples of the silver conventional octahedrons, respectively, that were prepared at an injection rate of 100 mL/h for the precursor solution. The 50 nm scale bar in (g) also applies to (a) and (d). Modified with permission from Reference 42. © 2012 American Chemical Society.

We believe the kinetically controlled collision of newly formed silver atoms with different facets of a palladium or silver cubic seed is mainly responsible for the asymmetrical growth patterns. When the injection rate of the precursor was sufficiently slow, the concentration of silver atoms around a cubic seed was too low to ensure collision and nucleation on all the six faces of a cubic seed. As a result, only one of the six faces of a seed could be deposited with the silver atoms. A similar mechanism was involved when the precursor was injected at a moderate rate, at which three of the six faces could receive silver atoms. At a fast injection rate, a larger amount of silver atoms was generated at any moment to interact with the surface of seed. In this case, each one of the six faces of a cubic seed would have the same chance to receive the newly formed silver atoms so growth would occur on the entire surface. This new approach based on kinetic control has also been extended to other systems such as palladium-gold, and it should provide a general strategy for breaking the symmetry of a cubic lattice and thus fabricating metal nanocrystals with highly unsymmetrical shapes.Reference Zhu, Zeng, Tao, Johnson, Schmidt-Krey, Blubaugh, Zhu, Gu and Xia 43
Metal transformation via galvanic replacement
Galvanic replacement occurs spontaneously when a metal is in contact with ions of another metal having a higher electrochemical potential in a solution phase.Reference Sun, Mayers and Xia 44 While atoms of the first metal are oxidized into ions and dissolve into the solution, ions of the second metal are reduced into atoms and are deposited on the surface of the first metal. In a single step, an object (or sacrificial template, with dimensions ranging from macro- to nanoscale) of the first metal can be readily transformed into a hollow structure of the second metal. While the dimensions of the void in the resultant structure are the same as the other dimensions of the original object, the thickness of the wall is largely determined by the amount of ions for the second metal. This simple reaction can be applied to a wide variety of metal templates and salt precursors and is limited by little more than the requirement of an appropriate difference in the electrochemical potentials between the two metals involved. This reaction provides a straightforward and versatile route to the preparation of a broad range of complex nanomaterials, including hollow nanostructures with tunable and controllable optical properties.
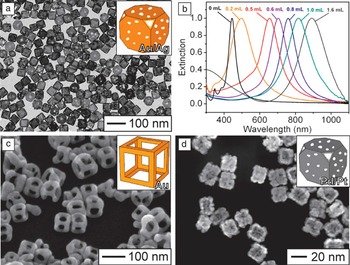
Due to the relatively high reactivity of silver, nanocrystals made of this metal are excellent templates for the fabrication of hollow and porous nanostructures (known as nanocages) made of gold, palladium, and platinum.Reference Wiley, Sun and Xia 45 Figure 8 a shows a typical TEM image of silver-gold nanocages that were obtained by reacting silver nanocubes of 40 nm in edge length with gold (III) chloride hydrate (HAuCl4) in an aqueous solution under refluxing. By introducing different amounts of HAuCl4 in a manner similar to titration, we could easily tune the wall thickness of the resultant nanostructures with an accuracy of 0.5 nm, and at the same time tune their LSPR peaks all the way from the visible to the near-infrared region (Figure 8b).Reference Skrabalak, Au, Li and Xia 46 Thanks to their strong absorption and scattering cross-sections in the transparent widow of soft tissue, the silver-gold nanocages are finding use as theranostic agents (i.e., agents for both diagnosis and therapy) for a variety of biomedical applications, including cancer diagnosis, cancer treatment, controlled release, and drug delivery.Reference Xia, Li, Cobley, Chen, Xia, Zhang, Yang, Cho and Brown 47 By modifying the experimental procedures, it was also possible to fabricate gold nanoframes (Figure 8c) with an extremely open structure.Reference Au, Chen, Zhou, Camargo, Lim, Li, Ginger and Xia 48 These nanoframes also displayed tunable LSPR peaks in the near-infrared region. Most recently, we have demonstrated the synthesis of palladium-platinum nanostructures by reacting templates made of palladium nanocrystals with a platinum salt precursor (Figure 8d).Reference Zhang, Jin, Liu, Wang, Kim, Yang, Xie, Liu and Xia 49 Such bimetallic nanostructures show great promise as catalysts for the oxygen reduction reaction (ORR) and preferential oxidation of hydrogen (PROX) in excess carbon monoxide, both important for fuel cell technology.
Hollow nanostructures with porous walls prepared via the galvanic replacement reaction. (a) Typical TEM image of silver-gold nanocages that were prepared by reacting 40 nm silver nanocubes with gold (III) chloride hydrate in an aqueous solution under refluxing. (b) UV-visible absorbance spectra recorded at different stages of the galvanic replacement reaction, where the injection volumes for gold (III) chloride hydrate solution are labeled above the peaks. Modified with permission from Reference 46. © 2007 Nature Publishing Group. (c) SEM image of gold nanoframes. Modified with permission from Reference 48. © 2008 Springer-Verlag. (d) SEM image of palladium-platinum nanocages. Modified with permission from Reference 49. © 2011 American Chemical Society. The insets in (a), (c), and (d) show 3D models of the corresponding nanostructures.

Conclusion
In 1959, physicist Richard Feynman made a bold statement in his famous speech: “There is plenty of room at the bottom…,”Reference Feynman 50 which is considered to be the debut of nanoscience and nanotechnology. Over the past few decades, both nanoscience and nanotechnology have advanced to a level with many appealing examples of applications in electronics, photonics, information storage, catalysis, energy, environmental science, and biomedical research. As the enablers of all these applications, nanomaterials and their controlled syntheses play a pivotal role in these new developments. As we have illustrated in this article, most of the metal nanocrystals could be prepared by using chemistry in the form of redox reaction, kinetic control, surface chemisorption, and galvanic replacement. Significantly, most of these chemical syntheses discussed in this article are simple enough to be routinely conducted.
We have to emphasize that our current understanding of most syntheses is far from being able to present an atomistic picture for the evolution pathway from a precursor compound to the final nanocrystal. In a zero-order approach, a typical synthesis can be divided into three distinct steps: nucleation, evolution of nuclei into seeds, and growth of seeds into nanocrystals. While structural fluctuation between different configurations is inherently associated with the nuclei, it is no longer an option for the seeds. As a result, it has been feasible to elucidate the correlations between the seeds and nanocrystals through electron microscopy analysis. However, the evolution from nuclei to different types of seeds remains a black box. Searching for this kind of correlation should continue to be the focus of research in this area.
Acknowledgments
Our research on this subject was supported in part by a number of funding agencies, including NSF (DMR), NIH (NCI and NIBIB), ACS (PRF), ONR, DARPA, DOE, the Dreyfus Foundation, the Sloan Foundation, and the Packard Foundation. We are grateful to former group members and our collaborators for their invaluable contributions to this research over the past decade.

Younan Xia has been the Brock Family Chair and Georgia Research Alliance (GRA) Eminent Scholar in Nanomedicine at the Georgia Institute of Technology since 2012. He holds joint appointments in the Department of Biomedical Engineering, School of Chemistry and Biochemistry, and School of Chemical and Biomolecular Engineering. Xia received his BS degree from the University of Science and Technology of China (USTC) in 1987, his MS degree from the University of Pennsylvania in 1993, and his PhD in physical chemistry from Harvard University (with Professor George M. Whitesides) in 1996. He started as an assistant professor of chemistry at the University of Washington (Seattle) in 1997, and was promoted to associate professor and professor in 2002 and 2004, respectively. He joined the Department of Biomedical Engineering at Washington University in St. Louis in 2007 as the James M. McKelvey Professor for Advanced Materials. His current research interests include nanomaterials, biomaterials, nanomedicine, regenerative medicine, imaging, electrospinning, and colloidal science. Xia can be reached by email at younan.xia@bme.gatech.edu.

Xiaohu Xia has been a postdoctoral fellow in the Xia group at the Georgia Institute of Technology since April 2012. He received his BS degree in biotechnology (2006) and his PhD degree in biochemistry and molecular biology (2011) from Xiamen University, China. He worked as a visiting graduate student at Washington University in St. Louis from October 2009 to November 2011. He joined the Xia group as a postdoctoral fellow in April 2012. His current research interests include the design and synthesis of nanostructures and exploration of their applications in catalysis and biomedicine. Xia can be reached by email at xiaohu.xia@bme.gatech.edu.

Yi Wang is currently pursuing his PhD degree in analytical chemistry from Southwest University (SWU), China. He received his BS degree in chemistry from SWU in 2007. He joined the Xia group in September 2011 as a jointly supervised student. Wang’s research interests include the synthesis and self-assembly of metal nanostructures, as well as their applications in biomedicine and analytical chemistry. Wang can be reached by email at yi.wang@bme.gatech.edu.

Shuifen Xie is pursuing his PhD degree in nanomaterials chemistry at Xiamen University, China (with Professor Zhaoxiong Xie). He received his BS degree in chemistry from Xiamen University in 2007. He joined the Xia group in September 2011 as a jointly supervised student. Xie’s research interests include the shape-controlled synthesis of metal and metal-oxide nanostructures with a focus on their catalytic applications. Xie can be reached by email at shuifen.xie@bme.gatech.edu.