

1. Introduction
The fact that differences in vowel articulation are important in distinguishing accents of English is well established (Wells, Reference Wells1982; Cruttenden, Reference Cruttenden2008; Ng, Chen & Sadaka, Reference Ng, Yang and Sadaka2008; Park, Reference Park2009a, Reference Park2009b). It is also the case that speakers' production of a particular vowel varies for an individual speaker and between speakers of the ‘same’ accent (Rose, Reference Rose2002; Cruttenden, Reference Cruttenden2008). In terms of perception, it is evident that L1 speakers, i.e. speakers for whom the language is the first language or one of the first languages acquired, are often able to recognise vowel articulations which deviate from the norm in their accent, even when the difference in vowel production is not significant enough to be mapped onto another L1 phoneme category, i.e. where the use of the alternative vowel quality could potentially change the meaning of the word (Park, Reference Park2009a). It should be acknowledged that any such norms are likely to vary in accordance with generational changes to a particular variety. But studies seeking to establish the degree of interrelatedness of vowel production and speakers' perceived ideal realisation have had mixed results. For example, Hoopingarner (Reference Hoopingarner2004) found that L1 speakers' production and preferred realisation were relatively similar, while Ainsworth & Paliwal (Reference Ainsworth and Paliwal1984) and Frieda, Walley, Flege & Sloane (Reference Frieda, Walley, Flege and Sloane2000) failed to demonstrate such a correlation.
There is a lack of research investigating the question of how much variation in vowel articulation listeners find native-like and how such perceptual judgements overlap with their speech production, although work has been done on the issue of how much slightly foreign-accented speech native speakers need to hear to categorise an accent as foreign (Park, Reference Park2009a, Reference Park2009b). Research in this area would potentially be useful for speech synthesis, and it could be beneficial in language teaching insofar as learners may wish to seek to approximate native-speaker targets, and in related areas such as accent coaching for actors. In addition, information about L1 speakers' categorisation of non-native-like vowel qualities may be relevant to those involved in training L1 speakers who wish to teach their L1 to L2 speakers. This study will examine these issues with reference to the RP or near-RP English LOT and THOUGHT vowels (Wells, Reference Wells1982). In this examination, ‘nativeness’ refers to how similar realisations are to pronunciations associated with native speakers of an RP or near-RP accent of English in particular.
Our focus is on LOT and THOUGHT, as the distinction between them is presumed to depend mainly on quality for L1 speakers, with LOT being a low back rounded vowel and THOUGHT being a close-mid back rounded vowel (Cruttenden, Reference Cruttenden2008; Gimson, Reference Gimson1945–1949). However, it should be pointed out that these vowels also vary in length, LOT being shorter than THOUGHT when the phonetic environment is controlled for, i.e. both vowels are followed by a consonant with the same degree of lenition (Cruttenden, Reference Cruttenden2008). Duration is not manipulated in the perception tests associated with the present study, as its focus is on the perception of differences in vowel quality.
In the light of the issues identified in this section, the research questions are as follows:
1. What range of variation is found in L1 speakers of RP or near-RP for the LOT and THOUGHT vowels?
2. What amount of variation is permissible for native-sounding perceptions of LOT and THOUGHT vowels by L1 speakers of RP or near-RP?
3. How does young L1 RP or near-RP speakers' production of the LOT and THOUGHT vowels overlap with the parts of the auditory-acoustic phonetic space that are associated with native-like pronunciation perception?
2. Method
2.1 Participants
Seven normal-hearing 18- to 25-year-old female RP and near-RP speakers studying at the Universities of Leeds, York and Reading were recruited to this study. Here, near-RP is defined as including accents which are close to RP but which may incorporate some potentially localisable features which do not deviate too markedly from the RP norm, e.g. some features of London English such as vocalisation of /l/ (Cruttenden, Reference Cruttenden2008: 82). This was judged unproblematic, since LOT and THOUGHT variation is not marked within England (Cruttenden, Reference Cruttenden2008), although THOUGHT may be considerably more open in Northern than in Southern English speech: participants with such a THOUGHT vowel were not recruited to the study. Important positive characteristics of the chosen speakers included a distinction being maintained between the TRAP and BATH vowels. It was also decided that the L1 English participants should be monolingual: participants were considered monolingual if they did not report knowledge of any language other than English above beginner level.
2.2 Materials
A questionnaire was administered to ensure that the participants met the criteria relating to linguistic background, age, sex and hearing status. The study included a production test, whose purpose was to elicit production data of the LOT and THOUGHT vowels. There was also a perception test which was administered so that it could be established how the participants would judge different tokens of the LOT and THOUGHT vowels in terms of how RP-like they sounded. A Microsoft PowerPoint presentation was designed to be used as a prompt for a production test. It contained the following words and corresponding phonemic transcriptions: heed /hiːd/, Keith /kiːθ/, head /hed/, Etty /ˈeti/, had /hæd/, cat /kæt/, hard /hɑːd/, cart /kɑːt/, cot /kɒt/, odd /ɒd/, caught /kɔːt/, awed /ɔːd/, who'd /huːd/ and coot /kuːt/.
The words cot (for LOT) and caught (for THOUGHT) were included in the perception test. A range of relevant cot and caught stimuli were produced by synthesising, i.e. artificially manipulating the natural tokens, vowel qualities from tokens produced by one human speaker. This resulted in stimulus tokens being produced which varied in terms of vowel quality but which sounded like those which might be produced by an actual speaker.
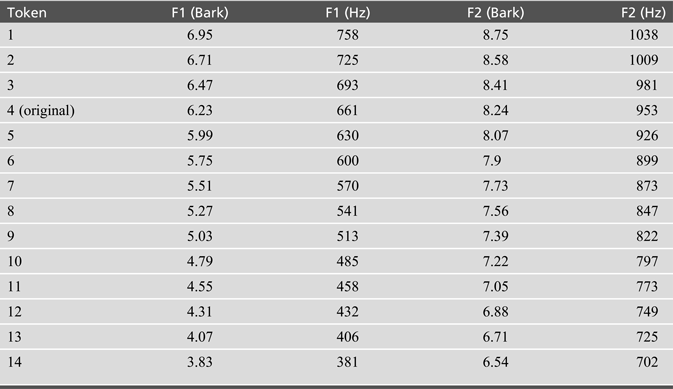
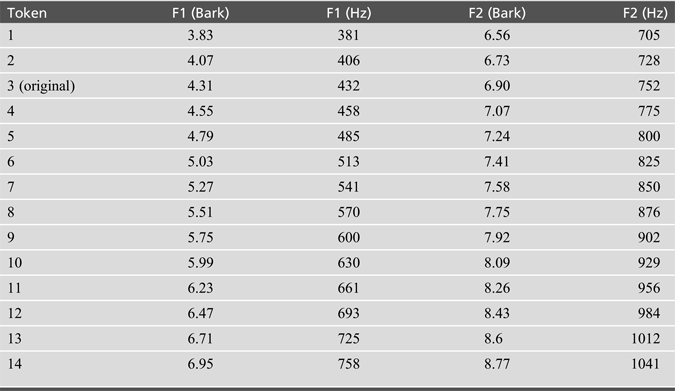
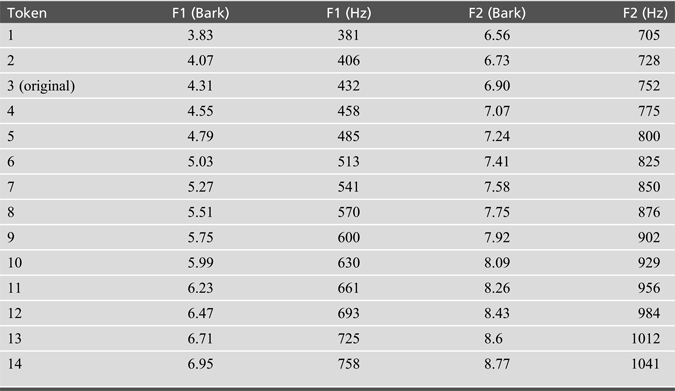
Synthesised tokens were created according to the following parameters. Formant measurements (F1, F2) were taken, as these formants reflect, in part, the degree of openness and backness of vowels. Eight auditorily equidistant steps between the natural tokens were calculated (i.e. a total of seven tokens were synthesised between the natural tokens), and three auditorily equidistant tokens with higher F1 and F2 than in natural cot, and two auditorily equidistant tokens with lower F1 and F2 than in natural caught, were also created. This ensured that the stimulus material covered a wide range of the relevant part of the auditory-acoustic phonetic space. Auditory equidistance was defined as an equal shift in Bark on the F1/F2 plane, i.e. the raw F1 and F2 values were converted into Bark, as the Bark scale more closely reflects how human listeners perceive the auditory distance between stimuli where F1 and F2 have been manipulated. The acoustic properties of the natural and synthesised tokens used as stimuli are given in Tables 1 and 2.
Midpoint F1 and F2 values of cot stimuli

Midpoint F1 and F2 values of caught stimuli
Considering that the speaker recorded was a speaker of near-RP, and that it is not entirely clear which acoustic features are most relevant in distinguishing between RP LOT and THOUGHT vowels, two phonetically trained L1 speakers of English familiar with RP were asked to judge all natural tokens as well as six synthesised tokens, including cot token 12 and caught token 11. The speakers agreed that the natural tokens were appropriate RP pronunciations of the relevant words, and judged the quality of the synthesised vowels native-like, confirming that F1 and F2 are most relevant in distinguishing between the RP LOT and THOUGHT vowels. They furthermore confirmed that the tokens were of adequate quality.
In order to elicit perception data, a PowerPoint presentation consisting of slides with a relevant sound file and a question regarding the pronunciation heard was designed. The wording of the question was consistently ‘How would you rate this pronunciation of “[word]”?’ and the suggested answers provided were always ‘1. Produced by a native speaker of Standard British English (RP)’, ‘2. Close to a native Standard British English (RP) speaker's pronunciation, but slightly odd’, ‘3. Clearly not a native Standard British English (RP) speaker's pronunciation, but still fairly appropriate for this word’, and ‘4. Seriously different from a Standard British English speaker's pronunciation, the word might sound as if it could be another English word’.
2.3 Procedures
Each testing session began with informed consent being obtained from the participants. After this, the production test, which involved the participants being audio-recorded in a quiet room while saying the words in the PowerPoint presentation, was administered. Immediately after the production test, the participants were introduced to the PowerPoint-based perception test. They were advised to read the question and alternative answers carefully, and that the question and alternatives would remain the same throughout the test with the exception of the word being asked about. It was made clear to the participants that they were asked to judge whether the tokens were similar to those of an RP speaker. Participants were instructed to play each sound file by double-clicking on the relevant icon, and to mark their preferred alternative by typing the symbol ‘x’ in the box provided. Participants were told that they could replay the sound file on each slide up to three times so as to complete the test in a timely manner, and were instructed not to go back to previous slides after making their initial decision. They were told that they could take breaks while doing the exercise, and the perception test was accordingly self-paced.
2.4 Data analysis
The production data were analysed acoustically using Praat speech analysis software (Boersma & Weenink, Reference Boersma and Weenink2008). The Freeman-Halton extension of Fisher's exact test (Freeman & Halton, Reference Freeman and Halton1951) was used to test whether any difference in the distribution of participants' responses was statistically significant for two-rows by four-columns contingency tables, using the relevant Vassar Stats calculator (Lowry, Reference Lowry2011a). This test was used because the expected value of many of the cells in the data was less than five, making this test more appropriate statistically than chi-squared tests (see Dancey & Reidy, Reference Dancey and Reidy2004: 284). A Pearson's chi-squared test of association was used for the same purpose for two-rows by two-columns tables where no value in any one cell was smaller than five (cf. Dancey & Reidy, Reference Dancey and Reidy2004: 284), using the appropriate Vassar Stats calculator (Lowry, Reference Lowry2011b). Where a chi-squared test was not appropriate due to there being a cell with a value of less than five in a two-rows by two-columns table, Fisher's exact test was used instead using the same Vassar Stats calculator.
3. Results
3.1 The production of the LOT and THOUGHT vowels
The raw measurements in Hz obtained from the participants' recordings are given in the Appendix, and minimum and maximum F1 and F2 measurements for their cot and caught tokens are shown in Table 3. The partial overlap between the two vowels for F2 but not for F1 suggests that F1 is the main acoustic feature which is used to distinguish the relevant vowels. This conclusion is further supported by the fact that there are instances where F1 is the only formant that changes enough to be perceptually salient for the same speaker. In particular, participant 7 has 538 Hz (5.24 Bark) for F1 and 1075 Hz (8.97 Bark) for F2 for her second cot token and 615 Hz (5.87 Bark) for F1 and 1061 Hz (8.89 Bark) for F2 for her second caught token. The difference of only 0.08 Bark for F2 between the two tokens for this minimal pair cannot be perceptible in practice (see Liu and Kewley-Port, Reference Liu and Kewley-Port2004). While F2 is typically higher for the LOT vowel than for the THOUGHT vowel, it cannot be considered essential in maintaining the distinction between the RP LOT and THOUGHT vowels, and will not be relied on in addressing the research questions in the rest of this chapter or in the Discussion and implications section.
Range of variation in F1 and F2 found for the LOT and THOUGHT vowels in cot and caught. Measurements in Hz.
The F1 measurements of the raw data presented in the Appendix are also provided in the Appendix converted into Bark. The data show that F1 for the LOT vowel varies between 5.87 and 6.71 Bark, with the variation between the minimum and maximum values being 0.84 Bark. With regard to the THOUGHT vowel, F1 varies between 4.15 and 5.35 Bark, the difference between the minimum and maximum values thus being 1.2 Bark.
3.2 Perception of the LOT and THOUGHT vowels
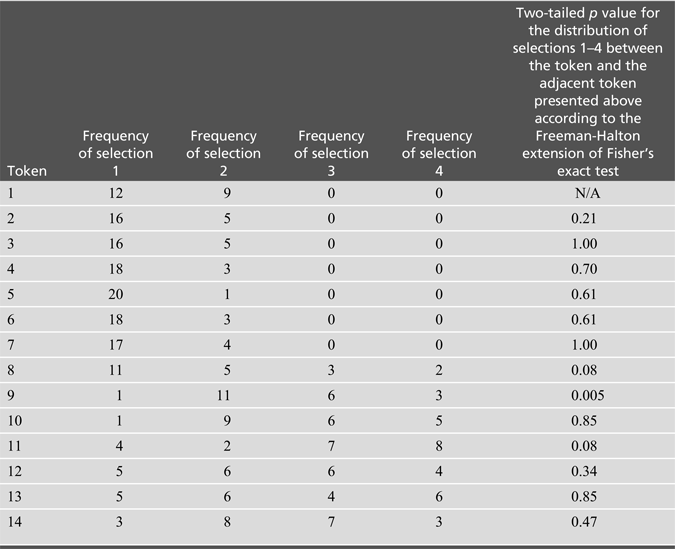
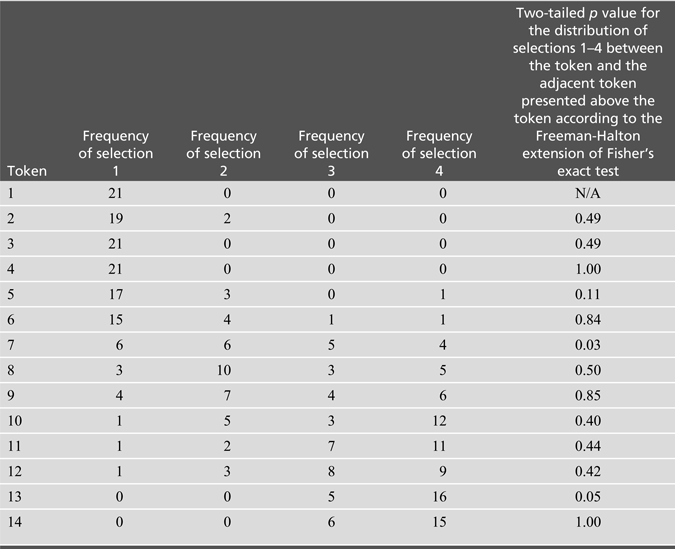
In order to assess which tokens are perceived as permissible for native-like LOT and THOUGHT vowels for the participants, and by extension the range of variation in F1 which is permissible, the Freeman-Halton extension of Fisher's exact test was used to assess whether any difference between the participants' judgements were statistically significant for adjacent cot and caught tokens. Table 4 shows the frequency of the seven L1 speakers' selection of alternatives 1, 2, 3 and 4 for the cot tokens and the results of the statistical analysis. Table 5 shows the same information for caught.
The seven participants’ selections for the cot tokens on the 4-point rating scale and the results of the Freeman-Halton extension of Fisher's exact test
The seven participants’ selections for the caught tokens on the 4-point rating scale and the results of the Freeman-Halton extension of Fisher's exact test
As Table 4 shows, there is no statistically significant (p ≤ .05) difference in the dispersion of selections relating to adjacent cot tokens from tokens 1 to 8. However, the difference between cot tokens 8 and 9 is p = .005, which is statistically highly significant (p ≤ .01). Since the group of tokens 1 to 8 has the highest proportion of selections of statement 1, which was the option the participants would choose when they decided that a token had been produced by a native speaker of RP, it must be concluded on the basis of the statistical analysis that the L1 speakers generally perceive those tokens as native-like for the LOT vowel. This corresponds to F1 being between 5.27 and 6.95 Bark.
As Table 5 shows, there are no statistically significant (p ≤ .05) differences between adjacent tokens in the perception data from tokens 1 to 6 for caught tokens. The difference between tokens 6 and 7, p = .03, is statistically significant. It is clear from the table that it is tokens 1 to 6 that are strongly associated with a large proportion of selections of statement 1, suggesting that the range of variation perceived as native-like for L1 speakers corresponds to these caught tokens. This equates to a difference between 3.83 and 5.03 Bark for F1.
3.3 The relationship between production and perception
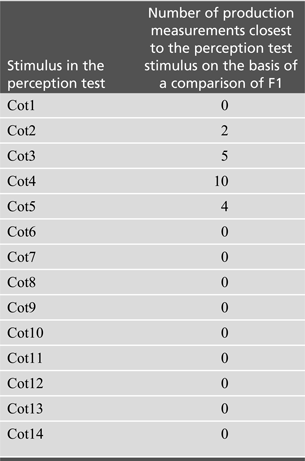
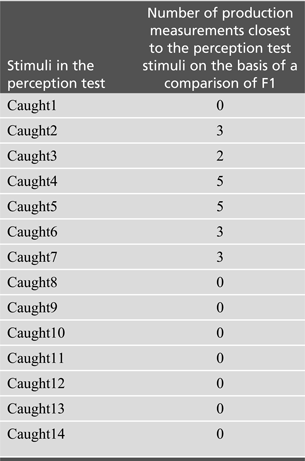
In order to pool perception data with production data, production data for cot and caught found in the Appendix must be related to the relevant cot and caught tokens, by assigning each of the measurements from the production test to the cot or caught token used in the perception test which is likely to be most similar to it in perception. This is achieved by relating each production test F1 measurement to the perception test token whose F1 measurement is closest to that of the relevant production test measurement. Table 6 shows how the measurements taken from the L1 speakers' recordings correspond to the stimuli as far as cot tokens are concerned, while Table 7 provides the equivalent information for caught tokens.
Distribution of production test measurements taken from the participants’ recordings related to the perception test stimuli for cot
Distribution of production test measurements taken from the participants’ recordings related to the perception test stimuli for caught
In order to assess the relationship between production and perception in the case of cot, tokens 1 to 8 should be treated as one group on the ground that these tokens are generally perceived as native-like in perception, and tokens 9 to 14 as the group not perceived as native-like in perception, as mentioned in section 3.2. Four of the tokens in the former group do not have a corresponding L1 speaker realisation in production, while four tokens in that group relate to such a realisation. This pair (1 and 6–8, 2–5) then needs to be compared with the latter group, which has six tokens (9–14) that do not have a corresponding L1 speaker realisation in production and no tokens which have a corresponding L1 speaker realisation. For these pairs, the Fisher exact test two-tailed p = .08 shows that the difference in terms of presence or absence of measurements from the native-speaker recordings is not statistically significantly different for the group perceived as native-like in perception, when compared to the group not perceived as native-like in perception as regards the LOT vowel. Inspection of the raw data reveals that this is because the participants judge a greater range of tokens to be native-like in perception, i.e. tokens 1 to 8, than is reflected in their production, in which only tokens similar to perception test tokens 2 to 5 are attested.
As far as caught is concerned, tokens 1 to 6 must be treated as the group perceived as native-like in perception, and tokens 7 to 14 as the group not perceived as native-like in that dimension. In this case there is one token in the former group for which no equivalent measurement is found in the production data, while five tokens do have equivalents in production. As to the latter group, there are seven tokens for which no equivalent measurement is found in the production data, while one token does have an equivalent in production. For these pairs, the Fisher exact test two-tailed p = .03 shows that the difference in terms of presence or absence of measurements from the native-speaker recordings is statistically significant for the group perceived as native-like in perception, compared to the group not perceived as native-like. This, in conjunction with examination of the raw data, which reveals that there is a tendency for there to be production test measurements equivalent to perception test stimuli generally identified as native-like, suggests that there is a significant relationship between the amount of variation identified as native-like in the perception test and the participants' own realisations of the THOUGHT vowel. However, it also needs to be pointed out that three realisations equivalent to perception test token 7 are found in the data, even though this stimulus is not generally perceived as native-like in the perception test.
4. Discussion and implications
4.1 The range of variation in F1 for the native or near-native RP speakers for the LOT and THOUGHT vowels
With regard to the first research question, the data show that F1 varies between 5.87 and 6.71 Bark for the cot tokens. F1 varies between 4.15 and 5.35 Bark for the caught tokens. Liu & Kewley-Port (Reference Liu and Kewley-Port2004) found that a formant change of 0.37 Bark was required for listeners to perceive a change in vowel quality when embedded in phrases or sentences. It is thus clear that the range of variation found within the LOT and THOUGHT vowels is sufficient for quality differences to be perceptible, with a greater range of variation being found for THOUGHT than for LOT. This agrees with Lindblom's (Reference Lindblom, Ohala and Jaeger1986) finding that speakers tend to utilise the acoustic vowel space by allowing for variation within phoneme categories. The implications of this are discussed in more detail later in this section.
4.2 The native or near-native RP speakers' perception of native-like LOT and THOUGHT
As far as the second research question is concerned, the findings show that participants generally perceive cot tokens 1 to 8 and caught tokens 1 to 6 as native-like: F1 varied between 5.27 and 6.95 Bark for cot tokens 1 to 8 and between 3.83 and 5.03 Bark for caught tokens 1 to 6. As Liu & Kewley-Port (Reference Liu and Kewley-Port2004) demonstrated that a change of 0.37 Bark was required for a change in vowel quality to be perceptible when vowels are embedded in phrases or sentences, it is apparent from the data that perceptibly different qualities of the LOT and THOUGHT vowels are accepted by L1 speakers as native-like realisations of these vowels. This observation accords with the finding discussed earlier that there is a perceptible degree of variation in the production data, and supports Cruttenden's (Reference Cruttenden2008) statement that even those L2 learners who wish to sound native-like can be allowed a certain degree of variation in the realisation of target-language vowels.
4.3 The relationship between production and perception
Addressing research question 3, it is apparent from the findings relating to the LOT vowel that the L1 speakers allowed for more variation in perception than is reflected in their production. The range of variation in perception thus exceeds that which is found in production, even though a relatively broad range of the auditory-acoustic phonetic space is used (cf. Lindblom, Reference Lindblom, Ohala and Jaeger1986); L1 speakers allow for the pronunciations of others to be somewhat more different than is actually attested in L1 speech for this particular vowel.
Where the caught tokens were concerned, there were tokens equivalent to perception test tokens 2 to 7 in the L1 speakers' recordings, and tokens 1 to 6 were generally identified as native-like by these participants. The statistical analysis suggests that the findings relating to the caught tokens differ from the findings relating to cot, there being a strong relationship between production and perception for the THOUGHT vowel. In particular, it appears that, for the THOUGHT vowel, roughly the same range of the auditory-acoustic phonetic space is used in production as is regarded as native-like in perception. This is interesting considering that, in general, previous studies have had mixed results regarding the relationship between speech production and perception in the case of L1 speakers (cf. Ainsworth & Paliwal, Reference Ainsworth and Paliwal1984; Frieda, Walley, Flege & Sloane, Reference Frieda, Walley, Flege and Sloane2000; Hoopingarner, Reference Hoopingarner2004). The findings of this study suggest that such differences may be vowel-specific, with the relationship between the two dimensions being stronger for some vowels than for others. The difference between the two vowels in this regard might relate, in part, to word frequency, with speakers allowing more variation for sounds in the case of low frequency words such as cot as compared to words of higher frequency like caught. However, this is unlikely to be the main factor. It is probable that difference in duration between the vowels occurring in these words has a major impact.
With regard to THOUGHT, there are instances where realisations are equivalent to perception test token 7 in production, even though the L1 speakers do not typically judge realisations of that kind as native-like in perception. Considering the type of task, which specifically related to how native-like pronunciations of the word caught the stimuli were, this is somewhat surprising. As in Frieda, Walley, Flege & Sloane's (Reference Frieda, Walley, Flege and Sloane2000) study, where L1 speaker participants reported hyperarticulated variants of L1 sounds as most appropriate, L1 speakers seem to have a slightly different perception of what is native-like than is reflected in their production. However, it also needs to be acknowledged that, although pooling the production data with the perception data on the basis of F1 alone seems to be generally effective both on theoretical and practical grounds, other factors such as higher formant frequencies and amplitude may have a more prominent role than is assumed here, which may be more prevalent in borderline areas.
Appendix: Formant measurements obtained from the recordings in Hz and Bark
 JUSSI WIKSTROM is a PhD student at the University of Cambridge. His main research interests lie in sociophonetics and phonological acquisition. He is also interested in approaches to sampling and inferential statistical analysis in phonetics. He has previously conducted research on speech and language therapy students' production and perception of cardinal vowels. His doctorate focuses on sociophonetic variation in South Atlantic St Helenian English. Email: jussiwikstrom@hotmail.com