Implications
A meta-analysis of selenium (Se) supplementation trials was performed to synthesize reported findings to arrive at a model for Se accumulation in various chicken tissues. Statistical analysis showed that the factors associated with tissue Se concentration are the type of chicken, the source of Se, the type of tissue and the analytical method used. Tissue Se concentration was correlated with Se added to feed and to glutathione peroxidase activity. The results of the present study can be useful to scientists as well as application areas, as meta-analysis findings are applicable to the totality of exposure situations.
Introduction
Selenium (Se) is an essential trace element of fundamental importance for optimal animal and human health primarily because of its antioxidant activity. It has chemopreventive, anti-inflammatory, antiviral properties and is related in enhancing immunity (Rayman, Reference Rayman2012; Steinbrenner et al., Reference Steinbrenner, Speckmann and Sies2013). The health-related properties of Se include but are not limited to protection against cancer, proper function of thyroid gland, and protection against cardiovascular and muscle disorders (Mao and Teng, Reference Mao and Teng2013; Rocourt and Cheng, Reference Rocourt and Cheng2013). Se becomes cotranslationally incorporated into the polypeptide chain as part of the amino-acid selenocysteine (SeCys). Proteins that contain SeCys as an integral part of their polypeptide chain are defined as selenoproteins (Sel) and are present in all lineages of life (Schomburg, Reference Schomburg2012). The major families of Sel include that of glutathione peroxidases, thioredoxin reductases (TRxR) and iodothyronine deiodinases (Pappas et al., Reference Pappas, Zoidis, Surai and Zervas2008; Zoidis et al., Reference Zoidis, Pappas, Georgiou, Komaitis and Fegeros2010).
In feed compounds of plant origin, Se occurs as part of an organic compound predominantly, selenomethionine (SeMet). Plant absorption of Se principally depends on the concentration and physicochemical forms existing in the soil. In chicken, to maintain high productive and reproductive performance, diets are usually supplemented with Se. This supplementation is an effective way to prevent Se deficiency and its associated problems, especially in combination with low vitamin E supply such as nutritional encephalomalacia, exudative diathesis and nutritional pancreatic atrophy (Pappas and Zoidis, Reference Pappas and Zoidis2012). Se is added either as an inorganic salt (sodium selenite, calcium selenite or sodium selenate) or as an organo-Se compound more often in the form of Se-yeast. SeMet is the predominant form of Se in most Se-enriched yeast products (Whanger, Reference Whanger2002). Other forms of organo-Se compounds include Se malt (Liu et al., Reference Liu, Zhao, Liu and Wang2009) and B-Traxim Se (Leeson et al., Reference Leeson, Namkung, Caston, Durosoy and Schlegel2008). Absorbed Se can be incorporated into tissue proteins in place of methionine or can be further metabolized in the liver and used for the synthesis of specific Sel.
The populations of many countries have a dietary Se intake below that of 55 μg/day, which is recommended by health regulatory bodies such as the Institute of Medicine in USA and the European Food Safety Authority (Institute of Medicine, Food and Nutrition Board, 2000; Combs, Reference Combs2001; Rayman, Reference Rayman2005; European Food Safety Authority (EFSA), 2009; Fairweather-Tait et al., Reference Fairweather-Tait, Bao, Broadley, Collings, Ford, Hesketh and Hurst2011). European countries such as Greece, (Pappa et al., Reference Pappa, Pappas and Surai2006), Poland (Wasowicz et al., Reference Wasowicz, Gromadzinska, Rydzynski and Tomczak2003), United Kingdom (Barclay et al., Reference Barclay, MacPherson and Dixon1995), Spain (Díaz-Alarcón et al., Reference Díaz-Alarcón, Navarro-Alarcón, López-García de la Serrana and López-Martínez1996) and Croatia (Matec et al., Reference Matec, Blanusa and Grgic2000) have an average daily Se intake below 40 μg, and this seems to be the case for other parts of the world. For instance, it has been estimated that the average intake of Se for adult men and women in Argentina is 32 and 24 μg/day, respectively (Sigrist et al., Reference Sigrist, Brusa, Campagnoli and Beldoménico2012). To help meet the recommended dietary allowance (RDA), consumers should avail of functional foods use. Technology of production of Se-enriched eggs, meat and milk has been developed and successfully introduced in various countries worldwide. Indeed, Se-enriched eggs are produced in more than 25 countries worldwide (Surai, Reference Surai2006). Se is added to laying hen diets (Pappas et al., Reference Pappas, Acamovic, Sparks, Surai and McDevitt2005a) and/or broiler diets (Pappas et al., Reference Pappas, Karadas, Surai and Speake2005b) and successfully deposited to eggs or broiler tissues. Many controlled randomized feeding trials have investigated the factors influencing accumulation of Se in eggs and various chicken tissues, with considerable variation in results. When controversial and/or variable results across individual studies are obtained, a meta-analysis can be carried out in an attempt to draw concrete conclusions by combining appropriately weighted studies in a coherent manner.
The present study presents a meta-analysis of numerous reported studies aiming at: (a) undentifying significant factors that affect tissue Se accumulation in chickens after Se supplementation in feed and (b) estimating correlation(s) between Se accumulation and the expression of antioxidant enzymes.
Material and methods
Data sourcing and inclusion criteria
Potential studies for use in the meta-analysis were found from a search of journals, conference proceedings, and book articles in abstract and other electronic databases (Academic Onefile, AGRICOLA, BIDS, Biochemistry and Biophysics Citation Index, BioInfoBank Library, Biological Abstracts, Biosis Previews, Cab Abstracts, Elsevier biobase-CABS, EMBASE, Current Contents/Life Sciences, EMBiology, Google Scholar, IBIDS (International Bibliographic Information on Dietary Supplements), IngentaConnect, MEDLINE, NLM Gateway, OvidSP, PubMed, Science Direct (Journal), Scopus, Wilson Web), and in the libraries of the Universities of Cambridge (UK) and Athens (Greece).
Indices used during the search were combinations and appropriate truncations and forms of the terms ‘selenium’, ‘Se’, ‘chicken’, ‘broiler’, ‘hen’, ‘egg’, ‘diet’, ‘dietary’, ‘feed’, ‘nutrition’, ‘poultry’ and any plurals thereof. Published information in English up to and including the publication year 2011 (3rd quartile) was considered. Experiments were sought on chickens fed fixed Se concentration on a daily basis throughout the experimental period examined. Allowed experimental designs involved controlled randomized feeding trials, with both serial slaughter and experiments, with only one time of slaughter for several groups of chickens receiving different doses and chemical forms of Se. From an initial database of 3497 articles on various aspects of Se and chicken, 35 feeding trials involving 837 chickens in a total of 140 treatment and control groups were identified for inclusion in the meta-regression. Most of the experiments include several treatment groups and one control group (The list of references used for the meta-analysis is given in Supplementary Material S1).
Range of interest, data extraction and the data set
The range of interest of this study was limited to exclude excessively low or high exposures to Se, because of the limited relevance in the field. It covers and exceeds (by a factor of 30) the maximum authorized total Se contents in feed in EU for farm animals (background Se plus supplemented one), which is 0.5 p.p.m. of complete feeding stuffs with a moisture content of 12% (European Union Commission (EU), 2004). The results apply to the same range of exposure situations: maximum values of 15 p.p.m. dry matter (DM) for the feed Se concentration and 7 to 175 days for the duration of supplementation.
Whenever conversion from dry weight (DW, also DM) to wet weight (WW) was necessary, factors determined from a literature search and evaluation were used. WW to DW conversion factors for the chicken liver, kidney, yolk, albumen, muscle and liver protein used were 0.30, 0.26, 0.50, 0.20, 0.27 and 0.17, respectively. These are in agreement with factors reported by other authors as well (McCance, Reference McCance1991; Solomon, Reference Solomon1991; Prankel et al., Reference Prankel, Nixon and Phillips2004). Data on amount of Se in whole egg usually presented as μg per egg could not be appropriately converted to concentration values (p.p.m.) as actual egg weight was not reported. Thus, only data of Se concentration of egg components were considered for analysis.
Several data were recorded and used in the study. The components of the data set were as follows. The source of Se present in the diet grouped into four categories, namely, no supplementation, inorganic, organic and nano-Se. Control feeds were placed in the no supplementation category. Inorganic sources included sodium selenite, calcium selenite and sodium selenate, whereas organic sources included B-Traxim Se, SeMet, Se-yeast, Se-malt, Chlorella Algae, cabbage and garlic. In total, there were 12 Se source levels. Furthermore, there were two types of chicken (laying hens including broiler breeders or meat type birds i.e. broilers). Other components were the age of birds at the beginning of supplementation (young (⩽49 days), old (>49 days)); the duration of supplementation (short (⩽21 days), medium (>22, ⩽42 days), long (>42 days)); the year during which the study was conducted (1970 to 1979, 1980 to 1989, 1990 to 1999, 2000 onwards); the sex of the birds (male, female, ‘as hatched’), the number of chickens per experimental treatment (n), the method of Se determination (atomic absorption spectroscopy (AAS) – and its variations including hydride generation atomic absorption-, fluro-spectroscopy and inductively coupled plasma mass spectrometry (ICP-MS)). Cases of outsourcing of Se determination, that is, lack of analytical technique description, were recorded and grouped in an additional category named ‘Other’. Additional key parts of the data set included the Se added in the feed that was categorized into four levels, taking into account that the maximum concentration of Se added to chicken diets in US is 0.3 p.p.m. (US Food and Drug Administration (FDA), 2012) (no, normal (⩽0.3 p.p.m.), medium (>0.3, ⩽1 p.p.m.) and high (>1,⩽15 p.p.m.); the Se concentrations in the organs and tissues (plasma, whole blood, liver, kidney, breast muscle tissue, leg muscle tissue, yolk, albumen); the type of tissue; and finally, the antioxidant enzyme glutathione peroxidase (GPx) activity. Some components (GPx activity in the whole blood, SOD activity in breast muscle and CAT activity in breast muscle and liver) were omitted from the data set owing to the low number of observations (i.e. <3). Forty Se supplementation experiments were finally identified to match the aforementioned selection criteria originating from 35 different studies carried out in 12 countries, namely, China, United States, Norway, Canada, United Kingdom, Brazil, Greece, Serbia, Czech Republic, Turkey, Australia and Hungary.
Statistical analysis
The initial analysis of data included the application of a stepwise regression approach with the aim to identify the most important factors affecting Se concentration of the various tissues. During this analysis, all factors were included. This analysis showed that some factors may not be retained in the final model after inclusion or exclusion of others. This implies partial or full confounding among the factors examined, which was confirmed by either correlation analysis or ANOVA as indicated by loss of degrees of freedom. Following the above, age was always discarded from the retained factors as it was almost perfectly correlated with duration of experimentation. Therefore, we preferred to retain duration within our analysis for interpretability reasons. Similarly, the factor year was confounded with the tissue, requiring retention of the tissue in the analysis. The variable sex was confounded with the type of chicken, and therefore it was omitted from the final model.
The final statistical model was a mixed model including both fixed and random effects. The fixed effects included the type of chicken (two classes, 1: layers, 2: broilers), the method of analysis (four classes, 1: AAS, 2: fluorometric assay, 3: ICP-MS, 4: other), Se source (12 classes, 1: no supplementation 2: sodium selenite, 3: calcium selenite, 4: sodium selenate, 5: B-Traxim Se, 6: SeMet, 7: Se-yeast, 8: Se-malt, 9: Chlorella Algae, 10: cabbage, 11: garlic, 12: nano-Se) and tissue type (eight classes, 1: plasma, 2: whole blood, 3: liver, 4: kidney, 5: breast muscle tissue, 6: leg muscle tissue, 7: yolk, 8: albumen). In addition, duration of Se supplementation as well as Se added to feed (log values) were fitted as covariates. In an attempt to quantify possibly differential rates of Se accumulation across the various tissues, the latter parameter (Se added to feed) was fitted as a nested covariate within tissue(s). In keeping with standard practice in meta-analysis, the individual studies were included as random effects. Furthermore, a compound symmetry structure was assumed for the error covariance matrix owing to repeated Se values reported in the same study.
The results of the mixed model analysis are reported as least squares means (with standard errors). When multiple comparisons were carried out, the Bonferroni correction method was used to appropriately adjust the P-values. A log transformation for Se concentration and Se added was applied, which may render negative values as reasonably expected. All analyses were carried out by SAS (2005).
Results
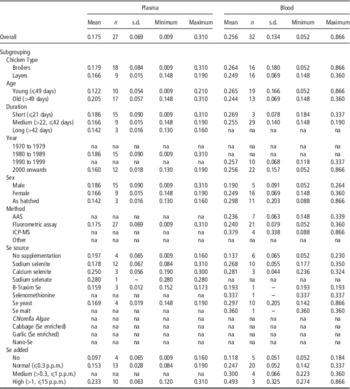
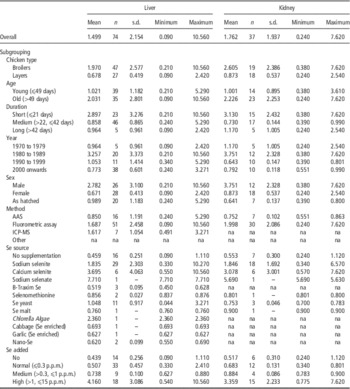
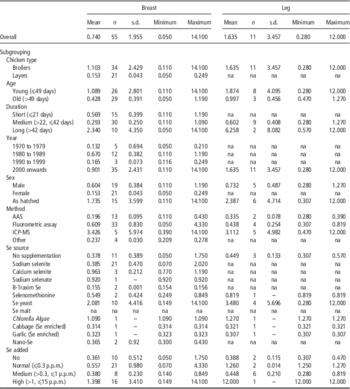
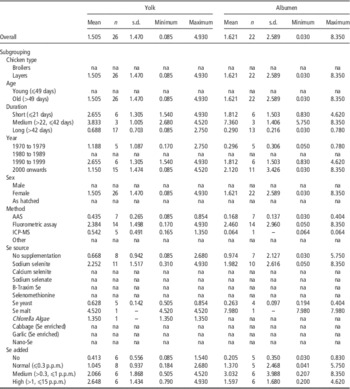
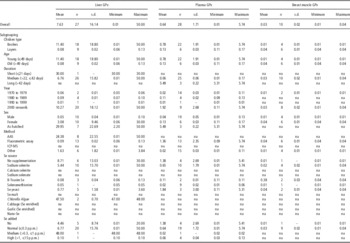
The descriptive characteristics of the Se concentration in the various tissues are summarized in Tables 1 to 5. Here, the mean (raw) Se concentration (p.p.m.), the number of observations (n), the standard deviation (s.d.), along with minimum and maximum values are presented. Mean concentration of Se in chicken plasma ranged from 0.09 to 0.31 p.p.m. (overall mean 0.17 p.p.m.), whereas that of whole blood from 0.05 to 0.87 (overall mean 0.26 p.p.m.) (Table 1). Broilers and layers exhibited comparable plasma and blood Se concentration. Note that several studies conducted during the 1970s and 1990s did not report any plasma Se examination, and these are indicated in the tables as not applicable (na). The mean blood Se concentration of chickens fed unsupplemented diets, diets with normal, medium and highly added Se concentration was 0.12, 0.25, 0.30 and 0.49 p.p.m., respectively (Table 1). Studies using Chlorella Algae, cabbage, garlic and nano-Se as a source of Se did not report any Se concentration in plasma and blood. Regarding the method of analysis used to determine Se concentration, no studies report atomic absorption or ICP-MS as the method used to acquire data on plasma Se concentration. The overall Se concentration in the liver and kidney was 1.50 p.p.m. ranging from 0.09 to 10.56 p.p.m. and 1.76 p.p.m. (range: 0.24 to 7.62 p.p.m.), respectively (Table 2). The mean liver Se concentration was 0.44, 0.70, 0.74 and 4.16 for no, normal, medium and highly Se added level, respectively. Se concentration in the breast muscle tissue (Table 3) ranged from 0.05 to 14.10 p.p.m. (overall mean 0.74 p.p.m.), whereas that of the leg muscle from 0.28 to 12.00 p.p.m. (overall mean 1.63 p.p.m.). Studies using Se malt as a source of Se did not report any Se concentrations either in the breast or in leg muscle tissue (na, Table 3). Mean yolk and albumen Se concentration in layers was 1.50 (0.08 to 4.93 p.p.m.) and 1.62 p.p.m. (0.03 to 8.35 p.p.m.), respectively. No data were available for male birds indicating biological plausibility (Table 4). Furthermore, the highest activity of GPx was recorded in the liver when compared with the other two tissues, that is, plasma and breast muscle (Table 5). The mean GPx activity in the breast muscle, plasma and liver was 0.03, 0.64 and 7.26 U per mg of protein, respectively (Table 5).
Descriptive statistics of Se concentration (p.p.m.) in plasma and whole blood of chicken

AAS=atomic absorption spectroscopy including hydride generation atomic fluorescence spectroscopy; ICP-MS=inductively coupled plasma mass spectroscopy; Other=outsourcing; No supplementation=naturally occurring Se; na=not applicable.
Descriptive statistics of Se concentration (p.p.m.) in the liver and kidney of chicken

AAS=atomic absorption spectroscopy including hydride generation atomic fluorescence spectroscopy; ICP-MS=inductively coupled plasma mass spectroscopy; Other=outsourcing; No supplementation=naturally occurring Se; na=not applicable.
Descriptive statistics of Se concentration (p.p.m.) in the breast and leg muscle of chicken

AAS=atomic absorption spectroscopy including hydride generation atomic fluorescence spectroscopy; ICP-MS=inductively coupled plasma mass spectroscopy; Other=outsourcing; No supplementation=naturally occurring Se; na=not applicable.
Descriptive statistics of Se concentration (p.p.m.) in the yolk and albumen of chicken

AAS=atomic absorption spectroscopy including hydride generation atomic fluorescence spectroscopy; ICP-MS=inductively coupled plasma mass spectroscopy; Other=outsourcing; No supplementation=naturally occurring Se; na=not applicable.
Descriptive statistics of GPx (glutathione peroxidase) concentration (U/mg protein) in the liver, plasma and breast muscle of chicken

AAS=atomic absorption spectroscopy including hydride generation atomic fluorescence spectroscopy; ICP-MS=inductively coupled plasma mass spectroscopy; Other=outsourcing; No supplementation=naturally occurring Se; na=not applicable.
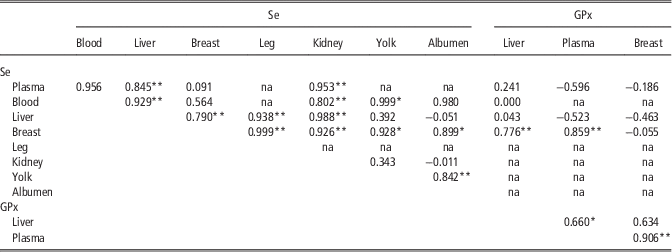
Table 6 shows the correlations of Se concentration between the various tissues as well as correlations with GPx activity. Se concentrations in blood and plasma were positively correlated, implying that they could be used interchangeably. Se concentration in plasma was positively correlated with that in the liver (r=0.845) and kidney (r=0.953). Se concentration in blood was found to be positively correlated with that of the liver (r=0.929), kidney (r=0.802) and yolk (r=0.999). Se in liver Se was also positively correlated with that of the breast (r=0.790), leg (r=0.938) and kidney (r=0.988). Se in the breast apart from its aforementioned correlation with the liver was additionally correlated with that of four other tissues, namely, the leg (r=0.999), kidney (r=0.926), yolk (r=0.928), albumen (r=0.899) as well as with GPx activity in the liver (r=0.776) and plasma (r=0.859) but not in the breast.
Pearson correlations between the Se concentration in various tissues and GPx (glutathione peroxidase) activity in chicken

na=not applicable.
*P⩽0.05.
**P⩽0.01.
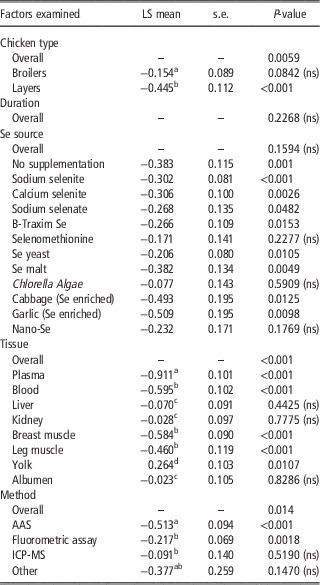
Table 7 shows the results of mixed ANOVA along with least square means of Se concentration per class of factor included in the final model. The two chicken types were clearly discriminated (P<0.0059) with regard to Se concentrations with layers displaying lower concentrations v. the broilers (−0.445 v. to 0.154, respectively). Fitting the duration of the experiment as a covariate did not improve the model fit, implying no significance of this particular factor (P=0.2268). In addition, the source of Se appeared not to significantly affect the Se concentration in the various tissues. However, a more thorough examination of least square (LS) class means showed that some Se sources may cause maximum (e.g. B-Traxim, Se yeast) or minimum (Garlic, cabbage) Se concentrations across the tissues.
Level of significance of factors examined as well as least squares means (with standard errors) of classes within factor(s) of tissue Se concentration (log values) in chicken

No supplementation=naturally occurring Se; ns=non significant; AAS=atomic absorption spectroscopy including hydride generation atomic fluorescence spectroscopy; ICP-MS=inductively coupled plasma mass spectroscopy; Other=outsourcing.
Values are log-transformed LS (least square) means.
a–dMeans within a column, within a main effect comparison, with different superscripts are different at P<0.05, unless otherwise stated.
Overall, Se concentrations clearly discriminated across the various tissues (P<0.001). In addition, here a thorough inspection of the estimated LS tissue means has shown highest concentrations in the yolk, albumen, kidney and liver, and lowest in plasma, blood and muscles (breast and leg). According to the estimated LS means of Se concentrations, the various tissues could thus be placed in ascending order as follows: plasma (lowest), blood, breast muscle, leg muscle, albumen and yolk (highest) (Table 7).
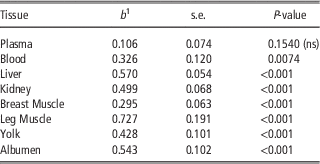
Apart from differences in the Se concentrations in the various tissues, we have further detected different rates of Se accumulation across the various tissues (see values of linear regression coefficients (b) in Table 8). More specifically, highest accumulation rates were estimated in the leg muscle (b=0.727, P<0.001), liver (b=0.570, P<0.001) and kidney (b=0.499, P<0.001), and lowest or nil in blood (b=0.326, P=0.0074) and plasma (b=0.106, P=0.154). However, when s.e.s were taken into account, only differences in Se accumulation rates between the leg muscle and plasma (P=0.0023) and between the leg muscle and breast muscle (P=0.0274) could be confirmed statistically. Se accumulation rates between the leg muscle and blood tended (P=0.0741) to differ significantly. Furthermore, statistically significant Se accumulation rates were noted between the liver and plasma (P<0.001), liver and breast muscle (P=0.001), and liver and blood (P=0.05). Similarly, Se accumulation rates between albumen and plasma (P<0.001) and albumen and breast muscle (P=0.0368) differed significantly. Moreover, Se accumulation rates between the kidney and breast muscle (P<0.001) and between the kidney and plasma (P<0.001) could be statistically confirmed. Finally, statistically significant Se accumulation rates were observed between plasma and yolk (P=0.0103), between plasma and breast muscle (P=0.0130), and between plasma and egg (P=0.0399).
Linear regression coefficients (b) of Se determined to Se added to feed across the various tissues of chicken

ns=non-significant.
1 b denotes the relative increase of Se accumulation in various tissues when Se added to feed was increased by 1 unit (log-transformed values).
Finally, the analytical method applied to determine Se was found to be associated with significantly different Se concentrations in the various tissues (P=0.014) with lowest and highest values estimated for ICP-MS and AAS, respectively (Table 7).
Further correlation analysis between Se concentration, Se added to feed and GPx activity showed Se concentration (pooled data) to be correlated (r=0.529, P<0.01) with Se added to feed and to GPx activity (r=0.332, P=0.0478), the latter not being correlated with Se added to feed (results not presented).
Discussion
The present study presents an attempt to evaluate the importance of various factors that are involved in Se accumulation in various chicken tissues as well as in the antioxidant enzyme activity. This meta-analysis identified significant factors, which affect Se accumulation, the source of Se, the type of tissue and the analytical method used. Regarding the Se source, the study revealed that certain Se sources such as sodium selenite, B-Traxim and Se yeast may cause maximum Se concentrations across the tissues. Chickens may receive Se via their typical diet and additionally via feed additives. With regard to the latter (feeding additives), the Commission of the European Communities has approved several forms including inorganic salts, sodium selenite or sodium selenate (EC, 2004), or organic salts including yeast strains Saccharomyces cerevisiae CNCM I-3060 (EC, 2006), NCYC R397 (EC, 2007) or CNCM I-3399 (EC, 2009). Yeast is able to bind element ions from the environment and then permanently incorporate them into its cellular structures. At present, S. cerevisiae, Candida utilis and Yarrowia lipolytica yeast species are mainly used in biotechnological investigations on mineral constituent incorporation (Kieliszek and Błażejak, Reference Kieliszek and Błażejak2013). SeMet is the predominant form of Se in most Se-enriched yeast products usually ranging between 60% and 70% of the total Se (Whanger, Reference Whanger2002; Rayman, Reference Rayman2012). Among all Se yeast products available, large differences in quality and consequently nutritional value may exist when several quality factors are not satisfied. These factors include the purity of the yeast strain, the percentage of complexed organic Se – percentage of SeMet, the particle size, the moisture content, and the level of toxic and microbiological impurities and contaminants (Rayman, Reference Rayman2004).
Other forms of organo-Se compounds include Se-enriched malt (Liu et al., Reference Liu, Zhao, Liu and Wang2009), garlic, cabbage (Seo et al., Reference Seo, Spallholz, Yun and Kim2008), Chlorella Algae (Ševčíková et al., Reference Ševčíková, Skřivan, Dlouhá and Koucký2006) and B-Traxim Se (Leeson et al., Reference Leeson, Namkung, Caston, Durosoy and Schlegel2008). The present analysis revealed that the Se malt, Se garlic and cabbage may affect Se concentrations across the tissues. Se in Se-enriched malt exists mostly in organic forms and can be used as an alternative to Se yeast (Li and Wang, Reference Li and Wang2004). Among plants, Brassica- and Allium species have been identified as newer secondary Se-accumulator plant species capable of accumulating high quantities of Se when grown in seleniferous soils (Seo et al., Reference Seo, Spallholz, Yun and Kim2008). Whanger (Reference Whanger2002) indicated that methylselenocysteine is the major Se compound in plants of the Allium and Cruciferous families, such as garlic, onions, broccoli and wild leeks. Chlorella is a freshwater alga, containing a twofold amount of proteins (60%) compared with all species of legumes, 20% of polysaccharides and 10% of fats, and can be enriched with Se (Ševčíková et al., Reference Ševčíková, Skřivan, Dlouhá and Koucký2006). B-Traxim Se is an organic Se additive in the form of a Se-proteinate using soybean peptides as the ligand (dipeptide and tripeptide ligands) (Leeson et al., Reference Leeson, Namkung, Caston, Durosoy and Schlegel2008). Newer analytical methods of speciation try to identify differences between organic Se sources (El-Bayoumy et al., Reference El-Bayoumy, Sinha, Pinto and Rivlin2006) and establish the dominant Se metabolite in each source. Se can also be supplied in the form of nano elemental Se and can be described as stable, soluble, at nano particle size in the redox state of zero (Hu et al., Reference Hu, Li, Xiong, Zhang, Song and Xia2012).
Selenites, selenates, SeMet, SeCys and other Se species differ in assimilation, respective biological effects and toxicities (Kieliszek and Błażejak, Reference Kieliszek and Błażejak2013). Absorbed Se, as SeMet, can be further metabolized in the liver and used for the synthesis of specific Sel. Some forms are preferentially incorporated into Sel, others are not specifically incorporated into proteins, whereas others are excreted (Pedrero and Madrid, Reference Pedrero and Madrid2009).
Organic Se (SeMet) is actively absorbed in the intestine through the amino-acid transport mechanisms, whereas inorganic Se is passively absorbed. Regarding nano-materials, nano-Se has been reported to exhibit high-specific surface area, small particle size and good intestinal absorption because of the formation of nanoemulsion droplets (Hu et al., Reference Hu, Li, Xiong, Zhang, Song and Xia2012). Similarity between SeMet and Met allows the body to use them interchangeably in protein synthesis because the tRNAMet cannot discriminate between Met and SeMet (Wang et al., Reference Wang, Zhan, Zhang, Wu and Yuan2011b). This makes it possible to build Se reserves in the body.
The present meta-analysis revealed significant differences in tissue deposition rates being in ascending order: plasma<breast muscle<blood<yolk<kidney<albumen<liver<leg muscle. Individual studies reported that the liver and kidney exhibit higher accumulation than the breast muscle tissue (Al-Waeli et al., Reference Al-Waeli, Zoidis, Pappas, Georgiou, Zervas and Fegeros2013). Such differences may be attributed to the different role of organs such as the excretory role of kidney. Se in the layer’s diet can also be deposited into the egg. The Se content in eggs depends on its concentration in the hen’s diet and also on the form of dietary Se used, as organic Se is more efficiently deposited in the egg yolk compared with selenite (Wang et al., Reference Wang, Zhan, Zhang, Wu and Yuan2011b). Se originating from B-Traxim accumulates to a greater extent in lipid-associated components such as yolk (Leeson et al., Reference Leeson, Namkung, Caston, Durosoy and Schlegel2008). Se, in common with many other minerals, may be preferentially deposited in the yolk compared with the albumen, which is a consequence of the activity of mineral-binding lipoproteins in the formation of the egg yolk (Pappas et al., Reference Pappas, Karadas, Surai and Speake2005b; Wang et al., Reference Wang, Zhan, Yuan, Zhang and Wu2011a). The quantity of Se added may have a role on Se partitioning in egg components. It is proposed that under conditions of marginal Se supply from the hen to the egg, Se may be preferentially deposited into the yolk, where most minerals in the egg are stored and from there it can be efficiently transferred via the yolk sac to the developing embryo (Richards, Reference Richards1997). In contrast, when levels of Se in the breeder diet are more than adequate, excess Se may be deposited in the albumen, where it may be available for embryogenesis (Pappas et al., Reference Pappas, Acamovic, Sparks, Surai and McDevitt2005a).
Se is an important component of the antioxidant enzymes of the GPx family. At least six GPx members have been discovered (Pappas et al., Reference Pappas, Zoidis, Surai and Zervas2008). Besides their specific functions, all of them have an antioxidant function, protecting cells against oxidation damage from free radicals and reactive oxygen species (Pedrero and Madrid, Reference Pedrero and Madrid2009). In the present study, GPx activity was correlated with tissue Se concentration but not with Se added to feed. Several individual studies report a relation of GPx activity to Se concentration and source. For example, in a study examining different Se sources, activity of GPx in the liver was greater in hens fed selenite or Se yeast but was higher in plasma in hens fed selenite compared with B-Traxim Se or Se yeast (Leeson et al., Reference Leeson, Namkung, Caston, Durosoy and Schlegel2008). In contrast, no differences were detected with respect to GPx activities in the serum and tissues between the sodium selenite and the l-SeMet groups (Wang et al., Reference Wang, Zhan, Zhang, Wu and Yuan2011b). It therefore seems that many factors may be involved in tissue Se retention and GPx activity. There are reports indicating that a hierarchy of Se retention exists during Se depletion among the tissues and Sel (Zoidis and Pappas, Reference Zoidis and Pappas2012). During depletion, Se is rapidly mobilized from GPx1 stores, whereas expression of other Sel such as GPx4, GPx2, iodothyronine deiodinases D2 and D3, and TRxR is hardly affected or may even be increased, like in the case of D1. This hierarchy is reflected and at the level of mRNA with some mRNAs to be preferentially translated into Sel (Grunder-Culeman et al., Reference Grundner-Culeman, Martin, Harney and Berry1999; Low et al., Reference Low, Grundner-Culemann, Harney and Berry2000; Zoidis et al., Reference Zoidis, Pappas, Georgiou, Komaitis and Fegeros2010). These proteins, residing high in the hierarchy of Se retention during Se depletion, also seem to lead in the priority for repletion (Hill et al., Reference Hill, Lyons and Burk1992; Bermano et al., Reference Bermano, Nicol, Dyer, Sunde, Beckett, Arthur and Hesketh1995; Gross et al., Reference Gross, Oertel and Köhrle1995; Lei et al., Reference Lei, Evenson, Thompson and Sunde1995; Michell et al., Reference Mitchell, Nicol, Beckett and Arthur1998; Driscoll and Copeland, Reference Driscoll and Copeland2003).
The present meta-analysis showed that the analytical method used may be associated with differential Se quantification across the various tissues. Ideally, analytical methods should be able to accurately determine Se in a variety of sample matrices from low p.p.b. concentrations to several hundred p.p.m. A variety of methods are used to quantify Se including methods approved by the Association of Official Analytical Chemists such as fluorometry, HG-AAS and ICP-MS (Rudik Miksa et al., Reference Rudik Miksa, Buckley, Carpenter and Poppenga2005). Differences between analytical techniques do exist. Inductively coupled plasma–mass spectrometry combines an excellent ion source with an ion-detecting mass spectrometer offering advantages over alternative methods that include but are not limited to: its application to a wide range of sample types, high sensitivity, need for minimal sample preparation, need for small sample sizes, simultaneous multielement analysis and high specimen throughput (Rudik Miksa et al., Reference Rudik Miksa, Buckley, Carpenter and Poppenga2005). Misled Se quantification may arise in some cases. Disadvantages of using ICP-MS may include formation of doubly charged ions, interferences from elements with the same isotopic mass and formation of polyatomic ions derived from argon-based plasma. Disadvantages of HG-AAS may be related to sample handling and preparation as it is known that incomplete breakdown of organo-Se compounds, loss of volatile Se and interference from transition metals that are reduced slower than Se may occur (Rudik Miksa et al., Reference Rudik Miksa, Buckley, Carpenter and Poppenga2005; Falandysz, Reference Falandysz2013).
For humans, the main Se source is the diet. It has already been reported that RDA levels sometimes are not met by populations, and thus proper antioxidant protection may be compromised not to mention the benefits from health effects of higher Se status. Human needs could be covered through Se in fortified food or supplements. In that way, Se-fortified chicken meat consumption could assure that nutritional Se needs are met. Tissue Se concentration is a crucial factor for the development of Se-enriched nutritional products aiming to increase dietary element intake and status. Several factors that may affect the Se status of an organism include: age, sex, current Se status and form of Se in fortified food or supplements (Pedrero and Madrid, Reference Pedrero and Madrid2009). In a recent review, it was emphasized that an inextricable U-shaped link between Se intake and health status may exist; whereas additional Se intake may benefit people with low status, those with adequate-to-high status might be affected adversely and should not take Se supplements (Rayman, Reference Rayman2012). Under this context, the Se and vitamin E cancer trial (SELECT), which investigated the effect of Se and vitamin E on prostate cancer risk in 35 533 American men, showed that administration of 200 μg Se per day (as SeMet) to men with baseline of serum Se at 135 ng/ml did not reduce the risk of prostate cancer (Lippman et al., Reference Lippman, Klein, Goodman, Lucia, Thompson, Ford, Parnes, Minasian, Gaziano, Hartline, Parsons, Bearden, Crawford, Goodman, Claudio, Winquist, Cook, Karp, Walther, Lieber, Kristal, Darke, Arnold, Ganz, Santella, Albanes, Taylor, Probstfield, Jagpal, Crowley, Meyskens, Baker and Coltman2009). Several potential reasons for SELECT failure have been examined including the form of supplemented Se. Se was given in the form of one Se species, namely, l-SeMet in contrast to the more than 20 Se-containing species present in brewer’s yeast (Ledesma et al., Reference Ledesma, Jung-Hynes, Schmit, Kumar, Mukhtar and Ahmad2011). In yeast, 30% to 40% of the total Se is not SeMet (Rayman, Reference Rayman2012). More specifically, identified Se species in aqueous extracts of commercial samples of Se-yeast following enzymic hydrolysis, expressed as a percentage of extracted Se were: SeMet 60% to 84%, selenite 0.1% to 15%, γ-glutamyl-Se-methyl-Se-cysteine 0.5%, Se-methyl-Se-cysteine 0.5%, Se-adenosyl-Se-homocysteine 0.5% to 5%, Se-cystathionine 0.5% to 1%, Se-lanthionine 0.5%, Se-cystine 0.5%, Se-cysteine 3% to 5%, SeMet-selenoxide or its hydrate 0.4% (Rayman, Reference Rayman2004).
The present meta-analysis showed that several factors including type of chicken, source of Se, type of tissue and analytical method used affect tissue Se concentration in chicken. It is believed that several other factors not examined in the present study may affect Se absorption, distribution and retention. For example, it is known that Se food bioavailability in humans is affected by diet composition, presence of other metals, drugs, physiology factors such as nutritional state, growth and pregnancy, and the presence or absence of dietary micronutrient inhibitors or enhancers (Pedrero and Madrid, Reference Pedrero and Madrid2009). Interactions between different Se compounds and zinc, cadmium and mercury have been reported (Feroci et al., Reference Feroci, Badiello and Fini2005). Deficiency or supplementation of an element may alter their balance and trigger antagonistic or synergistic effects. The alteration of trace element balance may concomitantly affect the antioxidant defense system as several trace elements, such as Se, Cu, Fe and Zn, are integral part of various antioxidant enzymes (Pappas et al., Reference Pappas, Zoidis, Georgiou, Demiris, Surai and Fegeros2011). Future studies should take into account Se speciation. Epidemiological studies indicate that the chemopreventive efficacy of Se depends not only on the dose but also on the chemical form in which it is administered (El-Bayoumy et al., Reference El-Bayoumy, Sinha, Pinto and Rivlin2006).
Acknowledgements
The authors would like to thank those scientists who provided them with copies of their work and helped them to expand the raw data database used in this meta-analysis.
Supplementary material
To view supplementary material for this article, please visit http://dx.doi.org/10.1017/S1751731113002395