Preparedness and emergency response plans often focus on providing health care to those directly injured by the event.Reference Ford, Mokdad and Link1Reference Sharma, Weiss and Young2Reference Holt, Mokdad, Ford, Simoes, Mensah and Bartoli3 Such planning may overlook the routine medical care needs of those with preexisting medical conditions. In disasters such as a bioterrorist attack (eg, anthrax attack) or major natural disasters (eg, hurricanes, wildfires), hundreds of thousands of people may have to be evacuated from their homes and they may experience delays returning home. Displaced people become separated from their usual sources of medical care, communities, caregivers, the support of friends and neighbors, and they experience disruption in access to prescription medicines and medical records. As a result, people, especially those with preexisting severe health conditions, are vulnerable to medical consequences from displacement itself.
Maintaining the continuity of medication is a major challenge in disaster response.Reference Arrieta, Foreman, Crook and Icenogle4 Inadequate planning for the health care needs of patients with chronic medical conditions may result in a significant mismatch between health care demand and supply during an emergency. The lessons from Hurricane Katrina have revealed exactly such a gap in emergency-response planning.Reference Ford, Mokdad and Link1Reference Sharma, Weiss and Young2Reference Kessler56Reference Greenough and Kirsh7Reference Brodie, Weltzien, Altman, Blendon and Benson8Reference Cefalu, Smith, Blonde and Fonseca9Reference Greenough, Lappi and Hsu10Reference Klein and Nagel11 While recent disasters have increased awareness of needs for planning for medically dependent populations, few tools exist to operationalize preparedness needs. In this report, we describe a tool to estimate the number of persons with preexisting medical conditions who will potentially need postdisaster special medical care.
DATA AND METHODS
Framework
We developed a rate-based spreadsheet (Excel, Microsoft Corp) model, MedCon:PreEvent (available at: http://emergency.cdc.gov/planning/medcon/), to estimate the medical care requirements (hospital, nursing home and special medical care) of a displaced population following a disaster, based on preexisting medical conditions.Reference Shrestha, Meltzer and Sosin12
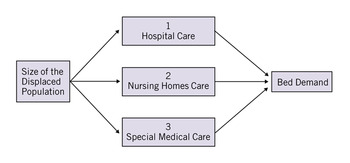
MedCon:PreEvent categorizes the medical care needs of those displaced, and with preexisting medical conditions, into 3 major categories (Figure 1). The first group includes those already in the hospital or likely to be hospitalized any given day, and the second includes patients in nursing homes who require assistance with activities of daily living. The third group includes individuals with medical conditions who do not require hospitalization but require significant medical care and are likely to be unable to care for themselves in a shelter environment. Individuals in the last group are those needing special medical care.
Medical Care Needs of Displaced Population Due to Their Preexisting Medical Conditions After a Disaster.
Framework excludes those injured due to an event; included are only those who require medical care due to a preexisting condition.

MedCon:PreEvent does not account for the direct medical care needs arising from injuries resulting from an event. The results presented here are based on US national averages regarding prevalence of preexisting medical conditions. Users can enter their own estimates for almost any population of interest in the model.
Data Sources
The data used for this study were from 3 nationally representative health-related surveys: the 2006 National Health Interview Survey (NHIS) (http://www.cdc.gov/nchs/nhis.htm), the 2005 National Hospital Discharge Survey (NHDS) (http://www.cdc.gov/nchs/about/major/hdasd/nhds.htm), and the 2004 National Nursing Home Survey (NNHS) (http://www.cdc.gov/nchs/nnhs.htm). We also used data from the US Census Bureau for population estimates for the years covered by the 3 surveys listed.
NHIS, a continuous cross-sectional survey, is a nationally representative survey that collects a wide range of information on the health of the civilian, noninstitutionalized household population of the United States.13 In 2006, there were 75 716 persons in 29 868 families and 29 204 households interviewed. For more detailed age group-specific information, 9837 children (aged <18 years) and 24 275 adults were interviewed separately. The NHDS collected data from inpatient discharge records from a sample of hospitals located in 50 states and the District of Columbia. Excluded from the survey were institutional hospitals such as federal, military, and Veterans Administration hospitals. In 2005, data were collected from the discharge records of 444 hospitals that participated in the survey. The NNHS collected data on US nursing homes and their services, staff, and residents. To be eligible for the survey, nursing homes were required to have at least 3 beds with Medicare or Medicaid certification or a license to operate as a nursing home. In the 2004 NNHS, 1174 nursing homes participated.
Calculations
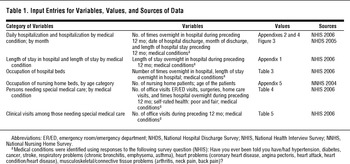
The input values entered into the model and sources of data are presented in Table 1. All input values are per 100 000 US population. We estimated numbers of persons needing medical care by multiplying the rates and the size of the population specified, presenting results per one million persons evacuated. A user of MedCon:PreEvent can readily alter the denominator.
Input Entries for Variables, Values, and Sources of Data

Daily Rate of Hospitalization (All Conditions)
We calculated the daily average number of persons requiring hospitalization due to all preexisting medical conditions per 100 000 population, using the 2006 NHIS data, as:
Daily average number of persons requiring hospitalization per 100 000 population = (Sum of overnight hospital stays in a year/Estimated population for 2006) × 100 000/365.
Demand for Hospital Beds
We used 2006 NHIS data to calculate the potential demand for hospital beds per 100 000 population on an average day, using the following equation:
Daily demand for hospital beds = Daily average number of persons requiring hospitalization × Average length of hospital stay (eAppendix 1).
Daily Rate of Hospitalization by Medical Condition
To aid planners preparing for patients by type of condition, we estimated the daily average number of persons requiring hospitalization (all conditions) per 100 000 population with 1 or more of the following 7 chronic medical conditions: heart problems, hypertension, stroke, diabetes, cancer, respiratory problems, and musculoskeletal/connective tissue problems. These conditions, either individually or as comorbidities, accounted for approximately 73% of average daily hospitalizations in the United States in 2006 (eAppendix 2).
Seasonality of Hospitalization
We used the 2005 NHDS to estimate the monthly variation in hospitalization rate. The survey does not collect data on the month of hospitalization but provides the year and month of discharge and the length of stay. We used these data to calculate the monthly hospitalization rate (eAppendix 3).13 Next, we calculated an adjustment factor for a specific month as the ratio of the rate of hospitalization for the month in question to the average annual hospitalization rate (eAppendix 4). We adjusted the daily average hospitalization rate for a specific month using the set of adjustment factors.
Occupation of Nursing Home Beds
We used the 2004 NNHS data to calculate the number of patients (ie, No. of beds occupied) in nursing homes per 100 000 US population (eAppendix 5).
To estimate the potential rate of turnover that may exist among nursing home occupants during the month following an event, we also calculated the average length of stay in a nursing home.
People Needing Special Medical Care
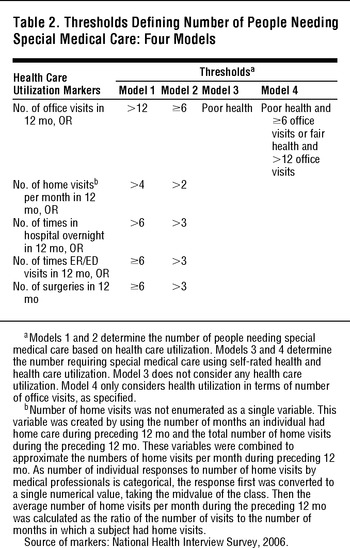
We used two sets of definitions to determine people needing special medical care following a disaster. For the first set of definitions, we specified 2 models (models 1 and 2) using 5 health services utilization markers: emergency room/emergency department (ER/ED)visits, surgeries, home health care visits, overnight hospital stays, and office visits (Table 2). We used all of these markers because correlation analysis among them showed that no single marker best represents the utilization of health services (eAppendix 6). For each marker, we set thresholds for people needing special medical care. Persons who meet the threshold of any one or more of the markers would require special medical care following a disaster.
Thresholds Defining Number of People Needing Special Medical Care: Four Models

For the second set of definitions, we specified 2 models (models 3 and 4), using health utilization and self-rated health (Table 2). We used self-rated health as a marker because self-rated “poor” or “fair” health is strongly associated with health care utilization, serious chronic conditions, and mortality.Reference Blossfeld and Rohwer14Reference DeSalvo, Bloser, Reynolds, He and Munter15Reference Pan, Mukhtar, Geiss, Rivera, Alfaro_Correa and Sniegowski16
We used 2006 NHIS data for estimating the number of persons needing special medical care per 100 000 people. Data used were from sample child, adult, and person files. Because the sample weights in the person file account for the complex sampling design, we merged sample child and sample adult files into it. For each option, we estimated the number of persons needing special medical care following a disaster. Variance of the estimates accounted for the complex sample design of the NHIS survey.13 To aid planners to prepare for patients by type of condition, we estimated the number of people needing special medical care (ie, meeting thresholds in Table 2) with the same 7 chronic medical conditions used to assess the daily rate of hospitalization. We used SAS 9.2 software (SAS Institute Inc) to analyze the data.
Demand for Clinical Visits
To aid planners to prepare for potential demand for clinical visits by those needing special medical care in the first month following a disaster, we began by grouping patients by the number of office visits in past 12 months into 3 groups: fewer than 6 visits, 6 to 12 visits, and more than 12 visits. We then assumed that, following a disaster, people needing special medical care will make clinical visits as follows: individuals who made fewer than 6 visits, 6 to12 visits, and more than 12 visits before an event would make on average 1, 1.5, and 2 visits in the first month following an event, respectively. Users of the MedCon:PreEvent tool can readily change these assumptions. We estimated the number of clinical visits per person among those needing special medical care as follows:
Average clinical visits per person (No.) = The sum of the group average number of visits per person (Average No. of visits per person in a group × Proportion of total population that is in that group),
where group is one of the following: fewer than 6 visits, 6 to 12 visits, or more than 12 visits per year, pre-event.
Last, we estimated total demand for clinical visits among those needing special medical care as follows:
Total clinical visits (No.) = Average clinical visits per person (No.) × total No. of people needing special medical care.
We also estimated weekly distribution of total clinical visits in the first month following a disaster, as follows:
Clinical visits in the specific week (No.) = Total clinical visits (No.) × Weekly clinical visits as proportion of all clinical visits.
The weekly proportion of clinical visits was derived from the distribution of daily clinical visits among evacuees in the Houston Astrodome, following Hurricane Katrina.Reference Kennedy, Kasl and Vaccarino17 The proportions of total clinical visits in the first, second, third, and fourth weeks were 0.66, 0.24, 0.09, and 0.00, respectively.
Sensitivity Analysis
Because the number of people needing special medical care is largely dependent on the set of thresholds mentioned, we altered the criteria (thresholds) for special medical care need, creating 4 models (Table 2). The MedCon:PreEvent software tool contains an additional 2 models.
RESULTS
Daily Hospitalization of Patients
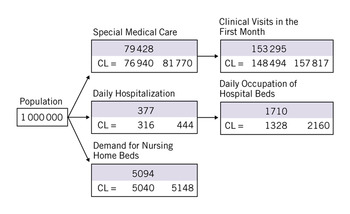
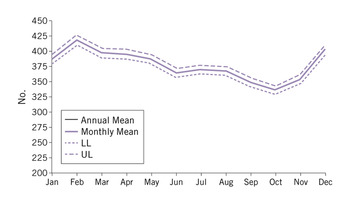
The estimated mean daily number of hospitalization would be 377 (95% CI = 316-444) per million US population (Figure 2). Appendix 2 provides a breakdown of those hospitalized by condition. Among those who were hospitalized in the preceding 12 months, the problem reported most frequently was musculoskeletal/connective tissue problems (53%), followed by hypertension (43%), heart problems (30%), diabetes (16%), cancer (16%), respiratory problems (11%), and stroke (10%). Medical conditions other than those cited accounted for 27% of the total (eAppendix 2). Because some individuals had reported more than 1 condition, the sum of the percentages of all the conditions exceeded 100%. The daily rate of hospitalization varied by month, with the highest being in February and the lowest being in October (Figure 3).
Summary Results Constitute Demand for Medical Care (Number) Due to Preexisting Medical Conditions, Assuming That an Event Would Displace 1 Million US Population.
Criteria for model 1 are <12 office visits, <6 hospital overnights, ≥6 emergency department visits, or ≥6 surgeries during preceding 12 months. See detailed breakdown for daily hospitalizations in eAppendix 2 and nursing home patients in eAppendix 5.

Monthly Variation in the Average Daily Number of Patients per 1 Million US Population.
LL = 95% confidence lower limit; UL = 95% confidence upper limit.

Hospital Bed Demand
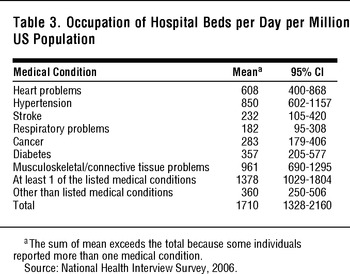
The estimated mean number of hospital beds occupied on a daily basis was 1710 (95% CI = 1328-2160) per million US population (Figure 2). Patients with musculoskeletal and connective tissues were the most frequent occupants of hospital beds, followed by those with hypertension, heart problems, diabetes, cancer, stroke, and respiratory problems (Table 3).
Occupation of Hospital Beds per Day per Million US Population

Nursing Home Bed Demand
The estimated number of patients in a nursing home was 5094 (95% CI = 5040-5148) per million US population (Figure 2). Appendix 5 breaks down the nursing home bed occupation by age groups. We calculated the average length of nursing home stay as 835 (95% CI = 813-858) days. Relative to the immediate planning horizon following an event (eg, 1 month), this length of stay is relatively long, indicating a degree of stability in the number of nursing home occupants. We therefore did not calculate the daily or monthly rates of nursing home admissions.
Demand for Special Medical Care
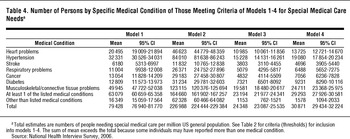
The results from model 1 show that 79 428 (CI = 76 940-81 770)/million people would need special medical care following an evacuation (Figure 2). Of those needing special medical care, 63% had musculoskeletal/connective tissue problems, 41% had hypertension, 26% had heart problems, 16% had diabetes, 16% had cancer, 14% had respiratory problems, and 8% had stroke (model 1, Table 4). These percentages sum to more than 100% because some individuals reported more than one medical condition.
Number of Persons by Specific Medical Condition of Those Meeting Criteria of Models 1-4 for Special Medical Care Needsa

Demand for Clinical Visits
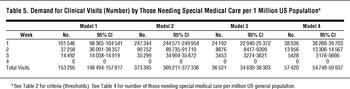
Based on model 1, the demand for clinical visits among those needing special medical care in the first month following a disaster would be 153 295 (95% CI = 148 494-157 817) per million population (Figure 2). Of the total demand, 66% would be in the first week, 24% in the second week, and 9% in the third week following a disaster (model 1, Table 5).
Demand for Clinical Visits (Number) by Those Needing Special Medical Care per 1 Million US Populationa

Sensitivity Analysis
When the thresholds in model 1 were reduced by half, as shown in model 2 (Table 2), the number of persons requiring special medical care would increase 3-fold to 226 988 (95% CI = 224 444-229 384) per million US population (model 2, Table 4). Of those requiring special medical care, 54% had musculoskeletal/connective tissue problems, 37% had hypertension, 21% had heart problems, 14% had diabetes, 13% had cancer, 12% had respiratory problems, and 5% had stroke (Table 4). Among those needing special medical care, the demand for clinical visits in the first month following a disaster would be 373 395 (95% CI = 369 211-377 336) per million (model 2, Table 5).
With poor health considered as the sole marker, the number of persons requiring special medical care would decrease to 24 348 (95% CI = 23 087-25 535) per million US population, with 80% having musculoskeletal/connective tissue problems, 63% hypertension, 45% heart problems, 30% diabetes, 21% respiratory problems, 20% cancer, and 16% stroke (model 3, Table 4). Among those needing special medical care, the total demand for clinical visits would be 36 521 (95% CI = 34 630-38 303) per million population (model 3, Table 5).
When self-rated health and office visits were combined as all poor health and 6 or more office visits or fair health and more than 12 office visits a year, the number of persons needing special medical care would be 28 998 (95% CI = 26 669-31 261) per million US population (model 4, Table 4). Table 4 presents the breakdown of patients by medical condition. Of those requiring special medical care, 80% had musculoskeletal/connective tissue problems, 62% had hypertension, 44% had heart problems, 30% had diabetes, 23% had cancer, 21% had respiratory problems, and 15% had stroke (Table 4). Based on this model, those needing special medical care would require 57 420 (95% CI = 54 748-59 937) per million clinical visits in the first month following a disaster (model 4, Table 5).
COMMENT
Depending on the definitions used to identify those likely to need special medical care (ie, the thresholds, Table 2), the demand for special medical care following a natural disaster could range between 79 000 to 227 000 per million population. If local hospital and nursing homes were completely incapacitated following a disaster, disaster planners would have to plan for alternative arrangements for approximately 1700 daily hospital patients per million displaced population. While this number is slightly lower than the national 2006 average of 1797 daily inpatients per million (calculated as inpatient days per 1000 × 1000)/365),Reference Gavagan, Smart and Palacio18 an evacuation of a large area will undoubtedly mean that many hospitals in the evacuation zone will have to close or run at reduced capacity. An estimated 5100 nursing home patients per million will also be displaced by such an evacuation.
Our results show that the demand for medical care following a disaster among those with preexisting medical conditions could potentially overwhelm medical capacities, even before accounting for those injured by the actual event. Local hospitals face major challenges in meeting these estimated surges in demand for emergency medical services. Meeting a preset benchmark of having surge capacity equivalent to an additional 500 inpatients per million inhabitants19 is unlikely to be sufficient to meet the demands of those needing special medical care. Also, the problem can be aggravated because hospital capacities have declined over time and most hospitals are already at near or full capacity.Reference Kaji, Koenig and Lewis2021 Moreover, during disasters, hospitals and nursing homes may not be able to operate at their full scale because of workforce shortages and facility incapacitation (eg, reduced power and disrupted delivery of food and other essential items).
Limitations
Our estimation has several limitations. First, the default inputs used in MedCon:PreEvent are national average estimates and do not represent any specific geographical jurisdiction. Users should take this into account when using MedCon:PreEvent tool for specific city, state, or region. (MedCon:PreEvent estimates the medical care requirement for any state or city based on the population size entered into the model by the users based on the national average. The model also allows altering most of input values if data are available for specific city, state, or region.) Second, MedCon:PreEvent identifies those needing special medical care by 7 selected chronic medical conditions. We did not differentiate, by preexisting medical conditions, approximately one-fifth of those likely to need special medical care. This group may include other priority conditions for requiring medical management following a disaster, such as end-stage renal disease (ESRD).Reference Arrieta, Foreman, Crook and Icenogle4 Because the data used here do not capture ESRD, we did not estimate the need for renal dialysis. Third, some of the criteria used for defining special medical care needs are subjective and may not fully capture the special medical care needs because of the complexity of care utilization in a population. Fourth, those evacuated and needing special medical care due to a preexisting medical condition may succeed in finding suitable care other than at government shelters. For example, some may self-evacuate to family or friends living in another state who are able to take care of such persons. Thus, the calculated results presented here may represent some upper limit. Fifth, we did not separately estimate hospital bed needs as well as the clinical visits needs for pediatrics and adults. This calculation is beyond the scope of this report. The medical care needs of pediatrics are a small fraction of total care needs. However, because bed requirements for pediatrics and adults are not the same or exchangeable, and the clinical care for pediatrics and adults requires different specialists, an estimation of medical care needs for adults and pediatrics separately would help planners better address these needs following a disaster. Finally, the survey tool does not address the problem of how patients needing care would be identified and brought to postevent hospital or special medical care facilities.
CONCLUSIONS
Following a large disaster, evacuees with preexisting medical conditions requiring special medical care could place an extreme demand on, and even overwhelm, the capacity and capability of any available postdisaster health care system. This conclusion does not include the potential health care demand by those injured during the event. The Medcon:PreEvent tool can assist disaster planners to prepare for medical care needs of large numbers of evacuees and consider re-evaluating the approach to utilizing and augmenting medical care services.
Disclaimers: The findings and conclusions in this report are those of the authors and do not necessarily represent the official position of the Centers for Disease Control and Prevention. Microsoft Windows and Excel are copyrighted products produced by Microsoft Corporation, WA. Use of trade names and commercial sources is for information only and does not imply endorsement by the Centers for Disease Control and Prevention.