


Introduction
Determining the precipitation distribution across the Antarctic continent presents a major challenge because of the difficulties in measuring snowfall in such a windy environment where snow gauges and stake arrays can give unreliable results (Turner and others, 1995). Workers concerned with determining the mass balance of the Antarctic have therefore mostly made use of data from snow pits and ice cores to construct maps showing the surface mass-balance rates for most of the Antarctic continent (e.g. Reference Giovinetto and BentleyGiovinetto and Bentley, 1985; hereafter GB). However, the in situ measurements are relatively widely spaced, leading to doubts about the accuracy of the accumulation estimates in some parts of the continent. The Antarctic Peninsula (sec Fig. 1 for a map of the region and places referred to in the text) also has such a large horizontal variability of accumulation that it has been omitted from the GB map and subsequent work by Reference BromwichBromwich (1988). However, the Peninsula is an area of great scientific interest as it has undergone a warming of several degrees since the 1940s (Reference KingKing, 1994), which is believed to be responsible for the disintegration of a number of floating ice shelves (Vaughan and Doake, 1996). We therefore need to gain greater understanding of the atmospheric circulation of this region, the atmospheric systems and circulation patterns that are responsible for most of the precipitation, and flow the changing temperature regime is affecting precipitation amounts and distribution. It is also very important to ensure that precipitation processes are represented correctly in atmospheric numerical models if we are to be able to trust their predictions when run as climate models.
In this paper wc examine the precipitation distribution and variability of the Peninsula region using the output of the re-analysis exercise carried out by the European Centre for Medium-range Weather Forecasts (ECMWF). Using the precipitation fields from numerical weather prediction (NWP) models has the advantages that data are available at relatively high horizontal resolution (about 100 km in this case) and daily precipitation fields are available, although there are problems. in particular, the models have to use a smoothed form of the orography in order to keep the model stable, and over the Antarctic there are few observations with which to prepare the analyses, although there are many satellite sounding profiles over the Southern Ocean. in the following sections the precipitation fields generated by the model are compared to the available in situ data (bearing in mind that the in situ accumulation dataset is far from complete and will not show small-scale variability), the interann-ual variability of precipitation is considered and the factors behind major precipitation events in different parts of the Peninsula are examined.
Map of the Antarctic Peninsula region, showing places referred to in the text.

The Model Data
The ECMWF has carried out a re-analysis of all its meteorological data for the period 1979 93, using a recent version of its global NWP model. This exercise produced one of the most consistent series of atmospheric analyses, which is of great value for climate variability and change studies. The version of the ECMWF global, spectral model used in the re-analysis project had 31 levels in the vertical and a truncation OÍT106, giving an approximate horizontal resolution of 100 km. Since the assimilation scheme cannot analyze precipitation data, we have elected to use the precipitation amounts from the first 24 hours of the forecasts carried out each day over the 15 year period. From these daily accumulation amounts we have generated monthly, seasonal and annual totals and means.
The urography used in the FCMIVF re-analysis exercise. Heights are given in metres with a contour interval of 100 m.

As discussed above, the model orography is smoother than reality (Fig. 2), with a maximum height of 1301 m. This is relatively low. as the Peninsula lias a maximum elevation of more than 1500 m a.s.l. (hereafter all heights are referred to sea level) for much of its length, and a number of peaks above 2000 m. However, representing such a high but narrow barrier in a model is very difficult when the gridbox size is 100 km, and the ECMWF represcnts the Peninsula as well as any current model. Figure 2 shows thai the orography has been heavily smoothed in the east-west direction, resulting in above-zero elevations over the ocean areas on either side of the barrier. Because of the spectral nature of the model, some of the orographic heights over the ocean areas are also slightly less than zero. However, the north-south smoothing is less pronounced, as can be seen by the rapid reduction in heights down from the plateau over the southern Bellingshausen Sea.
Fig. 3. Annual mean precipitationfor the period 1979-93 derivedfrom the ECMWF re-analysis fields.

Precipitation Distribution
The map of 15 year mean annual precipitation for the Peninsula area derived from the ECMWF re-analysis is shown in Figure 3. The largest values, which are in excess of 1.3 m w.e. a−1, are found on the western side of the Peninsula from the northern part of Alexander Island to Renaud Island. We would expect to find the precipitation peak on the steep western slope of the barrier where the air is forced up the slope, resulting in cooling of the air, formation of cloud and eventual precipitation. However, because of the model smoothing, the precipitation maximum appears to be too far to the west. The peak occurs close to the 200 m level in the model, with smaller amounts at greater elevations, and only about 0.7-0.8 m on the divide of the northern part of the Peninsula, decreasing to around 0.4m in the south. On the eastern side of the barrier, the annual precipitation totals are in the range 0.4—0.5 m, but with values of less than 0.3 m just to the cast of the divide on the high plateau of the southern Peninsula. Reference Peel and MorrisPeel (1992) examined the spatial variability of the accumulation across the Peninsula using the available icc-corc data, and considered the relationship between accumulation and topographic height on both sides of the barrier. On the western side, he found that above 500 m there was a decrease in accumulation with height, which is consistent with the model results. Although there are no ice cores from below 500 m because of summer melt, the model would suggest that the peak precipitation is around 200 m, although because of the smooth orography in the model it is difficult to say flow this will compare with reality. Ice cores taken on the divide, close to the 2000m level, suggest that this area receives about 0.5 m a−1 , while the “divide” in the model has a comparable figure of ahout 0.4ma−1, although at a height of 1100-1300 m. From the ice-core data there is evidence of scouring of snow from the highest points on the Peninsula, which is not taken into ac ¬count by the model. This will mean that the model precipitation is likely to be greater than the in situ measurement of accumulation. However, the results of Peel agree with the model in suggesting an increase of precipitation with height on the low-lying eastern side of the Peninsula. Both sources of dala suggest an annual accumulation of less than 0.5 m, although some ice cores have as little as 0.2 m, which is less than suggested by the model.
Relative variability (standard deviation divided by the mean) of the annual precipitation totals from the ECMW F re-analysis exercise for the period 1979-93.

Interannual Variability of Precipitation
The distribution of standard deviation (s.d.) of the annual precipitation total (not shown) computed from the 15year model record has a very similar appearance to the distribution of mean annual total, with the largest values in the central part of the western side of the Peninsula, and much smaller values at higher elevations and on the eastern side. A much more useful quantity is the relative variability, i.e. the s.d. divided by the annual mean precipitation, shown in Figure 4. Over the Peninsula area the relative variability covers the range 0.1 to over 0.2, the lowest values being found over the northern parts of the Bellingshausen and Wecldell Seas, and the largest values to the east of the tip of the Peninsula. The northern oceanic areas, which are at the latitude of the circumpolar trough, are subject to many depressions throughout the year (Reference Jones and SimniondsJones and Simmonds. 1993), although automatic depression-tracking schemes suggest that there is little variability in activity from year-to-year. Along the southern coast of the Bellingshausen Sea there is greater relative variability in precipitation, with a local peak over the northern part of George VI Sound. The analysis of depression tracks shows lhat the area of the southern Bellingshausen Sea has a greater interannual variability of depression activity, suggesting the importance of depressions in giving précipitation. Howev er, the greatest relative variability of precipitation is east of the tip of the Peninsula. This area receives little precipitation over the year, since it is frequently under the influence of relatively dry air masses arriving from the south or southeast. flow ever, there is a high degree of relative variability in depression activity across this area, giving a large relative variability of precipitation.
Relationship Between Atmospheric Circulation and Accumulation
Earlier studies of Antarctic precipitation have suggested that depressions are responsible for most of the precipitation in the Antarctic coastal region (Bromwich, 1988; Turner and others. 1995). However, the data available for these investigations were limited, and the ECMWF re-analysis provides us with a much more complete picture of the events that contribute to the annual total of precipitation. For this study, we have examined the precipitation regimes of four locations: Rothera Station on the western side of the Peninsula (67.4° S, 68.6°W i; a point on the Larsen Ice Shelf to the east of the Peninsula divide (67.8' S, 61.9° W); a point on the Bryan Coast south of the Bellingshausen Sea (73.5°S, 86.6° W); and a location near the edge of the Ronne Ice Shelf (76.8°S, 58.5° W). These four points are indicated by-crosses in Figure 1.
Precipitation datafrom the ECMWF re-analysis for the pair sites indicated in Figure 1.
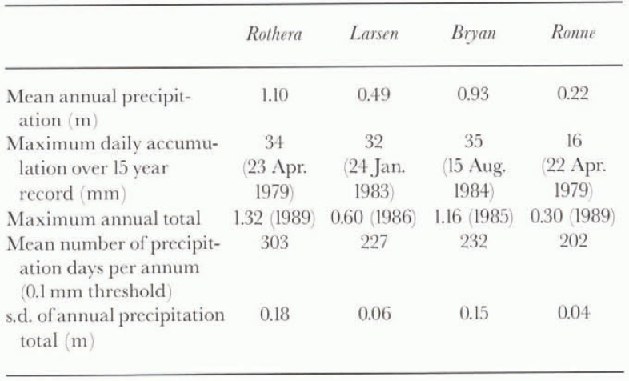
The different precipitation regimes of these four sites can be seen from the results in Table 1 and Figure 5. lablc 1 indicates that all four sites receive, on average, precipitation on over 200 days a−1.with Rothera having snow (orrain on over 300. This value is higher than the 249 precipitation days computed from the Rothera past weather synoptic reports (mean of 1982-96), although at thai period there was no observer at the station keeping a continuous watch on the weather, so the reported data would be expected to have a slight negative bias. A further factor in reducing the number of precipitation days at the station will be the shel-tered location that it occupies in the lee of Adelaide Island, a topographic feature lhat is not represented in the model.
The results for the Larsen Ice Shelf show clearly the marked snow shadow that the Peninsula creates, the site having less than 50% of the annual accumulation at Rothera. Surprisingly for such a southerly site, the Bryan Coast receives almost 85% of the precipitation of Rothera, although the orography rises very rapidly in this part of the
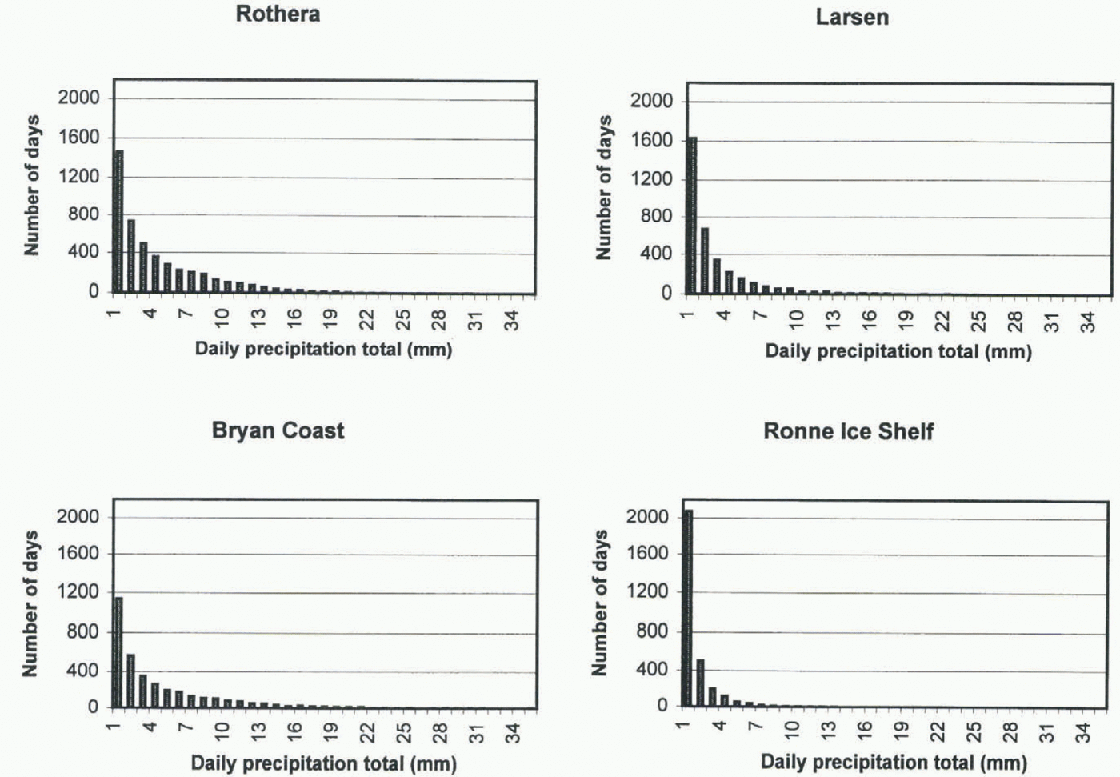
Frequency ofdifferent daily precipitation totals for Rothera, the Larsen Ice Shelf, the Bryan Coast and the Renne Ice Shelf. The data are from the ECMWF re-analysis and cover the period 1979-93. A minimum precipitation threshold of 0.1 mm has heen used.
Antarctic, and air that is forced to rise from sea level to 119 m in one grid length of the model will give a large amount of precipitation. However, the model orography field in this area is very close to reality, so it is felt thai the model precipitation totals will not be too much in error. in fact the GB map of annual accumulation gives about 0.9 m w.e. in this area, compared to 0.93 mw.e. from the ECMWF re-analysis. There is also good agreement between GB and the model in the area of the Rönne lee Shelf, where both sources of data have an annual accumulation close to 0.2 m.
Daily precipitation totals during /993for Rothera, the Larsen Ice Shelf, the Bryan Coast and the Renne Ice Shelf The data arefrom the ECMWF re-analysis.
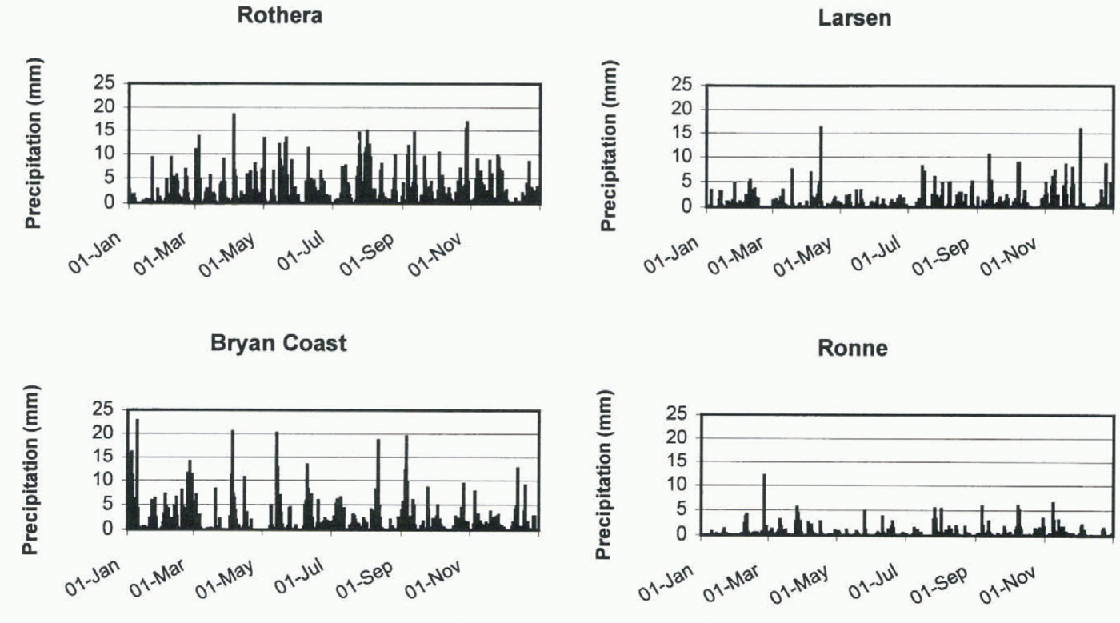
Figure 5 provides histograms of the daily precipitation totals at the four sites, giving an indication of the frequency of different daily intensities. All four sites are dominated by very light daily falls of snow, which is in agreement with the subjective observations of snowfall made at Rothera as part of the synoptic reporting programme (Turner and others, 1995). Larger daily totals of precipitation are more common on the western side of the Peninsula, and the Bryan Coast in fact receives more daily falls of20 mm than Rothera. This is probably a result of the rapid rise in orography discussed above. On the eastern side of the barrier there is an even greater preponderance of slight precipitation, the Room-Ice Shelf in particular having very few daily falls of more than 5 mm, no doubt a result of its location well removed from the main depression tracks.
In order to investigate the synoptic background to the precipitation events, the year 1993 was examined in detail using the FCMWF data, observations from the research stations, and high-resolution satellite imagery collected at Rothera Station on the western side of the Peninsula. The year 1993 had slightly less precipitation than average over most of the Peninsula, although there was more than the mean over the southern part of Alexander Island.
Figure 6 shows plots of the daily precipitation amounts at the four sites during 1993. Again it is clear lhat all the locations receive a small amount of precipitation on many occasions, with a few days on which much larger snowfalls occur. in the following sections we examine the synoptic backgrounds to the slight, moderate and heavy precipitation events, using the various data av ailable.
Rothera
Being close to the latitude of the circumpolar trough, Rothera comes under the influence of many mobile depressions arriving from a generally westerly direction. These systems vary from very minor disturbances to extremely deep depressions with very active frontal bands. During 1993 the greatest daily precipitation totals apparent in figure 6a were all associated with large, synoptic-scale depressions arriving over the area from the west. in order for the lows to give large amounts of precipitation, they need to draw in moist, usually mid-latitude air masses, although the lows themselves do not need to have moved into the Antarctic from lower latitudes, and many of the most active depressions, in terms of the precipitation they gave, moved towards Rothera from the west. The lows that gave the most precipitation all had very pronounced cloud signatures in the satellite imagery, with high cloud along the frontal bands, and the upper air analyses usually showing amplified upper-air long waves bringing the moist air southwards.
Day s of zero precipitation were usually associated with cloud-free antieyclonic systems, which at these latitudes are usually short-lived, or outbreaks of dry continental air in southerly flow.
Larsen Ice Shelf
This area still had a large number of days with precipitation, although the amounts that fell were usually quite small. However, as can be seen in figure 6b, there were quite a few days with falls of 5 mm or more of precipitation. Because the Peninsula is such a high barrier, there are quite different precipitation regimes on the eastern and western sides. Although many active frontal bands arrive on the western side and appear to cross into the area of the Larsen Ice Shelf, the correlation between the precipitation at Rothera and the Larsen during 1993 is low (0.25) and the major precipitation events in figure 6a are not the same as those found on the Larsen. At the latter site the largest daily precipitation totals seem to be the result of two types of synoptic situation: first, lee cyclogenesis events, often taking place on pre-existing frontal bands that have crossed from the western side (Turner and others, in press); secondly, active fronts that have approached the Larsen Ice Shelf from the east or northeast as they rotated in a clockwise direction around a low centre located in the Drake Passage or near the tip of the Peninsula. These cloud bands often appear to be warm fronts drawing warm, moist air masses from lower latitudes.
Bryan Coast
This location is to the south of the circumpolar trough and often under the influence of relatively dry air masses, so, as can be seen from figure 6c, it has fewer days with 5 10 mm of precipitation than Rothera, where they come from the eastward-moving depressions. However, it does have quite a lew days of 10-20 mm of precipitation, so that the annual mean total is 85% of that found at Rothera. These major precipitation events usually occur when there is a strong north-south flow over the Bellingshausen Sea as a result of high pressure over the Peninsula and a deep low over the Amundsen Sea. The daily total precipitation is greatest when there is a warm frontal band embedded in the flow, although a significant accumulation can still occur without frontal enhancement. Because such a blocked circulation regime can persist for several days, the large daily totals found in figure 6c are often grouped together, separated by periods of much less precipitation.
Ronne Ice Shelf
This area is again well removed from most of the synoptic-scale depression activity, and daily precipitation amounts are usually very small. On most occasions there is a general convergence of air on the ice shelf from katabatic winds flowing down from the high plateau, resulting in outflow onto the Weddell Sea and little precipitation on the shelf itself. However, figure 6d shows that, as on the Bryan Coast, relatively large daily precipitation totals of the order of 4 6 mm do occur on some occasions. Such events require a feed of moist air, which can come about for two reasons. First, when there is low pressure in the Weddell Sea there is a north or northeasterly air flow onto the ice shelf, which can give precipitation, especially if there is a front embedded in the flow. Examination of several cases suggests that the largest amounts of precipitation occur when a lee cyclogenesis event has occurred towards the base of the Peninsula, giving strong northeasterly flow onto the ice shelf. Reasonable amounts of precipitation can also occur when there is a quasi-stationary low near the lip of the Peninsula or in the Drake Passage, although more mobile systems are less effective in transporting moist air to such southerly latitudes. Secondly, there are also occasions when lows cross the base of the Peninsula from west to cast, introducing moist maritime air masses from the Bellingshausen Sea and giving moderate accumulation of precipitation.
Mösl of these lows do nol have the classic frontal structure of the more northerly systems, and on satellite imagery appear to have a fairly disorganised cloud signature.
Implications For Climate Change
From the above it is clear that depressions are the major factor in determining the precipitation across the Peninsula, either because of their frontal bands coming into contact with the barrier or because of their establishing a feed of mild, mid-latitude air into the region. Any changes in the tracks or frequency of depressions will therefore have an ellecl on the precipitation distribution. The study has revealed that the Peninsula is a remarkably effective barrier, giving quite different synoptic environments on either side, which is reflected in the amounts of precipitation received and the conditions that give the snowfall.
Although some studies of the relationship between the climate of the Antarctic and the atmospheric and oceanic conditions at lower latitudes have been carried out (Reference Smith and StearnsSmith and Stearns, 1993), it is by no means clear flow even such a large signal as the Fl Niño Southern Oscillation (ENSO) affects the Antarctic region. Reference Cullather, Bromwich and van WoertCullather and others (1996) examined flow ENSO events have affected Antarctic net precipitation as determined from atmospheric water-vapour flux measurements obtained from ECMWF analyses. They found that the South Pacific sector between 120° and 180° wwas a region of large precipitation variability where net precipitation was correlated with the ENSO events during the 1980s. Although further work is required to investigate the exact mechanisms that link the tropical Pacilic and the Amundsen/Bellingshausen Seas areas, there is growing evidence that the lower-latitude areas have a marked effect on precipitation falling in the Antarctic Peninsula region. It is hoped that further work using the ECMWF model fields will shed light on the links between atmospheric flow regimes and the mass balance of the area.
Acknowledgements
This work was partly funded by the EU Framework IV project “Climate sensitivity of glacier mass balance: the effect of topographic barriers” ENV4-CT95-0105.



