


1. Introduction
In modern democracies, women make up a minority of the top positions in both politics and the national bureaucracy.Footnote 1 Consequently, women are involved disproportionately little in the formulation of policies and exercise of government power, even in public bureaucracies where women make up an almost equal share. What explains the relative stagnation of women civil servants’ careers relative to their male counterparts? This question—which we tackle in this article—is important both for those studying the functioning of public bureaucracies as well as for those studying gender inequality among policymakers and in society more broadly.
While research has investigated the effects of female decision-makers on policy outcomes (Chattopadhyay and Duflo, Reference Chattopadhyay and Duflo2004), we have only recently seen studies of factors that promote the advancement of women to top policymaker positions. However, this research has mainly focused on the career progression of elected politicians (Folke and Rickne, Reference Folke and Rickne2016a; Besley et al., Reference Besley, Folke, Persson and Rickne2017) and legislative staff (Ritchie and You, Reference Ritchie and You2021). In the bureaucracy, however, the causes of gender inequality in career progression remain sparsely studied. Consequently, in the context of developedFootnote 2 countries, we know almost nothing about why the careers of female bureaucrats stagnate before their male counterparts.
Scholars have suggested that this gender inequality stems from women bureaucrats facing so-called “glass ceilings” during their careers (Guy, Reference Guy1993; Sabharwal, Reference Sabharwal2015), i.e., informal procedures which impair the careers of women but not men. The existing research on the gender gap in bureaucracies has exclusively examined the presence of women as top managers in bureaucratic institutions (Groeneveld et al., Reference Groeneveld, Bakker and Schmidt2020; Grøn et al., Reference Grøn, Opstrup, Salomonsen and Villadsen2021). While these studies offer uniquely important knowledge on women in top management positions in the civil service, they cannot inform us about how men and women progress throughout their careers in the public bureaucracy, and therefore cannot examine and compare men’s and women’s roads to top management. This hampers the ability to thoroughly examine whether a “glass ceiling” is limiting women’s advancement into management positions. Consequently, we know little about the conditions under which such a ceiling can be broken, and at which stage women civil servants’ careers are expected to slow down or accelerate.
In this article, we remedy this gap by studying how men and women progress in the central government bureaucracy. We specifically study the effects of government ideology (i.e., left-wing or right-wing parties in government)—a classic determinant of policy differences within and between countries (Franzese, Reference Franzese2002; Potrafke, Reference Potrafke2017) which has not received much attention in relation to gender inequality in the top civil service.Footnote 3 While right-wing and left-wing governments may differ in their ideological commitment to gender equality policies (Carozzi and Gago, Reference Carozzi and Gago2023), the question is whether this difference extends to different career progression of women civil servants—especially in civil service systems without direct political appointments.
We argue that civil servants’ career paths are conditional on the government in power even in systems not dominated by direct political appointees. Different governments will have different policy priorities but also vary in their efforts to suppress gendered-inequality patterns throughout the formal organization. An example of this is through ministerial personnel policy, where some governments might prioritize more inclusive, e.g., parental leave policies. Therefore, shifting governments provide shocks to the career paths of civil servants, and these shocks can very well have different consequences for men and women as they progress in the civil service.
Consequently, we argue that women bureaucrats’ career progression improves during left-wing governments, because left-wing governments prioritize gender egalitarian personnel decisions. This implies that women in the civil service will see greater stagnation in their careers when right-wing governments come into power.
We test our argument using the especially hard case of Denmark, one of the world’s most gender-equal societies with a strong norm of meritocracy and a lack of political appointees in its central government bureaucracy. We use a novel dataset of every Danish central government civil servant measured quarterly from 1998 to 2019. The dataset, thus, covers the career trajectories of 48,312 civil servants—of whom more than 5,000 progressed into management roles—during a 20-year period. This extensive and granular dataset allows us to compare the progression of all women and men throughout the Danish civil service. Utilizing the panel structure of the data, we employ a series of difference-in-differences designs, where we compare women and men’s career progression under shifting left-wing and right-wing governments.
Consistent with our argument, we find that women bureaucrats progress more slowly than men under right-wing governments, while men and women bureaucratsFootnote 4 progress at the same pace under left-wing governments. We find this difference in progression under right-wing government to be concentrated in the upper half of the bureaucratic hierarchy—women are less likely to enter any type of management position when a right-wing government comes into power. Importantly, while the effect is present for junior management positions, it is particularly pronounced for positions where one or more ministers are directly involved in the promotion decision.
The results show that the “glass ceiling,” and where it kicks in, is contingent on the ideological leaning of the government in power. Women are far less likely to enter even the most junior management position under a right-wing government. In the long run, over the duration of their career, this stagnation accumulates, and they lose the equivalent of 10 years of their career relative to men.
Our results have important theoretical contributions for the existing literature and have implications for understanding the barriers that women face in progressing into top management in the civil service. The paper makes several contributions to existing literature in political science and public administration. First, we contribute to the literature on representative bureaucracy (Meier, Reference Meier2019). Although women make up 60% of the Danish civil service and the share of women in senior positions increases in our period of analysis (see Figure 1), our results show that women face barriers when progressing in the civil service that men do not. This shows how important it is to consider gender differences in progression rather than simply the gender composition of the civil service. Hence, women civil servants can make up the majority of a country’s bureaucrats and experience improved representation in management positions, but still face barriers when ascending the ranks that men do not have to tackle.
Proportion of senior and non-senior positions held by women.

Second, we contribute to research on political representation, and women in politics have shown how various stages of the political pipeline can compose gender-skewed bottlenecks (Folke and Rickne, Reference Folke and Rickne2016c; Kjaer and Kosiara-Pedersen, Reference Kjaer and Kosiara-Pedersen2019; Thomsen and King, Reference Thomsen and King2020; Kjøller and Pedersen, Reference Kjøller and Pedersen2025). We study another type of policymaker, namely civil servants, and show that even in a meritocratic and gender-egalitarian context like the Danish civil service, women face barriers compared to men when ascending the career ladder. Additionally, our results speak to the role that incumbent governments play in shaping the national civil service (Fiva et al., Reference Fiva, Geys, Heggedal and Sørensen2021; Kappe and Schuster, Reference Kappe and Schuster2022). The results suggest that greater attention to, and official prioritization of, gender equality might produce important results with regard to achieving more representation of women in the top civil service.
2. Previous research
Previous research on the determinants of women policymakers has mainly focused on the career progression of elected politicians (O’Brien and Rickne, Reference O’Brien and Rickne2016; Folke and Rickne, Reference Folke and Rickne2016b; Reference Folke and Rickne2016c; Besley et al., Reference Besley, Folke, Persson and Rickne2017; Baumann et al., Reference Baumann, Back and Davidsson2019; Folke et al., Reference Folke, Rickne and Smith2021) and the appointment of women as ministers (Krook and O’Brien, Reference Krook and O’Brien2012; Barnes and O’Brien, Reference Barnes and O’Brien2018; Stockemer and Sundström, Reference Stockemer and Sundström2018; Armstrong et al., 2023). However, gender inequality and women’s career progression among civil servants remain sparsely studied.Footnote 5 Recently, we have seen research on women’s public sector representation (Gram and Grøn, Reference Gram and Grøn2020; Groeneveld et al., Reference Groeneveld, Bakker and Schmidt2020; Grøn et al., Reference Grøn, Opstrup, Salomonsen and Villadsen2021). However, these studies tend to focus on the existence of women top managers in bureaucratic institutions.Footnote 6 While that question is of utmost importance, we still need answers to the question of what causes career progression of individual women bureaucrats. This is needed to answer the question of whether there is a glass ceiling preventing women bureaucrats from reaching the top echelons of the civil service.
Consequently, in the context of developed countries, we know almost nothing about the factors which further or inhibit the career progression of women bureaucrats relative to their men counterparts. We argue that government ideology has a non-trivial influence on women civil servants’ career progression. In the next section, we lay out a theory of this relationship.
3. Government ideology and women civil servants’ career progression
We expect the career advancement of women civil servants to be affected by the ideology of the incumbent government, and more specifically that women civil servants progress more slowly in their careers under right-wing government as opposed to left-wing governments. In the following subsections, we lay out the assumptions, mechanisms and subsequent hypotheses associated with this argument.
3.1. How governments shape their civil service
Our argument is based on the assumption that even in civil service systems with only a few political appointees, incumbent politicians still have the ability to (partly) shape the composition of the national civil service workforce, including the gender makeup of the top civil service. This is in line with recent research which suggests that government ideology affects characteristics of the national civil service (Dahlström and Holmgren, Reference Dahlström and Holmgren2019; Bolton et al., Reference Bolton, de Figueiredo and Lewis2020; Fiva et al., Reference Fiva, Geys, Heggedal and Sørensen2021; Kappe and Schuster, Reference Kappe and Schuster2022). Managers and other top decision-makers in the bureaucracy act as agents of the political leadership—especially when working within the central ministerial hierarchy—and are at least partly incentivized to follow the stated (or assumed) priorities of the political leadership when deciding their personnel policy. Consequently, even in civil service systems without direct political appointees, political parties in power can indirectly shape the composition of civil service through the setting of official personnel policies and stated political goals and priorities. As we outline below, we believe that right-wing governments are less attentive to issues of gender equality, and that this affects the career progression of women civil servants under right-wing governments compared to left-wing governments.
3.2. Different ideological preferences for gender equality and their consequences for women’s career progression
Existing research suggests that there are large differences in policy preferences between political parties of different ideologies (Iversen and Soskice, Reference Iversen and Soskice2006; Potrafke, Reference Potrafke2017; Reference Potrafke2018; Bandau and Ahrens, Reference Bandau and Ahrens2020), including within gender-sensitive policy areas (Carozzi and Gago, Reference Carozzi and Gago2023). Additionally, we know from previous research that there are important differences in how parties recruit and support their candidates (Caul, Reference Caul1999; Chiva, Reference Chiva2014). We argue that the ideology of the government shapes its priorities and attentiveness with regard to gender equality when setting its personnel policy. Through this, the government shapes the level of gendered promotion patterns in the public bureaucracy and ultimately the scope of disadvantage women bureaucrats face in career advancement. We go through the argument in detail below.
Right-wing political parties view gender inequality as a less salient issue, and tend to view gender equality through the lens of “equality of opportunity,” where it is assumed that everyone can attain career progress when given the same formal opportunities for doing so (Lühiste and Kenny, Reference Lühiste and Kenny2016, 630). It is natural to expect that this core view among right-wing parties will shape their behavior while in government. That is, they will not be willing to spend the time and resources on counteracting gender inequality in the civil service and ensuring the representation of women in bureaucratic management positions. This is not to say that we assume that a right-wing party necessarily takes a gender-traditionalist view of the issue of women’s representation in the bureaucracy, but only that gender equality (including in personnel decisions) is usually not a stated priority for right-wing governments. As a consequence, managers and decision-makers in the public bureaucracy have little incentive to take into account the questions of gender equality when making promotion decisions under right-wing governments. This means that promotion decisions are less likely to counteract formal and informal structures which put women at a disadvantage in career progression in the public bureaucracy. These may include failure to take into account maternity leave when assessing experience and seniority, as well as the lack of attentiveness to counteracting so-called gendered promotion patterns where men managers tend to promote other men into leadership positions (Guldiken et al., Reference Guldiken, Mallon, Fainshmidt, Judge and Clark2019; Bossler et al., Reference Bossler, Mosthaf and Schank2020), which puts women at a disadvantage in organizations where men dominate the top leadership. This phenomenon seems to be (partly) rooted in different networking patterns between men and women in both private and public organizations (Rho and Lee, Reference Rho and Lee2018; Cullen and Perez-Truglia, Reference Cullen and Perez-Truglia2019).
Left-wing governments, on the other hand, have a preference for equality (Iversen and Soskice, Reference Iversen and Soskice2006), including gender equality (Wängnerud and Sundell, 109-113) and greater representation of women (Santana and Aguilar, Reference Santana and Aguilar2019). Research on candidate emergence shows that left-wing parties tend to follow an “equality of outcomes” logic when they recruit candidates (Lühiste and Kenny, Reference Lühiste and Kenny2016, 630). Again, we expect this to carry over into their priorities while in government and that it will shape the public sector personnel policies under their rule. Left-wing governments and their ministers should be more active in advancing personnel policies in the public bureaucracy that counteract gender inequality and gendered promotion patterns. These policies include requiring transparency in the gender makeup of promotions and setting official goals for gender equality in ministries and government agencies. Ministers from left-wing parties might also (weakly) prefer to hire and promote women, when they are directly involved in the hiring and promotion decisions at the very top of the ministerial hierarchy.
How differing government priorities and personnel policies may shape gender equality in the public sector can be illustrated with a case from the Danish context we study. In particular, gender equality was a central issue for the social democratic governments in the 1990s that were led by Prime Minister Poul Nyrup Rasmussen. This culminated in a new Gender Equality Act which mandated that, when filling management positions in the public sector and making appointments to public committees and boards, decision-makers should strive towards a gender balance of at least 40% women (The Ministry for Digitalization and Gender Equality, 2024). While the act recognizes that gender equality is not possible in all cases, the goal of gender balance was to take precedence over any restriction on the size and composition of committees and boards mandated in other legislation (The Ministry for Digitalization and Gender Equality, 2024). The act also stipulated that gender equality on committees and boards, as well as within the work scope of all ministries, should be monitored by the newly appointed Minister for Gender Equality (Raxner, Reference Raxner2023). The original intention with this new ministerial position was that it should have the authority to supervise the work of other ministries and help them ensure gender equality in their appointments as well as other aspects of their work (Stavnsbjerg, Reference Stavnsbjerg2022). Among other things, the minister prepares a report every 3 years that describes the extent to which various public institutions are able to achieve gender equality (The Ministry for Digitalization and Gender Equality, 2024). This act was relatively expansive for its time, and it provided a very clear signal to career civil servants that the government strongly prioritized gender equality at the management levels of the Danish public sector. However, when the incumbent social democratic government lost power, the incoming center-right Prime Minister Anders Fogh Rasmussen had publicly speculated that it might be worthwhile to close down the newly formed Ministry for Gender Equality (Laneth, Reference Laneth2001). While this did not happen, we propose that such signaling is one way the new government showed that it put less emphasis on gender equality—which should have been noticed by the upper echelons of the national civil service.
As the anecdote illustrates, there is plenty of discretion in how strongly governments of varying ideologies will pursue the goal of gender balance in leadership positions in a meritocratic bureaucracy. This is in addition to the differing personnel policies, which may differentially affect the careers of men and women that the minister may wish to impose. An example of this is how tasks are distributed around an employee’s parental leave. This shows how the proposed ideology effects do not require that the minister is personally involved in the actual promotion of civil servants. Instead, top bureaucrats face stronger incentives to be attentive to gender equality in hiring and promotion decisions under left-wing governments—which have signaled that they prioritize gender equality in management—but less so under right-wing governments—which have signaled that they find gender equality less important. These effects should thus be stronger the closer the promotion decision is to the political leadership, where the attentiveness to the priorities and wishes of the political leadership should be greater. However, there should be ideological effects on women’s career progression at all levels of the bureaucracy. As lower-level civil servant managers observe that their ministers either do or do not have strong preferences for promoting women to the top, they will also either make or not make an effort to overcome gendered promotion patterns in the lower end of the bureaucratic hierarchy.
4. The Danish national civil service
We test our hypotheses on data from the Danish central government civil service. The Danish central government civil service is comprised of various ministries with associated agencies and various quasi-autonomous institutions (including universities) and consists of a little under 200,000 individualsFootnote 7 working within general government administration (including tax administration), (higher) education, defense, diplomacy, policing, environmental protection as well as various cultural institutions. According to collective agreement statistics,Footnote 8 around one third of central government employees have the equivalent of higher tertiary education.Footnote 9
4.1. Women civil servants
The core of the central government civil service is the central ministerial bureaucracy of each ministry (“centralstyrelser” in Danish) consisting of the central ministerial bureaucracy closest to the minister and certain core agencies. These are the focal points of policy and lawmaking power in the Danish public sector and the main focus of our study. As shown by the grey line in Figure 1, the percentage of women civil servants in the central ministerial bureaucracy has fluctuated around 60% but remained quite stable at that level over time. However, as the black line shows, women tend to be underrepresented among the top leadership of the Danish civil service. While the representation of women in management positions improved from 2000 through 2008, it has since stagnated and even declined from 2014 onward. At the high point, 30% of senior managers were women.
4.2. Hierarchy and career progression in the Danish civil service
Career progression in the central ministerial bureaucracy happens through the so-called salary step (“skalatrin”) and salary frame (“lønramme”). All employees get a base salary corresponding to their salary step. Employees who enter into government service with no prior experience start at a salary step of one, the lowest level. The highest level is 55. Hence, the salary step is the most basic measure of a bureaucrat’s career progression.
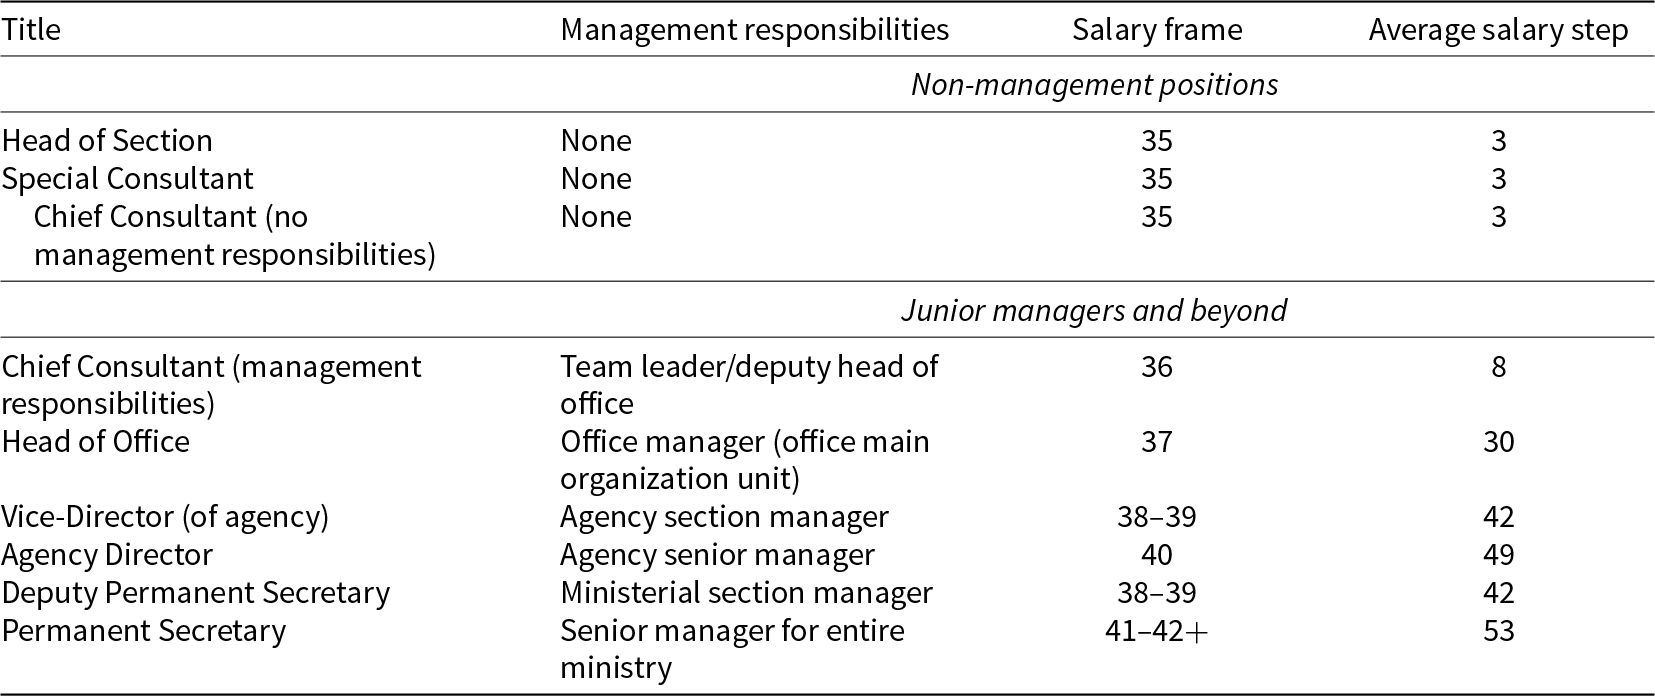
The so-called salary frame is used to classify different types of civil service jobs into (a) non-management and (b) different levels of management. Civil servants without any management responsibilities (Heads of Section and Special Consultants) are in salary frame 35. So-called chief consultants (with management responsibilities) are the most junior civil servants with any type of minor management responsibilities. They are in salary frame 36. The Deputy Permanent Secretary (“afdelingschef”) and the Vice-Directors of the agencies are the lowest positions in top management. They are placed in the salary ranges 38 or 39. The most senior managers are the Agency Directors and Permanent Secretaries (“departementschefer”), who, respectively, are in the 40 and 41–42+ salary ranges.
There is a close connection between the salary step and the salary frame. Within each salary frame, upward movement in salary steps is determined by seniority and happens automatically every few years. Each position comes with a maximum salary step—more senior positions come with a higher maximum salary step, and hence more progression potential. This implies that the salary frame determines how much further a civil servant can progress in her current salary step. Even in management positions, the base salary is determined by the salary step, which progresses with seniority. Automatic progression happens incrementally, one salary step at a time. This implies that a sudden, large shift in a civil servant’s salary step can only come about through a discretionary promotion. Table 1 contains an overview of different position types in the central ministerial bureaucracy along with the salary ranges and salary steps associated with those positions.
Position types in the central ministerial bureaucracy

Table 1 Long description
Columns list title, management responsibilities, salary frame, and average salary step. Under, None Management Positions, Head of Section, Special Consultant, and Chief Consultant no management responsibilities each have management responsibilities listed as None, salary frame 35, and average salary step 3. Under, Junior Managers and Beyond, Chief Consultant management responsibilities is Team leader or deputy head of office, with salary frame 36 and average salary step 8. Head of Office is Office manager office main organization unit, with salary frame 37 and average salary step 30. Vice Director of agency is Agency section manager, with salary frame 38 to 39 and average salary step 42. Agency Director is Agency senior manager, with salary frame 40 and average salary step 49. Deputy Permanent Secretary is Ministerial section manager, with salary frame 38 to 39 and average salary step 42. Permanent Secretary is Senior manager for entire ministry, with salary frame 41 to 42 plus and average salary step 53.
Notes: Source for how job types are placed in salary frames: https://www.djoef.dk/r-aa-dgivning/l-oe-n/l-oe-nsammens-ae-tning/benefits-og-l-oe-n/din-l-oe-n-som-offentlig-chef.aspx. There is no exact correspondence between the salary range and salary level. Therefore, we show the average salary level for each salary range.
4.3. Political influence in the civil service personnel decisions
All job openings in entry-level positions and management positions in the civil service must be advertised publicly. The Danish civil service is characterized by strong meritocratic norms in promotions and appointments throughout the formal hierarchy. Civil servants are officially appointed solely based on merit, and political appointees and promotions based on political loyalty and attachment are generally absent. The only exception to the absence of political appointees is that cabinet ministers can appoint one to three special advisors bypassing the ministerial chain of command (Christensen et al., Reference Christensen, Klemmensen and Opstrup2014; Öhberg et al., Reference Öhberg, Munk Christiansen and Niklasson2017). These special advisors are picked by the ministers and leave office with them. Otherwise, central ministerial civil servants from entry level to the very top tend to be career civil servants, often with a degree in law, economics, political science, or other social sciences. Consequently, even senior civil servants such as permanent secretaries in the ministries are not automatically replaced when a new government comes into office, and will thus often serve under different governments with different ideologies.
Nonetheless, Danish ministers have great influence over senior civil service appointments and personnel policies (Christensen et al., Reference Christensen, Klemmensen and Opstrup2014). Danish ministers are sovereign within their own ministries and decide their organization and policy direction under the constraints imposed by the rule of law, collective agreements, as well as parliamentary oversight (Mortensen, Reference Mortensen, Pallesen, Blom-Hansen, Christiansen and Serritzlew2019). Civil servants are thus expected to follow the policy direction of their minister, and civil servants—even at lower levels—are frequently informed about the priorities and policy orientation of their minister. While non-partisan, Danish civil servants’ work conditions and the priorities they have to pursue are heavily influenced by political preferences.
With regard to ministerial involvement in hiring and promotion decisions, the most senior positions—Agency Directors and Permanent SecretariesFootnote 10—must be processed by the government’s board of appointments (Gram and Grøn, Reference Gram and Grøn2020), usually consisting of the Prime Minister and the Minister of Finance. Hence, for these top positions, there is direct involvement of multiple ministers in the hiring process. But there is still no direct politicization of these positions. The job announcements are public, political attachments and loyalties are not hiring criteria, and merit is still the official criterion for the hiring decisions. Consequently, these top civil servant positions are almost always filled by career bureaucrats with experience in serving under several governments with different ideologies (Trangbæk, Reference Trangbæk2022).
For lower-level senior positions within each ministry—such as Deputy Permanent Secretaries and Vice-Directors—the relevant minister will still be involved, but the appointment does not have to be processed by the government’s board of appointments. Even at levels below that, where promotion and hiring decisions are normally made by other civil servant managers, these might feel pressure to hire and make appointments in accordance with government and minister preferences (Gram and Grøn, Reference Gram and Grøn2020), which could include greater attention to gender equality in hiring and promotion decisions in the case of a left-wing government. Anecdotal evidence indeed suggests that Danish ministers shape the composition of their top civil service, including through appointments and reshuffles.Footnote 11
Consequently, the Danish national civil service ranks among the least politicized in the world in terms of political appointments.Footnote 12 However, Danish ministers and governments still have tools available to shape general personnel policies and priorities in their ministries and can be involved in meritocratic hiring decisions at the top level of their organizations. Consequently, ministers can directly and indirectly—we argue—influence the level of gender equality in internal hiring and promotion decisions.
4.4. Gender equality and the political prioritization of gender equality
While Denmark is generally considered one of the world’s most gender-equal societies,Footnote 13 policies concerning gender issues do seem to shift between left-wing and right-wing governments in Denmark. As mentioned above, it was a left-wing government that appointed the first minister for gender equality in Denmark in 1999 and introduced a focus on gender quality issues among external advisory boards at the central government level (Stavnsbjerg, Reference Stavnsbjerg2022). Furthermore, the so-called YDUN program, which sought to provide funding for women researchers, was introduced under a Danish left-wing government and later abolished under an incoming right-wing government. Another example is the state-sponsored feminist think tank (Kvinfo), which has tended to have its funding increased under left-wing governments and decreased under right-wing governments. While right-wing governments in Denmark are not openly against gender equality as a political goal—e.g., the Ministry for Gender Equality has not been abolished under any right-wing government since its creation in 1999—it is clear that their prioritization of gender equality issues is often lower than under left-wing governments (Stavnsbjerg, Reference Stavnsbjerg2022). According to our argument, this should impact the incentives to pay attention to gender equality issues for the civil service managers. Danish party politics therefore fit our theoretical assumption for why government ideology might impact women’s career progression in the bureaucracy even if right-wing parties are not necessarily against women’s representation in the central bureaucracy.
4.5. The Danish central government civil service as a hard case
Consequently, due to strong meritocratic norms as well as the general high levels of gender equality in Denmark, the Danish central government civil service is best considered a least likely case for government ideology to be a driver for gendered inequalities in women civil servants’ career progression, and hence holds great potential for inference to other political systems with a more formal politicization and partisan profile of the bureaucracy.
5. Data and analytical strategy
Research on women’s career progression in the bureaucracy is severely hampered by data availability. Consequently, existing studies have had to resort to examining gender inequalities at different formal levels of the bureaucracy, like at entry level or among senior civil servants (Gram and Grøn, Reference Gram and Grøn2020). While these studies provide important descriptive analyses, their focus on certain parts of the bureaucratic hierarchy means that they struggle to draw conclusions about how women and men progress as civil servants.
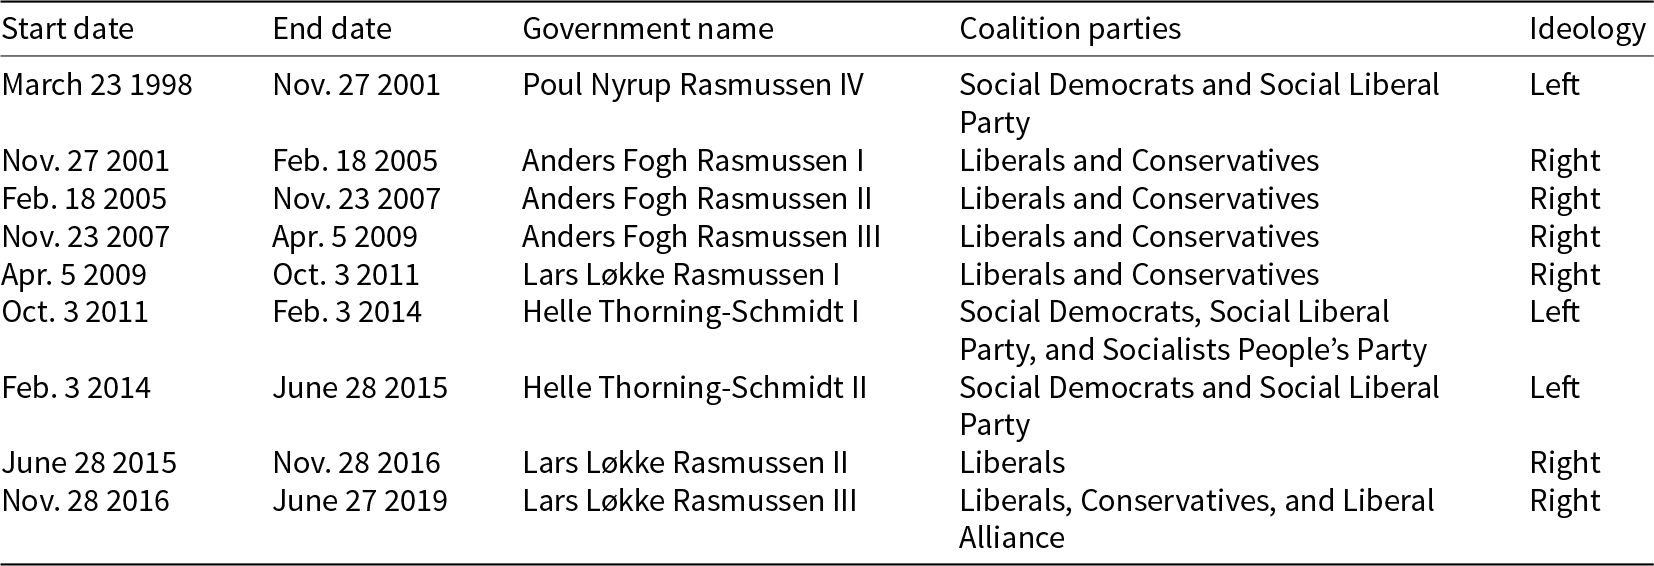
Through a special arrangement with the Danish Agency for Public Finance and Management, we obtained quarterly payroll data on the universe of people employed by the Danish central government.Footnote 14 The data spans 1998 until mid-2019, and allows us to observe civil servants frequently over time and hence examine the careers of the civil servants. During this period, Denmark had 10 governments, of which 4 were left-wing and 6 right-wing.Footnote 15 Table 2 shows the various coalitions that have formed governments during the period of analysis.
Governments during period of analysis

Table 2 Long description
Columns list start date, end date, government name, coalition parties, and ideology. Poul Nyrup Rasmussen IV ran from March 23 1998 to Nov. 27 2001 with Social Democrats and Social Liberal Party, ideology left. Anders Fogh Rasmussen I, II, and III each list Liberals and Conservatives and ideology right, spanning Nov. 27 2001 to Apr. 5 2009. Lars Lokke Rasmussen I lists Liberals and Conservatives and ideology right from Apr. 5 2009 to Oct. 3 2011. Helle Thorning Schmidt I lists Social Democrats, Social Liberal Party and Socialists Peoples Party and ideology left from Oct. 3 2011 to Feb. 3 2014, followed by Helle Thorning Schmidt II with Social Democrats and Social Liberal Party, ideology left from Feb. 3 2014 to June 28 2015. Lars Lokke Rasmussen II lists Liberals only and ideology right from June 28 2015 to Nov. 28 2016. Lars Lokke Rasmussen III lists Liberals, Conservatives and Liberal Alliance and ideology right from Nov. 28 2016 to June 27 2019.
The payroll data contains information on a variety of background information on the civil servants, e.g., their job type, and which organization in the central government they are employed in. Importantly for our purposes, it also contains the bureaucrat’s gender, salary step, and salary frame, the latter of which will form the basis of our dependent variables, since they capture the career progression of each bureaucrat.
In our main analysis, we focus on bureaucrats employed by the central ministerial bureaucracy, as they maintain close contact with the political leadership. Consequently, in our main analyses, we exclude public institutions of higher education, the armed forces, the majority of government agencies, and other parts of the government apparatus that are not directly subordinate to the minister. However, we also conduct analyses using the full universe of civil servants in Appendix C.
Our analytical strategy exploits the regularity in salary steps and salary frames in the Danish system regulating base salaries of central government employees. As mentioned above, the salary steps express the civil servant’s placement in the formal hierarchy of the civil service and allow us to infer how far they have progressed in their career. A civil servant will climb the salary steps in large part as a function of formal seniority, and this regularity lets us infer a bureaucrat’s career progression as their change in salary steps over time. Differential shifts in the career progression of civil servants simply imply that their promotion patterns are different.
Additionally, we use the salary frame to create four binary measures of whether the civil servant holds the following management positions: (a) senior positions requiring approval by the cabinet’s board of appointments, (b) agency director, (c) junior manager (salary frames 37–39), or (d) any of these management positions.
This allows us to examine whether the arrival of a right-wing government makes women progress more slowly than men through the civil service hierarchy. We investigate this by implementing a difference-in-differences strategy using variations of the following OLS model:
 \begin{equation}
CareerProgress_{i,t} = \beta(Woman_i \cdot RightGov't_t) + \gamma_i + \omega_t + \epsilon_{i,t}.
\end{equation}
Where  $CareerProgress_{it}$ corresponds to one of our two measures of civil servant
 $i$’s career progression at quarter-of-year
 $t$. That is, either the salary step,
 $\in$ (1,55), of a bureaucrat or one of four measures of whether the bureaucrat holds a position in management.
 ${RightGov't_t}$ is a binary indicator, taking the value 1 during spells of right-wing government, and
 $Woman_i$ is an indicator of whether the bureaucrat is a woman.
 $\gamma_i$ is a bureaucrat fixed effect,
 $\omega_t$ is a time fixed effect, and
 $\epsilon_{it}$ is an idiosyncratic error term. The inclusion of fixed effects for bureaucrat and time makes this a difference-in-differences estimation (Goodman-Bacon, Reference Goodman-Bacon2021). Our parameter of interest is
 $\beta$—the coefficient on the
 $Woman_i \cdot RightGov't_t$ interaction. This term expresses whether women and men civil servants progress differently in salary steps under left- and right-wing governments. In other words,
 $\beta$ shows how the gender gap in career progression changes from before to after a right-wing government comes into power. Thus, under the assumption of parallel trends in the absence of treatment, it estimates the average treatment effect on the treated (ATT). If it is negative, women will progress more slowly in salary steps and become less likely to enter management positions than men when the government changes. In difference-in-differences parlance, this implies that women compose our “treatment” group, and we compare their career progression to men’s (our “control” group) before and after the treatment (center-right government) sets in.
Note that adding fixed effects for bureaucrats accounts for time-invariant individual factors such as gender—consequently, our “women” term does not appear independently in our later regression tables. The same is true of the right-wing government indicator, which is perfectly correlated with the time fixed effects. However, our interaction term  $Woman_i \cdot RightGov't_t$ will not be perfectly collinear with the fixed effects, because it captures variation over time within individuals that differs by government ideology. Therefore, we can estimate how the effect of government ideology on promotions differs between men and women. This is precisely what the interaction term identifies.
Furthermore, in some estimations we add controls for the bureaucrat’s age (linear and quadratic terms) and the length of their central government career. We estimate these models using linear regression. While that model may be less efficient than alternatives like logit or tobit, it will recover unbiased estimates of the ATT (Angrist and Pischke, Reference Angrist and Pischke2008). However, given the very large number of parameters in the model—because we include fixed effects for all civil servants and all quarters—logit and tobit will generally be biased due to the incidental parameters problem (Angrist and Pischke, Reference Angrist and Pischke2008). Additionally, when the outcome is one of our binary indicators of being a manager, the logit model would automatically exclude all civil servants who never become managers—approximately 90% of our data. Importantly, because we estimate the linear regression models with robust standard errors, we may obtain confidence intervals that are slightly too wide. However, given that we have a very large sample, this should not lead us to make wrong conclusions (Angrist and Pischke, Reference Angrist and Pischke2008).
Let us provide a few notes on why this is a strong design. The inclusion of the bureaucrat fixed effect means that we only examine variation within the course of a bureaucrat’s career. Hence, we compare the same bureaucrat before and after a new government arrives. This implies that we automatically control for everything that remains constant over time, such as the bureaucrat’s level of education, socio-demographic background, and intrinsic ability. Additionally, the factors we consider as independent variables (mainly when a right-wing government comes into power) are outside the control of the bureaucrat. As they are unable to manipulate the partisan control of government, and we compare the same bureaucrat before and after a new government comes into power, this strategy is likely to yield good estimates.
A final methodological point that is worth noting: Models with fixed effects for unit (bureaucrat) and time may be biased downward when treatment timing varies between subjects (Goodman-Bacon, Reference Goodman-Bacon2021). This happens because men who have previously worked under a right-wing government will enter the control group for women who have not. To deal with this, we estimate an additional set of models using the Sun and Abraham (Reference Sun and Abraham2021) estimator. The estimator ensures that women are only compared to men who have never worked under a right-wing government by adding interactions between the treatment cohort and relative time to treatment. This ensures that women are compared to men who experience the same right-wing government and have seen no previous ones. Therefore, it is robust to the biases of the fixed effects estimator. Sun and Abraham (Reference Sun and Abraham2021) also have the feature that it leaves out bureaucrats who never experience a government takeovers. Importantly, both estimators yield substantively similar results.
5.1. Stylized facts
Before commencing the analysis, we use this rich dataset to present some stylized facts on the roles men and women play in the Danish civil service and how this has changed over time.
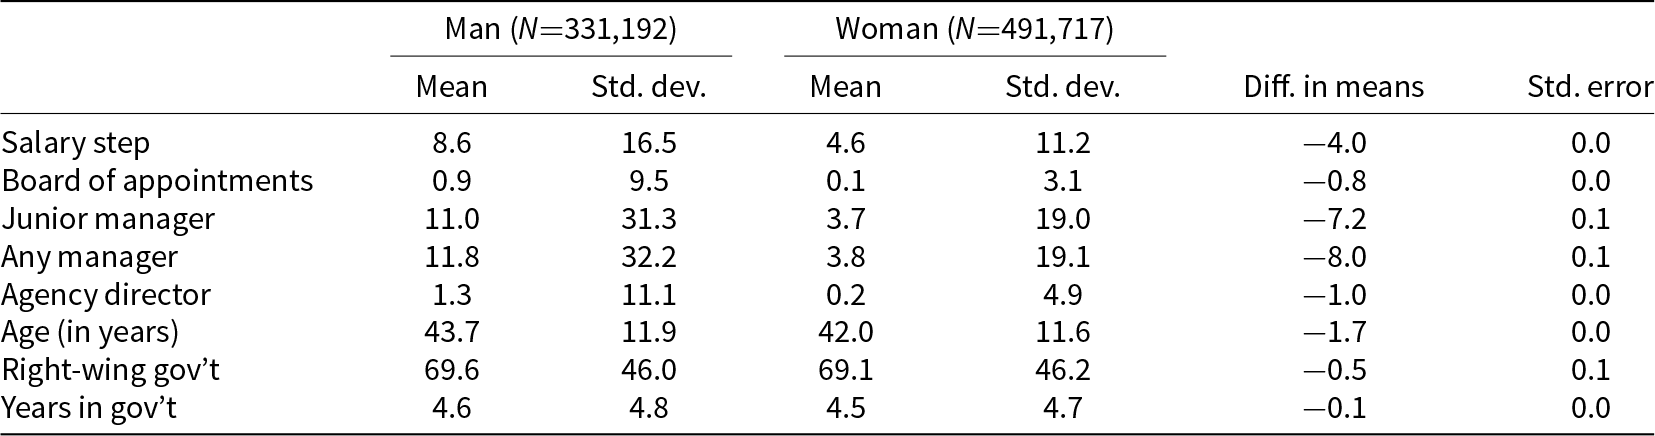
Table 3 presents overall descriptive statistics on the entire sample. Strikingly, while women account for about 60% of the 822,909 bureaucrat-quarter observations, they are far less likely to be in any of the different management positions we examine. Relatedly, there is a significant gender gap in salary step, where women on average rank four steps lower than men. Interestingly, women also tend to be younger than men.
Descriptive statistics by gender

Table 3 Long description
Descriptive statistics compare men, N 331,192, and women, N 491,717, reporting mean and standard deviation for each group plus a diff. in means and its standard error. Salary step has a mean of 8.6 with standard deviation 16.5 for men and mean 4.6 with standard deviation 11.2 for women, with diff. in means minus 4.0 and standard error 0.0. Board of appointments is 0.9 with 9.5 for men and 0.1 with 3.1 for women, diff. in means minus 0.8 and standard error 0.0. Junior manager is 11.0 with 31.3 for men and 3.7 with 19.0 for women, diff. in means minus 7.2 and standard error 0.1. Any manager is 11.8 with 32.2 for men and 3.8 with 19.1 for women, diff. in means minus 8.0 and standard error 0.1. Agency director is 1.3 with 11.1 for men and 0.2 with 4.9 for women, diff. in means minus 1.0 and standard error 0.0. Age in years is 43.7 with 11.9 for men and 42.0 with 11.6 for women, diff. in means minus 1.7 and standard error 0.0. Right wing govt is 69.6 with 46.0 for men and 69.1 with 46.2 for women, diff. in means minus 0.5 and standard error 0.1. Years in govt is 4.6 with 4.8 for men and 4.5 with 4.7 for women, diff. in means minus 0.1 and standard error 0.0.
Note: The four indicators of management positions and the right-wing government indicator are rescaled so they can be interpreted in percentage points.
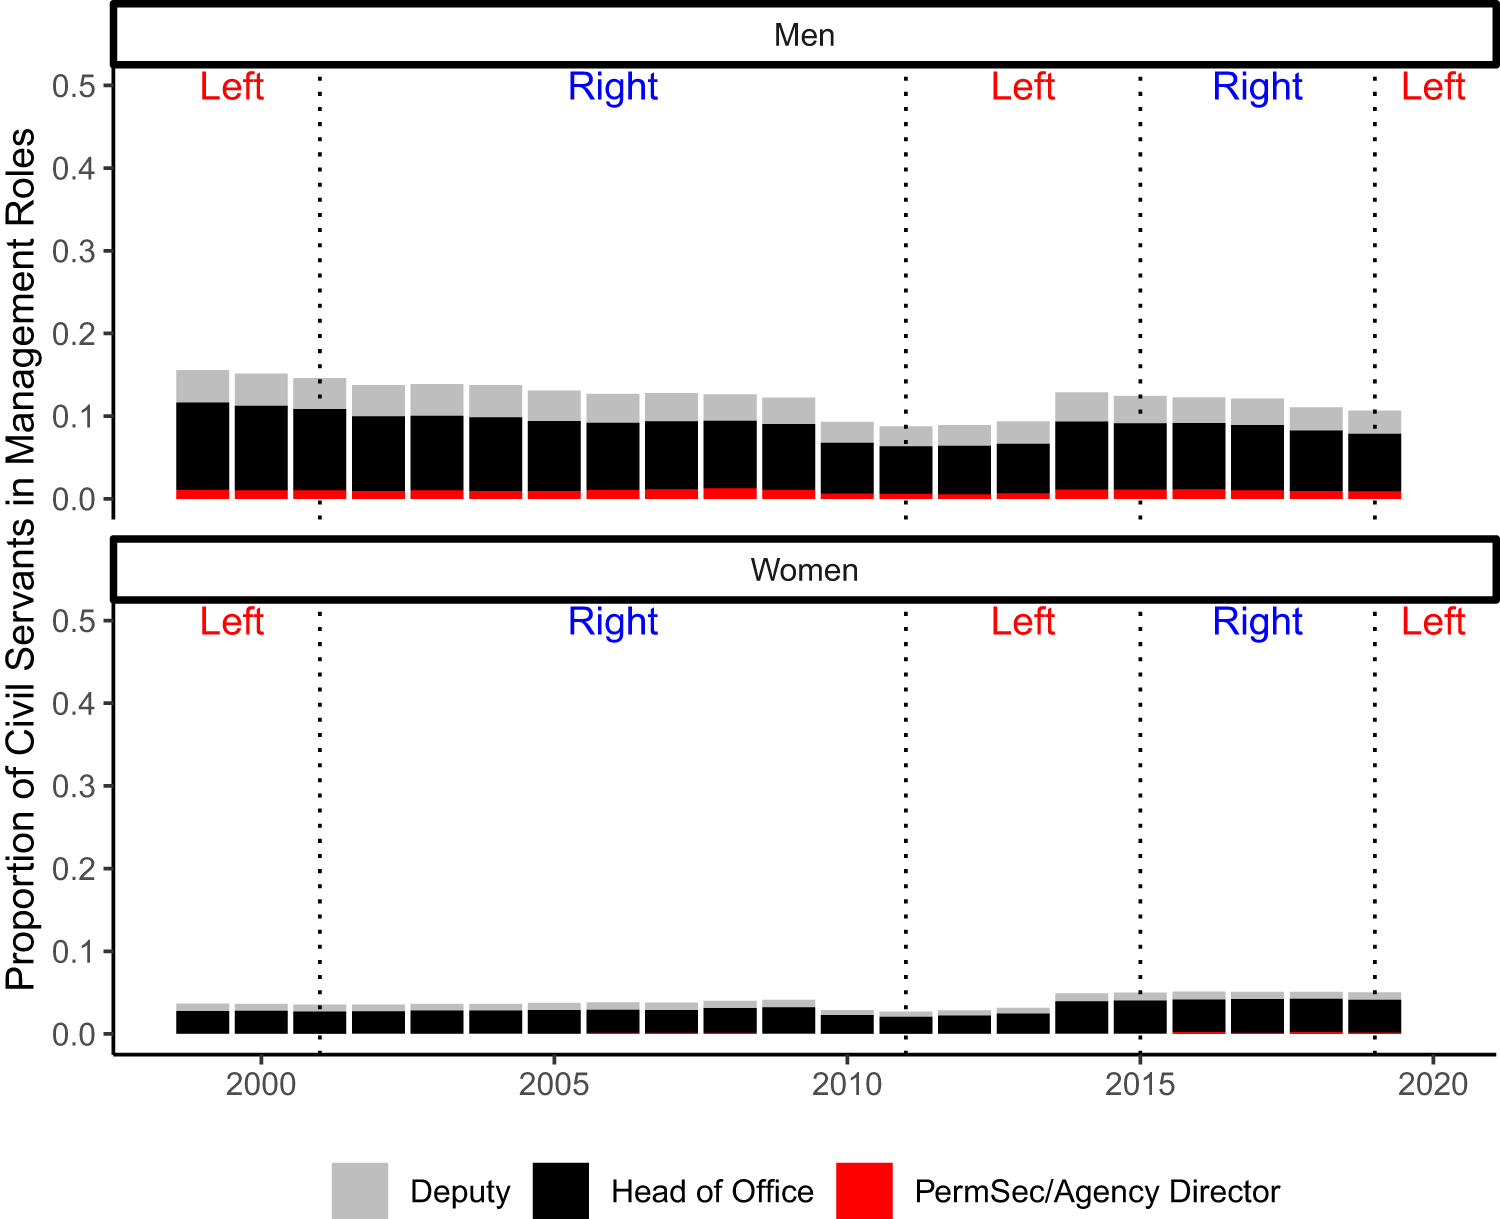
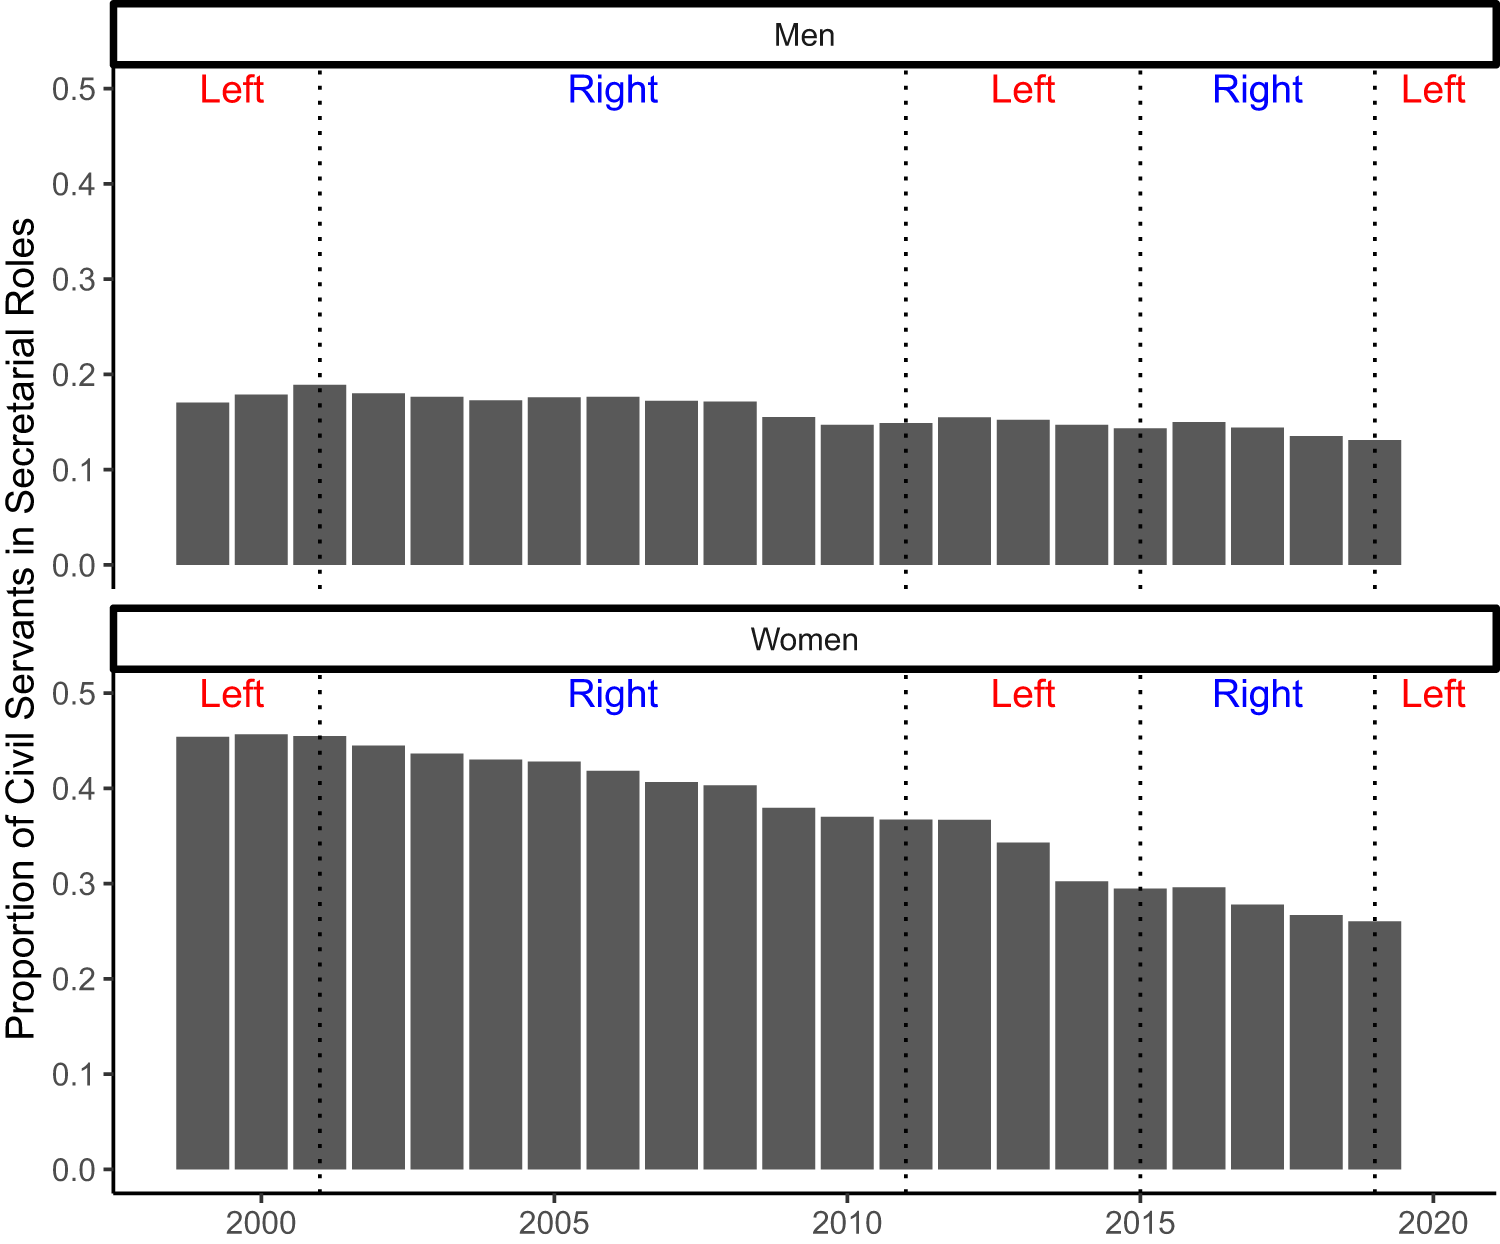
Next, we examine how gender differences in civil service roles have changed over time. First, in Figure 2, we examine the proportion of men and women working in management positions, and how this has changed over time. Interestingly, while there is a slight trend towards seeing fewer men in management roles, the representation of women in management is more or less unchanged, although there is a slight positive evolution. This indicates that the improved representation of women we saw in Figure 1 is mostly driven by a smaller management layer in the civil service.
Evolution of the management roles of men and women.

Figure 2 Long description
Two stacked bar charts labeled, Men and, Women. Vertical axis label, Proportion of Civil Servants in Management Roles. Vertical axis range, 0.0 to 0.5. Horizontal axis shows years with labeled ticks at 2000, 2005, 2010, 2015, 2020. Text above the bars includes repeated labels, Left and, Right, separated by vertical dotted lines. Legend at the bottom lists three categories, Deputy, Head of Office, PermSec slash Agency Director. Men chart: A sequence of stacked bars from the late 1990s to 2020. Bar heights are around 0.15 near 2000, around 0.13 to 0.14 through the mid 2000s, around 0.10 near 2010 and around 0.12 to 0.13 around 2015 to 2020. Women chart: A sequence of stacked bars from the late 1990s to 2020. Bar heights are around 0.03 to 0.04 near 2000, around 0.03 to 0.04 through the mid 2000s, around 0.02 near 2010 and around 0.04 to 0.05 around 2015 to 2020.
In Figure 3, we examine job types in the civil service as secretaries or in administrative support positions. As we can see, around 2000, 19% of men in the civil service worked in such positions. Over the years, there are fewer men in such roles, and around 13% of men are secretaries in 2019. The evolution is much stronger for women, where 46% worked as secretaries in the year 2000, while in 2019 only 20% worked in such positions.
Evolution of men and women in secretarial roles.

Figure 3 Long description
Two stacked bar graphs labeled Men and Women. Men graph. The horizontal axis shows years from 2000 to 2020 with tick labels at 2000, 2005, 2010, 2015, 2020. The vertical axis label reads, Proportion of Civil Servants in Secretarial Roles. The vertical axis ranges from 0.0 to 0.5 with tick labels at 0.0, 0.1, 0.2, 0.3, 0.4, 0.5. Bars appear for each year from 2000 through 2019. The bar heights are around 0.17 to 0.19 from 2000 to about 2008, then around 0.15 to 0.16 from about 2009 to 2014, then around 0.14 to 0.15 from about 2015 to 2018 and about 0.13 in 2019. Women graph. The horizontal axis shows years from 2000 to 2020 with tick labels at 2000, 2005, 2010, 2015, 2020. The vertical axis uses the same label and scale as the Men graph, ranging from 0.0 to 0.5 with tick labels at 0.0, 0.1, 0.2, 0.3, 0.4, 0.5. Bars appear for each year from 2000 through 2019. The bar heights are around 0.45 to 0.46 from 2000 to about 2002, then around 0.43 to 0.44 from about 2003 to 2006, then around 0.40 to 0.41 from about 2007 to 2008, then around 0.37 to 0.38 from about 2009 to 2011, then around 0.34 to 0.37 from about 2012 to 2013, then around 0.30 from about 2014 to 2016, then around 0.27 to 0.28 from about 2017 to 2018 and about 0.26 in 2019.
This places our study in a context where the job functions of women in civil service have been changing dramatically, but where there has not been an equal trend towards more management positions for women.
6. Results
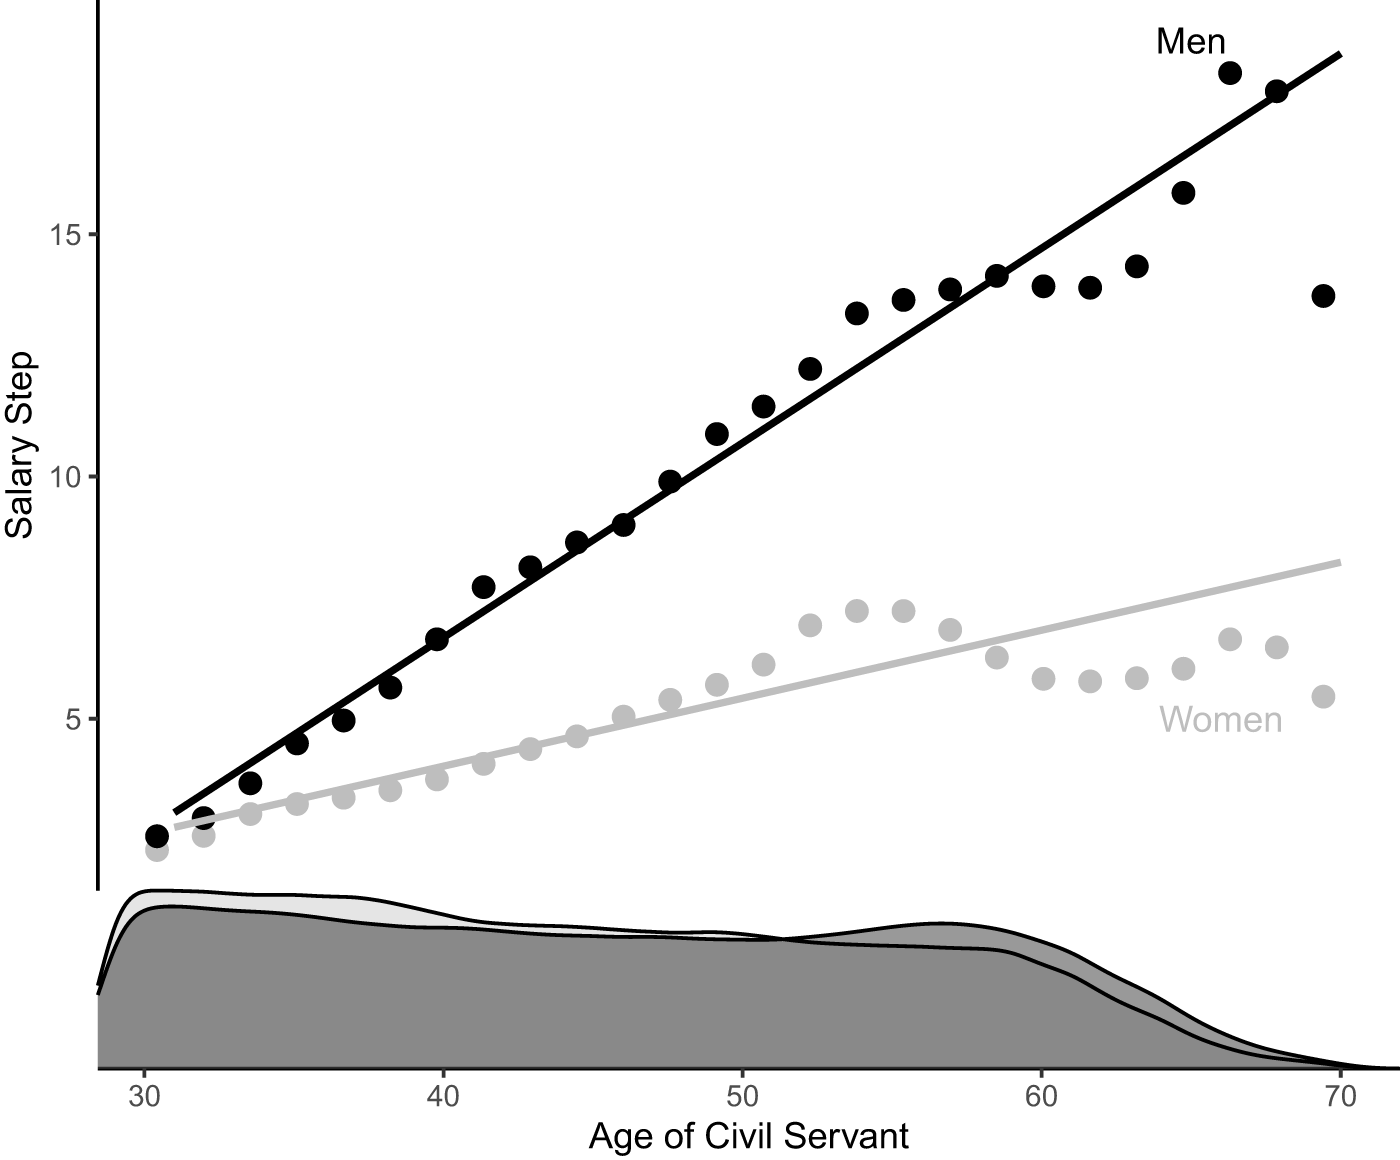
We start by presenting descriptive evidence on the gender gap in career advancement. As we saw in Table 3, the overall gap in salary steps is four. Figure 4 shows that a large part of this can be explained by men progressing significantly faster than women. As can be seen from the black trend line, on average, men progress approximately 0.4 salary steps per year. However, as is visible from the gray trend line, women tend to progress much more slowly with seniority. This is likely driven by two factors: women tend to work in positions where progression happens more slowly, and they are promoted at a slower pace than men. These two factors are likely to be the main driver of the gender gap of four in salary steps, which we saw in Table 3.
Binned scatterplot of relation between age and salary steps in the Danish civil service.

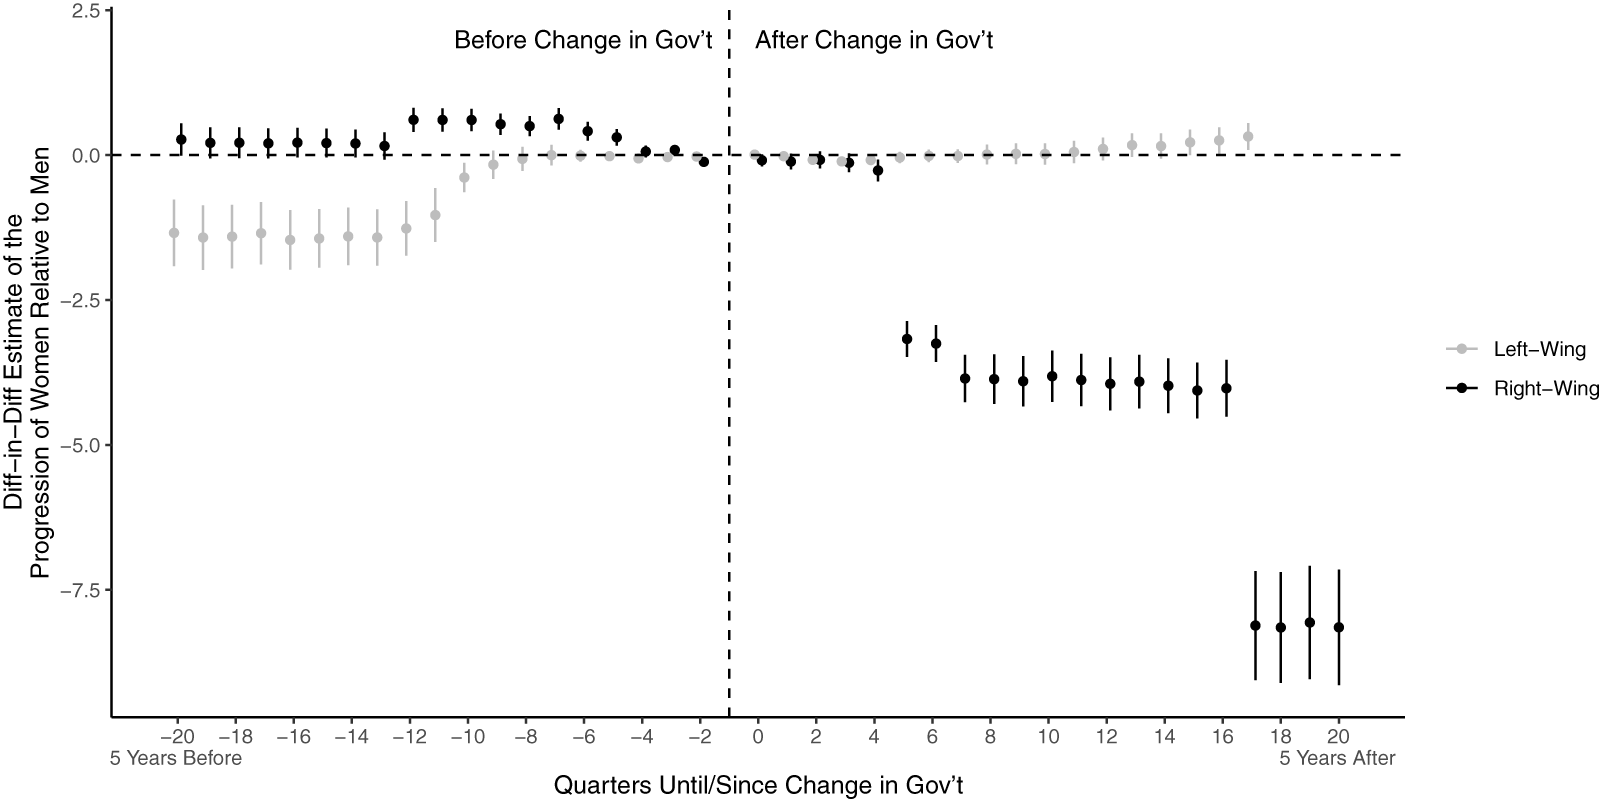
Next, we want to examine how much of this is driven by ideologically induced gender differences in promotions. To do so, we present a number of difference-in-differences estimates. Figure 5 shows estimates from an event study using the Sun and Abraham (Reference Sun and Abraham2021) technique. We consider the relative time until a new government takes office and split between left- and right-wing governments. Note that the y-axis expresses the difference in progression between women and men, which means that estimates close to 0 indicate that women and men bureaucrats’ careers progress at the same pace. Thus, estimates deviating from 0 indicate gender differences in progression.
Estimates depending on time since the change in government ideology.

Figure 5 Long description
Before Change in Govt After Change in Govt. The scatter plot has two series with vertical error bars and a legend listing, Left Wing and Right Wing. A vertical dashed line marks quarter 0. A horizontal dashed line marks 0 on the y scale. The x-axis label is, Quarters Until Since Change in Govt. The x-axis shows ticks from minus 20 to 20 in steps of 2, with the text, 5 Years Before, at the far left and, 5 Years After, at the far right. The y-axis label is, Diff in Diff Estimate of the Progression of Women Relative to Men. The y-axis shows ticks at 2.5, 0.0, minus 2.5, minus 5.0 and minus 7.5. Left Wing series: From minus 20 to about minus 12, points lie below 0, around minus 1.5 with error bars. From about minus 11 to minus 8, points rise toward 0. From about minus 7 to minus 2, points are near 0. From 0 to about 16, points are slightly above 0, around 0.1 to 0.4 with error bars. Right Wing series: From minus 20 to about minus 13, points are slightly above 0, around 0.2 to 0.4. From about minus 12 to minus 6, points are higher, around 0.6 to 0.8. From about minus 5 to 0, points move toward 0. From about 1 to 4, points are near 0. From about 6 to 16, points are around minus 3.2 to minus 4.2 with error bars. From about 17 to 20, points are around minus 8 with error bars.
There is a large negative effect on women’s advancement when right-wing governments come into power. In particular, after a little more than a year of right-wing government, women civil servants experience a drop in their salary step amounting to more than two brackets relative to men. This gap increases over time. On the other hand, there appears to be little impact of left-wing government compared to the pre-existing trend. Next, we remark further on the pre-trends.
The assumption needed for drawing a causal inference (the “identifying” assumption) is that salary steps among women would have evolved parallel to men’s if a right-wing government had not been elected into office. Importantly, the bureaucrat cannot independently manipulate the salary step nor the ideology of the government, which makes it plausible that this assumption holds.
However, this does not deal with all threats. In particular, the fact that women and men have different trends in their salary steps (as we saw in Figure 4) poses the main threat to identification. It is noteworthy that the pre-trends in the specification with right-wing governments in Figure 5 are mostly not statistically significant. However, some are significant, and there does appear to be a trend in the point estimates. This could present a threat to causal identification. In Appendix A, we use the tools developed by Rambachan and Roth (Reference Rambachan and Roth2019) and conduct a sensitivity analysis showing that our results cannot be explained by the approximately linear pre-trend we observe in Figure 5. This makes sense, as the sudden drop in women’s advancement in the post-treatment period is so large that it is difficult to explain away with reference to the observed pre-trend. We go into further detail and conduct additional sensitivity analyses in Appendix A. In Appendix B, we directly model the linear trend in bureaucrat age. Overall, the difference-in-differences estimates are highly robust to the possible presence of differential pre-trends.
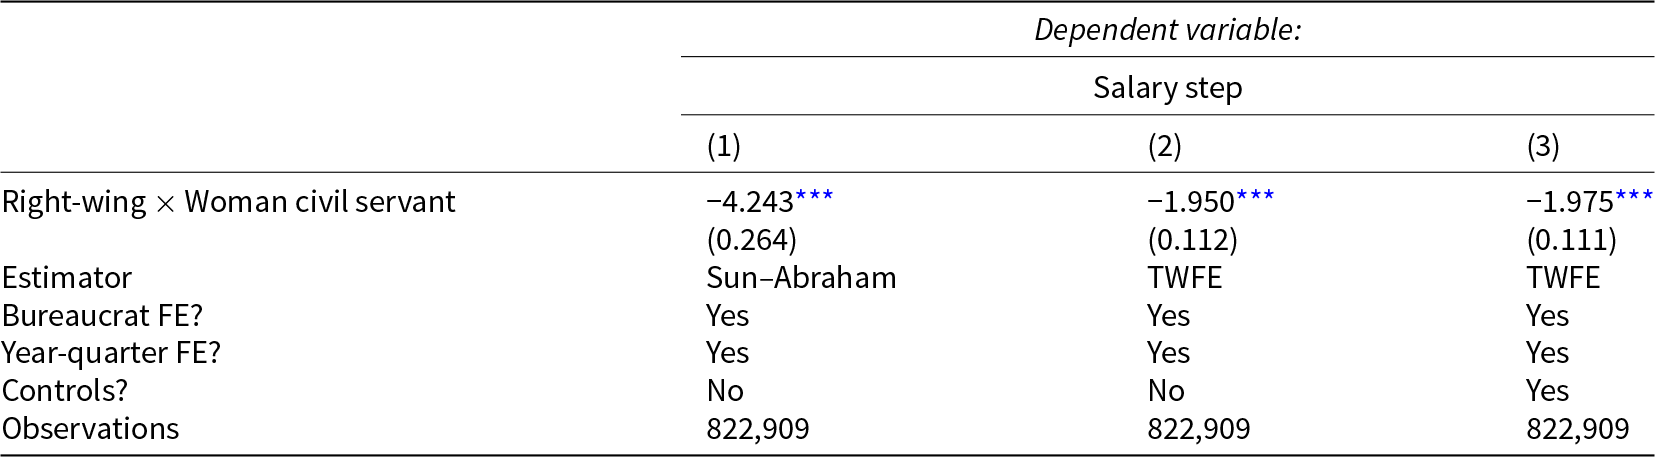
Table 4 shows the difference-in-differences estimates aggregated over the full period with a right-wing government. In the first column, we show the results from a bivariate Sun and Abraham (Reference Sun and Abraham2021) difference-in-differences regression. The results suggest that the entry of a right-wing government leads to women losing more than four salary steps, relative to men, over the course of their careers. To understand the implications of these findings, it is useful to benchmark against the general progression of men in the civil service, which is approximately 0.4 salary steps per year. This indicates that because these women were part of the civil service when a right-wing government came into power, they lost the equivalent of 10 years of career progression relative to men over what remained of their career.
Center-right government and the career progression of women in the civil service

Table 4 Long description
Dependent variable is Salary Step, reported for three models labeled (1), (2), and (3). The coefficient for Right Wing times Woman Civil Servant is minus 4.243 with three asterisks in model (1), minus 1.950 with three asterisks in model (2), and minus 1.975 with three asterisks in model (3). The standard errors shown beneath that row are 0.264 for model (1), 0.112 for model (2), and 0.111 for model (3). The estimator is Sun Abraham in model (1) and TWFE in models (2) and (3). Bureaucrat fixed effects are Yes in all three models, and Year Quarter fixed effects are Yes in all three models. Controls are No in models (1) and (2) and Yes in model (3). Observations are 822,909 in each model.
Notes: Robust standard errors with bureaucrat clustering in parentheses.  $^{*}p \lt $0.1;
 $^{**}p \lt $0.05;
 $^{***}p \lt $0.01.
In columns 2 and 3 we reproduce the substantive findings using two-way fixed effects. Importantly, column 3 includes controls for the bureaucrat’s age and her time spent working in the central government—included with first- and second-order polynomials to account for non-linear effects. The fact that we can reproduce the findings using fixed effects instead of the Sun–Abraham estimator is important, because we cannot incorporate interactions in the latter statistical model, which is needed to investigate the mechanisms in the following section.
7. Further evidence
In the following, we provide some further evidence for our argument. First, we show that the stagnation in women’s careers comes about because of gendered promotion patterns. Second, we show that the effects are particularly pronounced for managerial positions—including positions where multiple ministers are formally involved in the appointment.
7.1. The effect is concentrated among management positions
Next, we examine how government ideology shapes women’s career progression at different stages of their careers. To do so, we first examine the ascension of women into management positions. Second, we examine at which salary level the stagnation kicks in.
Investigating the effect on various types of management positions adds two nuances. First, promotions or appointments into these positions happen at management’s discretion. Second, for management positions—particularly senior management positions—one or more ministers are likely to become increasingly involved.
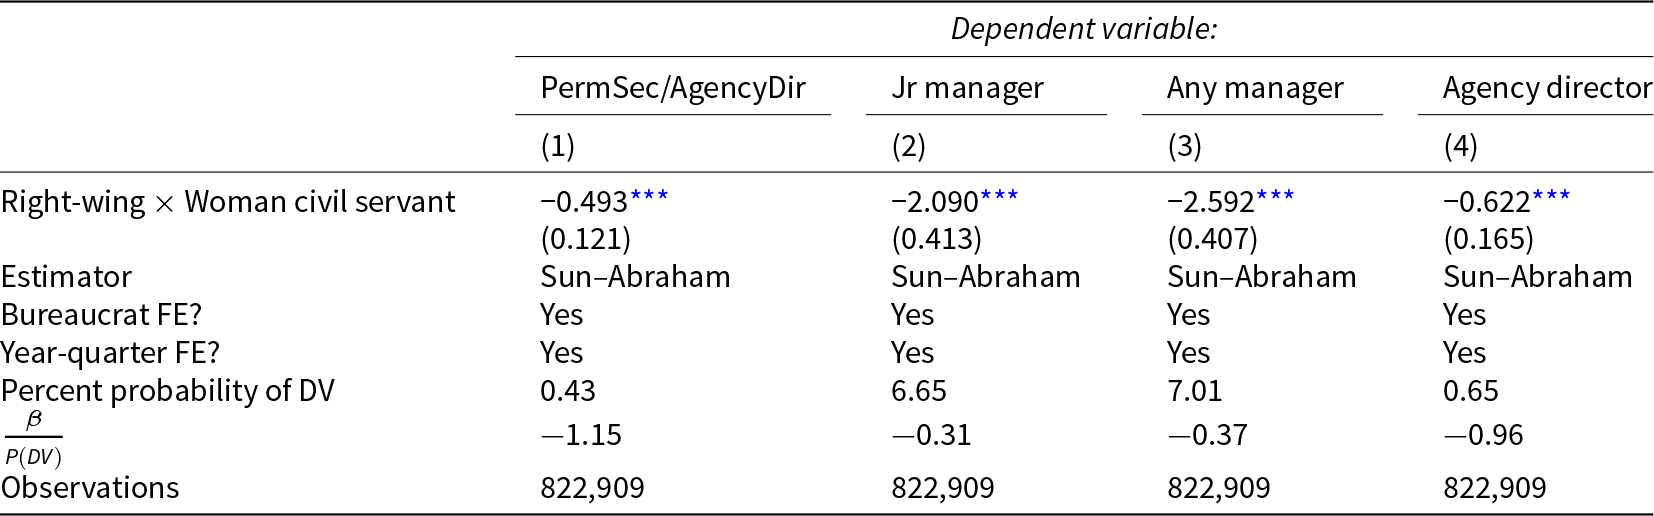
In Table 5, we present the difference-in-differences estimates of the impact of right-wing government on the probability that women become different types of managers. All of the dependent variables are binary but rescaled to show the effect in percentage points. In column 1, we examine the likelihood that women obtain positions as agency directors or permanent secretaries, as these are management positions where (as described in the context section) the political level is directly involved through the government’s board of appointments.Footnote 16 We find that women become less likely to ascend into such positions when a center-right government comes into power. In column 2, we examine management positions below the most senior ones, and in column 3 we estimate the probability of being appointed into any management positions. Finally, in column 4, we focus on agency director positions. Across all these different types of managerial positions, we find that the likelihood that women (compared to men) enter these positions drops when right-wing governments come into power. To help in gauging effect sizes, we present the unconditional probability of each dependent variable taking the value 1. We also present the estimated impact normalized by this baseline probability. Compared to this benchmark, the effects are largest for the most senior appointments (columns 1 and 4), where the political level is most strongly involved. While the effects are not as strong for more junior positions (column 2), they are still very sizable, amounting to almost one-third of the unconditional probability. For those positions, the minister will be involved in the appointment; however, the political salience will be lower.
Center-right government and the probability that women become managers

Table 5 Long description
Four model columns report estimates for dependent variables, PermSec or AgencyDir, Jr Manager, Any Manager, and Agency Director. The row, Right-Wing X Woman Civil S., has coefficients of minus 0.493 with three stars for PermSec or AgencyDir, minus 2.090 with three stars for Jr Manager, minus 2.592 with three stars for Any Manager, and minus 0.622 with three stars for Agency Director. The standard errors shown in parentheses are 0.121, 0.413, 0.407, and 0.165, respectively. Estimator is Sun-Abraham in all four columns. Bureaucrat fixed effects are Yes in all four columns, and Year-Quarter fixed effects are Yes in all four columns. Percent Probability of DV is 0.43 for PermSec or AgencyDir, 6.65 for Jr Manager, 7.01 for Any Manager, and 0.65 for Agency Director. The row labeled beta over P of DV reports minus 1.15, minus 0.31, minus 0.37, and minus 0.96 across columns 1 through 4. Observations are 822,909 in each column.
Notes: Dependent variables are rescaled so the estimates can be interpreted in percentage points. Robust standard errors with bureaucrat clustering in parentheses.  $^{*}p \lt $0.1;
 $^{**}p \lt $0.05;
 $^{***}p \lt $0.01.
Next, we examine at which stage the stagnation in salary levels is strongest. To do so, we use the Callaway and Li (Reference Callaway and Li2019) quantile difference-in-differences estimator. This allows us to investigate heterogeneous effects across the distribution of salary steps and thereby examine where in the bureaucratic hierarchy the glass ceiling kicks in against women. Recall from Table 1 that the first job with minor management duties—chief consultant—is located around salary step eight. The results are shown in Figure 6 and indicate that there is little to no effect for entry-level positions. Instead, the effect is strongest concentrated for junior and mid-level management promotions, where the civil servant is typically promoted by a senior unit leader. These findings accord well with the results in Table 5: there are strong effects at the levels in which it is possible to be promoted into more senior positions. However, the effect disappears when there is no further progression potential. Additionally, it shows very clearly that the government ideology “glass ceiling” effect kicks in already at the first junior management position.
Estimates across the distribution of salary steps.

Figure 6 Long description
A line graph with the vertical axis label, Quantile Difference in Differences. The horizontal axis label, Percentile on Pre Treatment Salary Step. The horizontal axis shows tick labels 0.00, 0.25, 0.50, 0.75, 1.00. The vertical axis shows tick labels 0 and minus 10. A dotted horizontal reference line is drawn at 0. A single line with circular markers runs near 0 from the left side through about the 0.40 mark on the horizontal axis. After that, the line moves below 0 and continues downward with small fluctuations. Around the middle of the plot there is a sharp upward spike followed by a drop. From about 0.70 to about 0.85 on the horizontal axis, the line declines to its lowest region, below the minus 10 tick, with several closely spaced points. Several points in this low region are labeled 8, 9, 11, 17, 18, 19, 20, 21 and 26. After this trough, the line rises steeply toward the right edge. Points on the rising segment are labeled 29, 33, 40, 47, 49, 50, 56, 51 and 55. Near the far right, the line reaches the 0 reference line and ends slightly above it. A shaded band surrounds the line across much of the plot, with the widest vertical spread around the central spike and in the low region near the trough.
As an additional test, in Appendix C, we examine the entire universe of central government employees, and show that the effect is present everywhere, but most marked in the central ministerial bureaucracy, which we study in our main specifications.
7.2. Do women ministers suppress gendered promotion patterns?
As our final mechanism analysis, we examine whether the effect can be ascribed to the gender of the minister responsible for the civil servant’s unit. In particular, we could expect the findings to be driven by the minister’s personal experiences with gender discrimination, in which case women ministers of all ideological leanings should suppress gendered promotion patterns in their part of the bureaucracy.Footnote 17
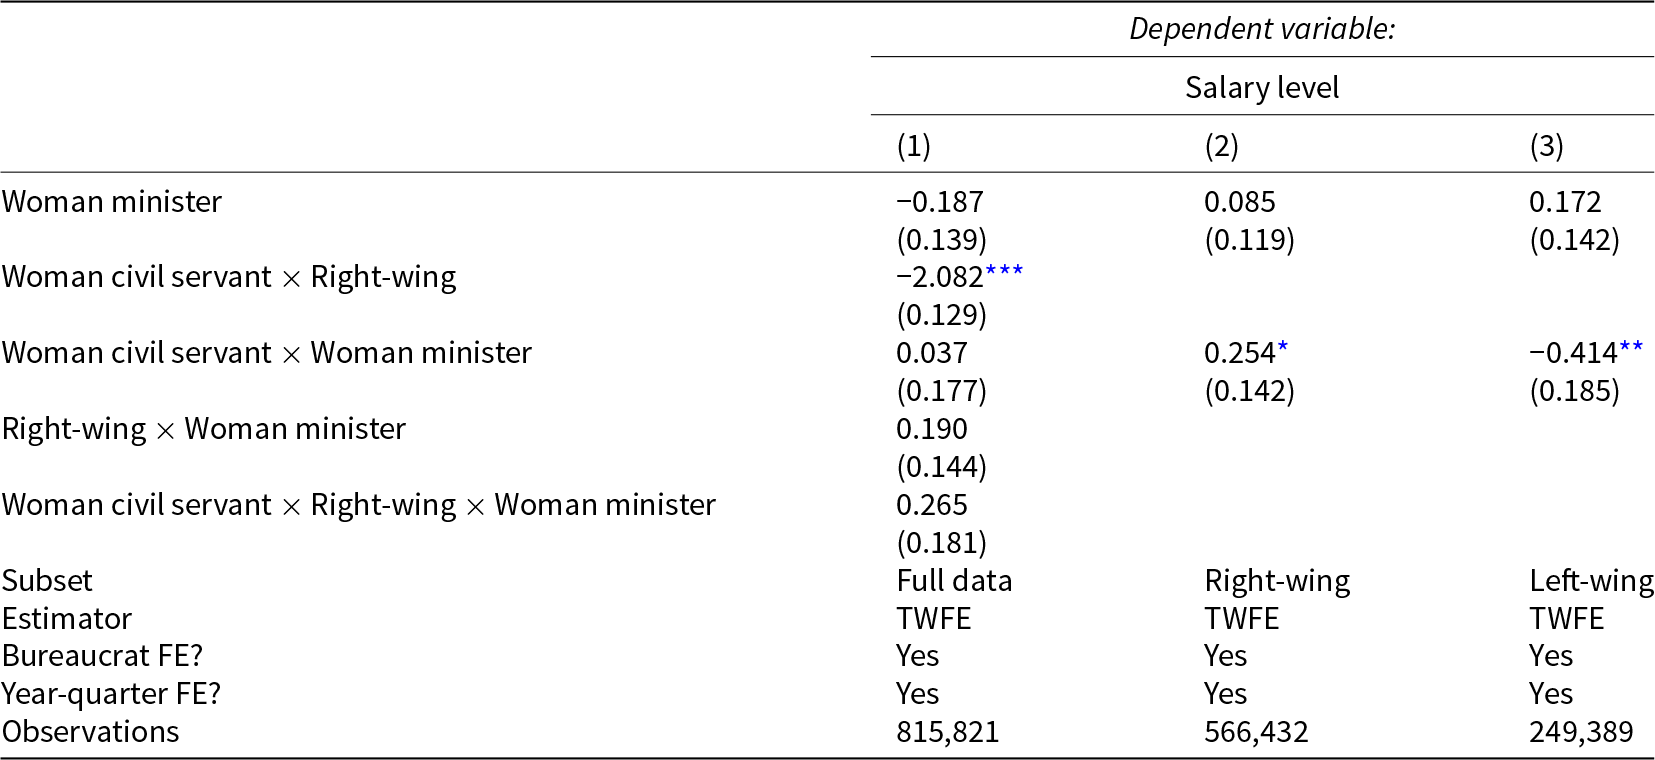
To test this, in Table 6, we include a three-way interaction between (a) the gender of the civil servant, (b) whether it is a center-right government, and (c) the gender of the minister under which the civil servant works. In column 1, we include all data and all terms in the three-way interaction, and in columns 2 and 3, respectively, we subset to spells of right-wing and left-wing government.
Do female ministers suppress gendered promotions?

Table 6 Long description
Dependent variable is Salary Level, reported for three models labeled columns 1 to 3. Column 1 uses the subset, Full Data, and reports Woman Minister minus 0.187 with standard error 0.139; Woman Civil Servant with Right Wing minus 2.082 with three stars and standard error 0.129; Woman Civil Servant with Woman Minister 0.037 with standard error 0.177; Right Wing with Woman Minister 0.190 with standard error 0.144; and the three way interaction Woman Civil Servant with Right Wing with Woman Minister 0.265 with standard error 0.181. Column 2 uses the subset, Right Wing, and reports Woman Minister 0.085 with standard error 0.119 and Woman Civil Servant with Woman Minister 0.254 with one star and standard error 0.142. Column 3 uses the subset, Left Wing, and reports Woman Minister 0.172 with standard error 0.142 and Woman Civil Servant with Woman Minister minus 0.414 with two stars and standard error 0.185. Estimator is TWFE in all three columns, with Bureaucrat fixed effects marked Yes and Year Quarter fixed effects marked Yes. Observations are 815,821 in column 1, 566,432 in column 2, and 249,389 in column 3.
Note: Robust standard errors with bureaucrat clustering in parentheses.  $^{*}p \lt $0.1;
 $^{**}p \lt $0.05;
 $^{***}p \lt $0.01.
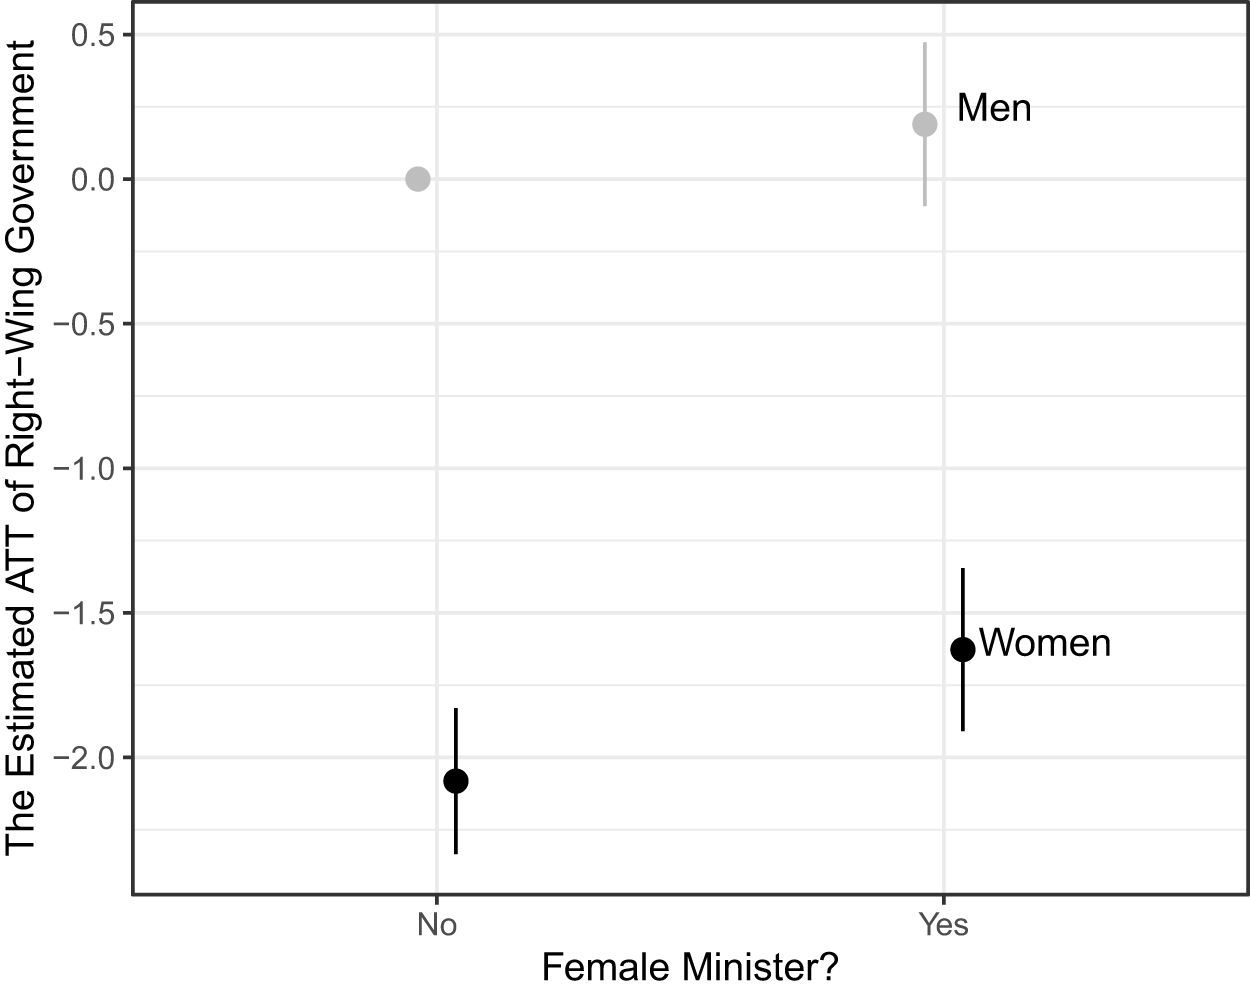
These results show that our finding regarding government ideology cannot be fully ascribed to the gender of the minister, or to the different prevalence of women ministers in left- and right-wing governments. For that to be the case, women ministers should suppress the gendered promotion patterns under right-wing governments. While there is an indication that the negative effect of right-wing government on women’s careers is weaker under women ministers, the overall negative effect remains, and the interaction is not particularly strong nor statistically significant. Figure 7 further illustrates this by showing the marginal effect of a right-wing government conditional on the gender of the minister and the gender of the civil servant. As we can see, the impact among women dwarfs any potential moderating effect of the minister’s gender there might be. This shows that the gender of the minister cannot explain our findings.
Visualizing the interaction effect.

Interestingly, however, in column 2 we show that the appointment of women ministers (instead of men) under center-right government has a small positive effect on the careers of women civil servants. On the other hand, there is a negative effect under a center-left government. In Appendix G, we explore this pattern in more detail and show that the effect is in fact driven by differences in the type of ministry to which women ministers are appointed. Women ministers—especially under center-right governments—are more likely to head “caring” ministries, where women civil servants tend to be promoted more quickly. Once we account for this by excluding caring ministries from the analysis, the positive effect of women ministers disappears. This suggests that it is not necessarily the gender of the minister that drives the effect, but rather the characteristics of the ministries in which they serve. While investigating this dynamic in full is outside the purview of this study, the results highlight how patterns of ministerial appointments intersect with gendered career trajectories in the bureaucracy.
In Appendix D, we present an additional result to shed further light on the mechanism. We investigate whether right-wing governments disadvantage women working in man-dominated units. The results show that women are disadvantaged by right-wing government no matter whether they work in man- or women-dominated units. However, the effect is strongest in units with an overweight of men. Conversely, in units with more women, the difference between right- and left-wing government takeover is smaller but still present.
7.3. Alternative explanations
In Appendix E, we examine and reject a number of alternative explanations for the results above.
First, it is possible that our findings could be explained by right-wing governments prioritizing different policy areas. Since men and women tend to work in different policy areas, this could lead to men progressing faster under right-wing government, because they find the policy area more important. In the appendix, we investigate this by examining whether right-wing governments tend to close down, promote from, or decrease the size of units with more women. We find no support for the notion that ideological policy priorities drive our results. An alternative way this could happen, which has seen less discussion, is that right-wing governments open up more new units, and those units have more women. This is more difficult to examine using our difference-in-differences approach, because there will not exist any pre-treatment data on the unit. Still, we examine it in a cross-sectional setting in Appendix E. While we find that right-wing governments do tend to open up more units with a majority of women among the rank-and-file, the probability is less than one percentage point higher than for left-wing governments. Thus, the association is not strong enough to drive our results.
Second, it is possible that women simply select out of the civil service when a right-wing government comes into power. We also examine this in the appendix, and find that it is not the case.
8. Conclusion
In this article, we have explored the effect of government ideology on the career progression of women civil servants. Using quarterly individual-level data for the full universe of Danish central government employees from 1998 to 2019, we find that women civil servants have worse career progression under right-wing governments. Further investigations show that the effect is concentrated in the upper half of the civil service, and that it is particularly important for management positions. The effect is not driven by men ministers, although the appointment of a woman minister in right-wing governments has a small positive effect on women’s careers. However, the effect is so small that it barely improves the gender gap in career progression. Additionally, it seems like the positive effect of women ministers is driven by right-wing governments appointing women as ministers for “caring” ministries, where women—for unrelated reasons—progress more quickly.
The effect of gendered promotion patterns on the career progression of women bureaucrats provides a perspective and explanation for the paradoxical situation that women constitute the majority of employees in many modern public bureaucracies but still are at a disadvantage with regard to career progression. This is an important contribution to the literature on representative bureaucracy (Riccucci and Van Ryzin, Reference Riccucci and Van Ryzin2017; Meier, Reference Meier2019). However, the fact that this career disadvantage seems to be absent under left-wing governments suggests that prioritization of and attentiveness to gender equality could help to overcome gendered promotion patterns and may produce non-trivial results with regard to improving the career progression of women in the civil service. Apparently, the “glass ceiling” can be broken if attention is brought to it. This has potentially important implications for gender equality policies for public organizations at all levels.
More generally, the results also show how government ideology plays a substantial role in the makeup of the public bureaucracy, including gender equality among top non-elected policymakers, even in systems without political appointments.
How generalizable are these results? Given the strong meritocratic norms of the Danish civil service and the generally high level of women’s empowerment in Denmark, we consider this setting a least likely case for government ideology to drive gendered inequalities in career progression. Consequently, the barriers we identify for women civil servants may represent a lower bound compared to other political systems with more politicized bureaucracies, where government ideology plays a more pronounced role in hiring and promotion decisions. Future research could explore gendered promotion patterns in other bureaucratic contexts, including sub-national levels, where direct political appointments are more prevalent.
Moreover, the effects of government ideology identified in this study may be even stronger in political systems marked by higher polarization between left- and right-wing parties on gender equality issues. Conversely, our results might also suggest that ideology-driven effects on women civil servants’ careers could diminish as polarization around gender equality decreases. Additionally, we would expect stronger ideology effects in societies with lower levels of gender equality. Future research could investigate these dynamics further, as well as examine other partisan or institutional factors that shape gender (in)equality in the civil service.
Data availability statement
In this article, we rely on restricted payroll data on all civil servants employed in the Danish central ministerial bureaucracy. Because we have obtained this data through a special agreement with the ministry responsible for maintaining the payroll data, and this data is highly sensitive, we will not be able to share replication data, should the paper be accepted for publication. However, we very much agree that reproducibility is extremely important, and we want to be as transparent as possible in our work. In other cases, we have shared a log file using RMarkdown that shows reproducibility by loading the data, executing all code, and producing the results. This can be uploaded to a Dataverse repository.
Declaration of interests
The author(s) declare none.
Funding Statement
The authors received no external funding to conduct this research.
Supplementary material
The supplementary material for this article can be found at https://doi.org/10.1017/psrm.2026.10129.




 Open access

