INTRODUCTION
Senescence in plants is an internally programmed degeneration process leading to death. It is controlled by genetic and external environmental factors (Pierce et al. Reference Pierce, Knowles and Phillips1984; Walulu et al. Reference Walulu, Rosenow, Wester and Nguyen1994). Environmental factors, such as drought and high temperature, can induce the early onset of senescence, cause early loss of photosynthetic capacity in the life-cycle of the plant and result in premature senescence (Buchanan-Wollaston Reference Buchanan-Wollaston1997; Noodén et al. Reference Noodén, Guiamét and John1997; Chandlee Reference Chandlee2001).
In cereal species, studies on senescence have focused on the flag leaf, which was proved to be the main source of assimilates for grain filling (Wardlaw Reference Wardlaw2002). The rate of flag leaf senescence was generally found to correlate negatively with grain yield in rice (Alejar et al. Reference Alejar, Park, Vergara, Visperas and Mathis1995), sorghum (Borrell & Douglas Reference Boŕrell, Douglas, Foale, Henzell and Kniepp1996) and maize (Bänziger et al. Reference Bänziger, Edmeades and Lafitte1999). The delayed onset of senescence was also found to be a key component for increasing yield in sorghum (Borrell et al. Reference Borrell, Hammer and Douglas2000a , Reference Borrell, Hammer and Henzell b ), maize (Bänziger et al. Reference Bänziger, Edmeades and Lafitte1999) and durum wheat (Benbella & Paulsen Reference Benbella and Paulsen1998; Hafsi et al. Reference Hafsi, Mechmeche, Bouamama, Djekoune, Zaharieva and Monneveux2000). In common wheat, flag leaf photosynthesis contributes approximately 0·30–0·50 of the assimilates for grain filling (Sylvester-Bradley et al. Reference Sylvester-Bradley, Scott and Wright1990). Therefore, the onset and rate of senescence may be important factors that influence wheat yield potential particularly under stress conditions (Evans Reference Evans1993; Thomas & Howarth Reference Thomas and Howarth2000).
The term ‘stay-green’ refers to delayed senescence during the post-anthesis stages of plant development (Thomas & Howarth Reference Thomas and Howarth2000). It may be due to either the delayed onset of senescence or a slower rate of senescence (Thomas & Smart Reference Thomas and Smart1993). Most studies across plant species indicate that stay-green is a quantitative trait. To date, genetic mapping of the quantitative trait locus (QTL) conferring stay-green has been undertaken in a number of plant species. Thomas et al. (Reference Thomas, Evans, Thomas, Humphreys, Morgan, Hauck and Donnison1997) mapped a single recessive nuclear allele sid for stay-green in Festulolium pratensis. In Arabidopsis, a recessive gene fiw, which exhibited premature cessation of inflorescence growth and early leaf senescence, was mapped to chromosome 4 (Nakamura et al. Reference Nakamura, Mochizuki and Nagatani2000). Xu et al. (Reference Xu, Subudhi, Crasta, Rosenow, Mullet and Nguyen2000) detected three stay-green QTL regions (stg1, stg2 and stg3) in a population of a recombinant inbred line of sorghum using a restriction fragment length polymorphism (RFLP) map. In rice, Cha et al. (Reference Cha, Lee, Koh, Lee, Nam and Paek2002) mapped a recessive mutant gene sgr(t) for stay-green on chromosome 9 between RFLP markers RG662 and C985.
In wheat, one QTL for the percentage of flag leaf area remaining green at 14 days after anthesis (DAA) was detected on chromosome 2B under irrigated conditions, but others for this trait and for the percentage of flag leaf area remaining green at 35 DAA were located on chromosome 2D under non-irrigated conditions (Verma et al. Reference Verma, Foulkes, Worland, Sylvester-Bradley, Caligari and Snape2004). Three QTLs for the green leaf area were identified on chromosomes 1AS, 3BS and 7DS using a population of Chirya/Sonalika recombinant inbred lines (RILs) (Kumar et al. Reference Kumar, Joshi, Kumari, Paliwal, Kumar and Röder2010). Using a population of RILs from a cross between winter wheat cultivars ‘Ventnor’ and ‘Karl 92’, Vijayalakshmi et al. (Reference Vijayalakshmi, Fritz, Paulsen, Bai, Pandravada and Gill2010) found 16 QTLs for traits related to wheat leaf senescence under optimal temperature and heat stress conditions. However, there has been no report of mapping QTL that control the onset and the rate of senescence of the wheat flag leaf in response to drought stress. The present study was carried out to detect QTLs for the above-mentioned traits using a doubled haploid (DH) population. The objectives were (1) to characterize the senescence-related traits in response to drought stress and (2) to identify QTL for traits related to the progression of wheat flag leaf senescence under well-watered and drought-stress environments using a DH population derived from two winter wheat varieties, Hanxuan10 and Lumai14.
MATERIALS AND METHODS
Plant materials
A Hanxuan 10 (H10)/Lumai 14 (L14) DH population, comprised of 150 lines (L1–L150), was constructed at the Institute of Crop Science, CAAS, Beijing (Jing et al. Reference Jing, Chang, Jia and Hu1999; Hao et al. Reference Hao, Chang, Guo, Jing, Li and Jia2003; Zhou et al. Reference Zhou, Jing, Hao, Chang and Zhang2005). Developed by the Shanxi Academy of Agricultural Sciences in 1966, H10 is a drought-tolerant cultivar and is still grown in arid and barren areas. In contrast, L14 is a high-yielding cultivar adapted to abundant water and fertile conditions, from Yantai Institute of Agricultural Sciences, Shandong, China, and was widely grown during the 1990s in northern China. The two parents and L1–L150 were grown at the Shanxi Agricultural University experimental farm (37°25′N, 112°35′E, 799·6 m a.s.l.) during 2011/12. The experimental field was divided into two parts for different water treatments. The field design of each part consisted of randomized complete blocks with three replications. Each plot consisted of two rows, 2 m long with 0·25 m between rows. Forty seeds were sown in each row. One water regime was rainfed and used as the drought stress environment with a total of 198·7 mm rainfall during the growing season; the other was well watered with 650 mm of water applied at Zadoks growth stages (GS) 23, 25, 32, 65 and 75, respectively (Zadoks et al. Reference Zadoks, Chang and Konzak1974).
Phenotypic evaluation
Ten flowering plants of each line and parents were tagged. Green leaf area duration (GLAD) was estimated visually and recorded at 3-day intervals from 10 DAA to physiological maturity using a 0–9 scale, where 0 was complete senescence and 9 was green over the whole leaf area, (Joshi et al. Reference Joshi, Kumari, Singh, Reddy, Kumar, Rane and Chand2007). Based on the GLAD data, a non-linear regression curve (Gompertz statistical model) (Seber & Wild Reference Seber and Wild1989) GLAD = Ke−be−at was used to estimate parameters related to progression of senescence, including (i) 75% green (75%G) which refers to the time interval from 100% green leaf area to 75% green leaf area, or the time to reach 25% senescence, (ii) 25% green (25%G): the time to reach 75% senescence, (iii) 50% green (50%G): the time interval between 75%G and 25%G, (iv) maximum rate of senescence (MRS); (v) time to maximum rate of senescence (TMRS); (vi) percentage of green leaf area at maximum senescence (PGMS); (vii) onset time of leaf senescence (Ts); and (vii) end time of leaf senescence (To).
Data analysis
Analyses of variance (ANOVA) of the data were conducted by the SPSS v.19.0 statistical package to assess the variances among DH lines (DHLs) and to calculate the mean, variance, standard deviation, coefficient of variation (CV), kurtosis and skewness for traits related to progression of senescence.
Genotyping was performed at the Institute of Crop Science, Chinese Academy of Agricultural Sciences (ICS, CAAS) in Beijing, and the corresponding genetic linkage maps of H10/L14 were constructed by Dr. Ruilian Jing's lab at ICS, CAAS using the software MAPMAKER/Exp 3.0 (Hao et al. Reference Hao, Chang, Guo, Jing, Li and Jia2003; Zhou et al. Reference Zhou, Jing, Hao, Chang and Zhang2005). The map contained 395 marker loci including 132 AFLP, 112 Xgwm (Röder et al. Reference Röder, Korzun, Wendehake, Plaschke, Tixier, Leroy and Ganal1998), 97 WMC (International Wheat Microsatellite Consortium), 9 Xgdm (Pestsova et al. Reference Pestsova, Ganal and Röder2000), 6 Xpsp (developed by the John Innes Centre, UK), 33 CWM and 6 EST loci (developed by ICS, CAAS). The map covered 3904 centimorgans (cM) with an average distance of 9·9 cM between adjacent markers. The 395 loci, distributed on 30 linkage groups, belong to 21 chromosomes with 161, 177 and 57 loci on chromosomes of the A, B and D genomes, respectively.
The QTLs for traits related to progression of senescence in response to the two water regimes were detected using QTL Mapper version 2.0 (Wang et al. Reference Wang, Zhu, Li and Paterson1999), set for composite interval mapping of a mixed linear model. The threshold logarithm of the odds (LOD) score to declare the presence of a QTL was 2·50. The QTLs were named according to the rule of ‘QTL + trait + chromosome + gene number’.
RESULTS
Analysis of variance for traits related to the progression of senescence
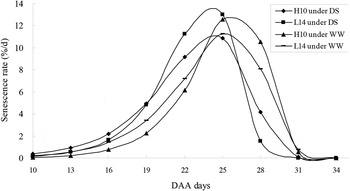
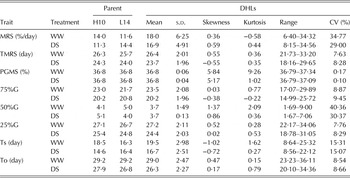
Under well-watered conditions, the onset of senescence for H10 was 2·19 days later than for L14: H10 only took half a day more to reach MRS than L14 did, but showed a 2·39% higher rate of senescence than L14 at the point of MRS. As a result, both parents exhibited the same PGMS (Table 1). During the whole grain-filling period, senescence of the flag leaf in H10 showed a dynamic pattern, with a slower rate of senescence from flowering date to 24 DAA, faster during 25 to 29 DAA, then slower again at 30 DAA (Fig. 1) when compared with L14. The senescence of both varieties ended on the same day.
The variation trend of flag leaf senescence rate for the parents of DHLs under two water regimes. DS, drought stress; WW, well watered; DAA, days after anthesis.

Characteristics of traits related to progression of senescence of DHLs and their parents under two water regimes

WW, well watered; DS, drought stress.
Under drought stress, the onset of senescence of H10 was 1·75 days earlier than that of L14, and showed a 3·08% lower rate of senescence than L14 at the point of MRS. Even though both varieties reached MRS on almost the same day, senescence in H10 ended 1·06 days later than L14 (Table 1). Compared with L14, flag leaf senescence in H10 was slightly faster from flowering date to 19 DAA, then slower from 20 to 26 DAA and much faster after 26 DAA (Table 1, Fig. 1). Therefore, water conditions had different effects on flag leaf senescence at different development stages of the two parents.
The averages of traits related to progression of senescence in DHLs under drought stress were smaller than those under well-watered conditions. Except for MRS, PGMS and 50%G, differences in the averages of other traits under two water conditions were significant (P < 0·01), suggesting a strong effect of drought stress on wheat leaf senescence. There was segregation for all given traits in the DH population with the CV ranging from 0·1 to 48·0% under the two water conditions. With the exception of PGMS, the CV of all given traits were high and their ranges of variation were also wide. The DHLs showed continuous transgressive segregation and a normal distribution for all traits.
Categorization of senescence in doubled haploid lines
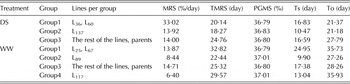
Based on the averages of MRS, TMRS, PGMS, Ts and To, the DHLs can be divided into three groups under drought stress and four groups under well-watered conditions. The average trait values for each group of DHLs and their parents are listed in Table 2. Under the two water conditions, Group 1 showed delayed onset and end of senescence, but with high MRS, while Group 2 showed the opposite. The lines L36 and L60 under drought stress and L25 and L67 in the well-watered treatment were categorized into Group 1, while L137 under drought stress and L89 under well-watered conditions were classified into Group 2, suggesting these lines have different responses under different water conditions. Most of the lines and parents were included in Group 3, with senescence characteristics between Group 1 and Group 2. Under well-watered conditions, Group 4, L117, took 29·57 days to reach MRS and the rate of senescence at the point of MRS was 6·4%/day. Thus the end of senescence for L117 was the latest among all the lines tested.
Grouping of DHLs and parents based on the five calculated traits for senescence under two water regimes

WW, well watered; DS, drought stress; MRS, maximum rate of senescence; TMRS, time to maximum rate of senescence; PGMS, percentage of green leaf area at maximum senescence; Ts, onset time of leaf senescence; To, end time of leaf senescence.
The values presented are the averages of all the lines in the group.
Correlation among traits related to progression of senescence
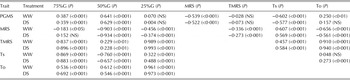
Significant correlations (P < 0·05) were observed between 75%G, 50%G, 25%G and PGMS, TMRS, Ts, To, with the exception of poor correlations between 25%G and PGMS and between 50%G and To under well-watered conditions. The MRS showed significant negative correlations (P < 0·05) with all other traits, except for 75%G under drought stress, and a significant positive correlation (P < 0·001) with Ts (Table 3). Significant positive correlations (P < 0·001) were also found between Ts, To and TMRS, while significant negative correlations (P < 0·001) were observed for PGMS and Ts.
Correlation between the senescence parameters of DHLs under two water regimes

PGMS, percentage of green leaf area at maximum senescence; MRS, maximum rate of senescence; TMRS, time to maximum rate of senescence; Ts, onset time of leaf senescence; To, end time of leaf senescence, WW, well watered; DS, drought stress; 75%G, time interval from 100% green leaf area to 75% green leaf area (i.e. 25% senescence); 50%G, the time interval between 75%G and 25%G; 25%G, the time to reach 75% senescence.
Quantitative trait loci for traits related to the progression of senescence
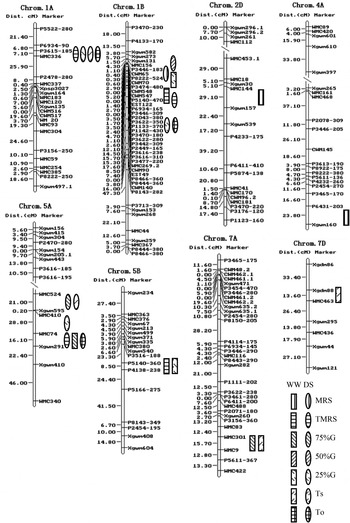
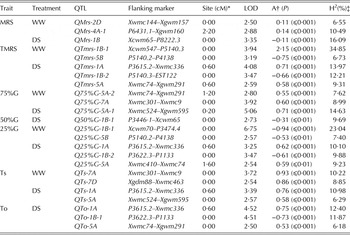
A total of 24 additive QTLs for traits related to the progression of senescence were detected including 14 under drought stress and 10 under well-watered conditions. These QTLs were located on different regions of chromosomes 1A, 4A, 5A, 7A, 1B, 5B, 2D and 7D, with phenotypic variation ranging from 6·18 to 34·85% and LOD score from 2·50 to 6·75. Four QTLs under drought stress were mapped on chromosome 1A at marker interval of P3615.2-Xwmc336, including QTmrs-1A, Q25%G-1A, QTs-1A and QTo-1A. Q75%G-5A-1 and QTs-5A detected under drought stress were co-localized with markers Xwmc524 and Xwmc595. Another four QTLs were linked with marker Xwmc74, including QTmrs-5A, Q25%G-5A and QTo-5A detected under drought stress and Q75%G-5A-2 detected under well-watered conditions. QTmrs-1B-1 mapped under well-watered conditions and QTmrs-1B-2 mapped under drought stress were linked with P5140.3. Favourable alleles of these 12 QTLs were from H10. In addition, QMrs-1B and Q50%G-1B-1 detected under drought stress were linked with Xcwm65. QTmrs-5B and Q25%G-5B under well-watered conditions were co-located on chromosome 5B at the marker interval between P5140.2 and P4138. Q25%G-1B-2 and QTo-1B-1 were mapped under drought stress on chromosome 1B at the marker interval between P3622.3 and P1133. Favourable alleles of these six QTLs were from L14 (Table 4, Fig. 2).
The distribution of QTLs for traits related to the progression of wheat flag leaf senescence on genetic linkage groups constructed on the DH population (produced from the Hanxuan 10 × Lumai 14 cross).

Characteristics of additive QTL for traits related to progression of senescence detected in DH population (produced from the Hanxuan 10 × Lumai 14 cross)

QTL, quantitative trait loci; MRS, maximum rate of senescence; TMRS, time to maximum rate of senescence; 75%G, time interval from 100% green leaf area to 75% green leaf area (i.e. 25% senescence); 50%G, the time interval between 75%G and 25%G; 25%G, the time to reach 75% senescence; Ts, onset time of leaf senescence; To, end time of leaf senescence, WW, well watered; DS, drought stress; LOD, logarithm of the odds.
* Genetic distance of the putative QTL from the left flanking marker.
† Additive effect, a positive value indicates the allele is from H10, while a negative value means the allele is from L14.
‡ H2 (%) indicates the phenotypic variance explained by the additive QTL.
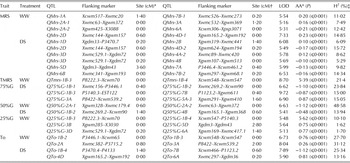
All traits related to progression of senescence were influenced by epistatic effects of the additive × additive type, except for Ts. A total of 23 pairs of epistatic QTLs were identified (Table 5). These epistatic QTL, explaining phenotypic variations ranging from 1·62 to 48·58%, showed more interactions between non-allelic genes from the B-genome. Of these, 13 pairs had positive effects, i.e., the parent-type effects were higher than the recombinant-type effects. However, the other 20 pairs showed negative effects, where the recombinant-type effects were higher than the parent-type effects.
Characteristics of epistatic QTL for traits related to progression of senescence detected in DH population (produced from the Hanxuan 10 × Lumai 14 cross)

QTL, quantitative trait loci; MRS, maximum rate of senescence; TMRS, time to maximum rate of senescence; 75%G, time interval from 100% green leaf area to 75% green leaf area (i.e. 25% senescence); 50%G, the time interval between 75%G and 25%G; 25%G, the time to reach 75% senescence; Ts, onset time of leaf senescence; To, end time of leaf senescence, WW, well watered; DS, drought stress; LOD, logarithm of the odds.
* Direction of epistatic effect: positive value represents parent type effect > recombinant-type effect, negative value represents the opposite.
† Genetic distance of the putative QTL from the left flanking marker.
‡ H2(%) indicates the phenotypic variance explained by the epistatic QTL.
DISCUSSION
Senescence is a relatively complex trait to quantify, primarily because of its progressive nature with time. Traits related to the progression of senescence vary in the DHLs and hence cannot be properly quantified using senescence measurements at any one time point. Previous studies on the stay-green trait in wheat and other species were conducted at a given point of time (Xu et al. Reference Xu, Subudhi, Crasta, Rosenow, Mullet and Nguyen2000; Cha et al. Reference Cha, Lee, Koh, Lee, Nam and Paek2002; Verma et al. Reference Verma, Foulkes, Worland, Sylvester-Bradley, Caligari and Snape2004). Although this may have some value, a dynamic rating of senescence over the period of wheat development from flowering to physiological maturity would be more useful in characterizing the behaviour of DHLs under drought stress. In the present study, using Gompertz's non-linear regression curve, MRS, TMRS, PGMS, Ts and To, which characterize the progress of senescence, were able to distinguish different DHLs. Three groups under drought stress and four under well-watered conditions were separated using DPS v7.0. Compared to other lines, L117 maintained greater green leaf area, had lower MRS, longer TMRS, higher PGMS, and later Ts and To. This line may be used as an ideal line in future programmes for breeding high yielding cultivars.
Previous studies observed that drought induced premature leaf senescence (Buchanan-Wollaston Reference Buchanan-Wollaston1997; Noodén et al. Reference Noodén, Guiamét and John1997). Common wheat (Verma et al. Reference Verma, Foulkes, Worland, Sylvester-Bradley, Caligari and Snape2004) and other cereals, such as sorghum (Rosenow & Clark Reference Rosenow, Clark, Loden and Wilkinson1981), maize (Bänziger et al. Reference Bänziger, Edmeades and Lafitte1999) and durum wheat (Hafsi et al. Reference Hafsi, Mechmeche, Bouamama, Djekoune, Zaharieva and Monneveux2000) have been shown to exhibit differences in flag leaf senescence under drought. Stay-green genotypes conferred resistance to drought (Rosenow et al. Reference Rosenow, Quisenberry, Wendt and Clark1983; Spano et al. Reference Spano, Di Fonzo, Perrotta, Platani, Ronga, Lawlor, Napier and Shewry2003). In the present study, variance analyses of DHLs showed that the two water regimes affected the traits related to the progression of senescence differently. The averages of traits related to progression of senescence in DHLs under drought stress were significantly lower than those under well-watered conditions. Further, the present data revealed that the expression of some QTLs was induced by drought stress. Such QTLs were also clustered in the same marker regions. For example, QTmrs-1A, Q25%G-1A, QTs-1A and QTo-1A were within the P3615.2-Xwmc336 interval on chromosome 1A. Q75%G-5A-1 and QTs-5A were co-localized with markers Xwmc524 and Xwmc595 on chromosome 5A. Similarly, a marker interval of P3622.3-P1133 on chromosome 1B was also shared by Q25%G-1B-2 and QTo-1B-1. QMrs-1B and Q50%G-1B-1 detected under drought stress were linked with Xcwm65. In a previous study, a QTL for chlorophyll content was also detected at a marker interval of P3615.2-Xwmc336 on chromosome 1A and a QTL for Fo (PCFKs) was near the marker Xcwm65 on chromosome 1B under drought stress using the same population (Yang et al. Reference Yang, Jing, Chang and Li2007). In addition, QTmrs-5B and Q25%G-5B were co-located under well-watered conditions, suggesting that their expression was dependent on water status. In contrast, QTmrs-5A, Q25%G-5A and QTo-5A detected under drought stress and Q75%G-5A-2 detected under well-watered conditions were near marker Xwmc74. If they were at the same locus, their functions would be influenced by the water conditions. Therefore, different sets of loci conferring various expression patterns under different water conditions provided the genetic basis for highly significant phenotype differences among DHLs under the two water conditions used.
As senescence progresses in plant, the photosynthetic capacity and photochemical quenching efficiency of photosystem II in the senescing leaf are gradually inhibited because of the degradation of ribulose-1,5-bisphosphate carboxylase, photosynthetic pigments and pigment-binding proteins (Grover Reference Grover1993; Gan & Amasino Reference Gan and Amasino1997; Noodén et al. Reference Noodén, Guiamét and John1997). The leaf senescence process is related not only to the GLAD but also to the chlorophyll content and chlorophyll fluorescence (Choudhury & Imaseki Reference Choudhury and Imaseki1990; Lu & Zhang Reference Lu and Zhang1998; Jiang et al. Reference Jiang, He, Xu, Li and Zhang2004). Several QTLs for traits related to progression of senescence detected in the present study were also consistent with the QTLs responsible for chlorophyll content and chlorophyll fluorescence identified previously. For instance, the same marker Xcwm65 was identified to link QMrs-1B and Q50%G-1B-1 detected under drought stress in the present study, as well as other QTLs previously detected, including QFoH-1B under high-light-induced photo-oxidation (HLIP) (Li et al. Reference Li, Tong, Li, Jing, Lu and Li2010) and QFo.cgb-1b-1 under drought stress (Yang et al. Reference Yang, Jing, Chang and Li2007). Similarly, QTmrs-1A, Q25%G-1A, QTs-1A and QTo-1A, detected under drought stress in the present study, coincided with Q FmH-1A-1 mapped under HLIP (Li et al. Reference Li, Tong, Li, Jing, Lu and Li2010) and QChlc.cgb-1A located under drought stress by Yang et al. (Reference Yang, Jing, Chang and Li2007). The collocations of HLIP-and drought-induced QTLs demonstrated the similar genetic mechanism underlying the effect of high light and drought on leaf senescence. Additionally, the marker P1133 was linked with the two QTLs (Q25%G-1B-2 and QTo-1B-1) mapped under drought stress in the present study and the three QTLs (QFmN-1B-2, QFv/FmN-1B and QFoN-1B-2) previously detected under non-HLIP (Li et al. Reference Li, Tong, Li, Jing, Lu and Li2010). Several QTLs co-located near Xwmc74, including QTmrs-5A, Q25%G-5A and QTo-5A, were currently detected under drought stress and Q75%G-5A-2 mapped under well-watered conditions, as well as QChlc-cgb-5A-2 reported by Yang et al. (Reference Yang, Jing, Chang and Li2007) under well-watered conditions. QTmrs-5B and Q25%G-5B, mapped under well-watered conditions in the present study and QFmR-5B reported in a previous study (Li et al. Reference Li, Tong, Li, Jing, Lu and Li2010) were linked with P5140-360. QMrs-2D, detected in this study under well-watered conditions, and QFoH-2D and QFoR-2D-1, reported by Li et al. (Reference Li, Tong, Li, Jing, Lu and Li2010), were co-located between Xwmc144-Xgwm157. Using a wheat microsatellite consensus map (Somers et al. Reference Somers, Isaac and Edwards2004) as a reference map, it was found that four QTLs were located in a marker region of c. 4 cM on chromosome 7A, including QTs-7A and Q75%G-7A found under well-watered conditions in the present study, and QTmrs-ksu-7A identified under optimum temperature and QFv/Fmh-ksu-7A mapped under heat stress (Vijayalakshmi et al. Reference Vijayalakshmi, Fritz, Paulsen, Bai, Pandravada and Gill2010). This marker region on chromosome 7A also contained other QTLs, such as QChla + b.igdb-7A.1, QChla.igdb-7A.1, QChlb.igdb-7A.1, QChla/b.igdb-7A.2, QFm.igdb-7A.2, QChla + b.igdb-7A.2, QChla.igdb-7A.3 and QChlb.igdb-7A.2 detected under dark-induced conditions (Li et al. Reference Li, Lin, Wang, Jing, Zheng, Li and Li2012) and QFm.cgb-7A-1 detected under drought stress (Yang et al. Reference Yang, Jing, Chang and Li2007). These co-located or linked senescence-related QTLs may be expressed constitutively under different conditions, showing that these QTLs may be of crucial importance for wheat improvement. Further study is needed to understand these QTL clusters well.
The present data revealed high phenotypic correlations between traits related to progression of senescence in the wheat flag leaf. The genetic basis of such high correlations can be largely explained by the co-localization of the QTLs for these traits, either due to pleiotropic effects or tight linkage. On the other hand, positive correlation of stay-green (delayed senescence) traits with high grain yield has been reported in previous studies (Gorny & Garczynski Reference Gorny and Garczynski2002; Spano et al. Reference Spano, Di Fonzo, Perrotta, Platani, Ronga, Lawlor, Napier and Shewry2003). Verma et al. (Reference Verma, Foulkes, Worland, Sylvester-Bradley, Caligari and Snape2004) mapped several QTLs for grain yield and flag leaf senescence near the markers Xgwm30 and Xgwm539 on chromosome 2D in winter wheat, whereas in the present study, QMrs-2D detected under well-watered conditions was located in the same region. By comparing with a chromosome bin map constructed by Sourdille et al. (Reference Sourdille, Singh, Cadalen, Brown-Guedira, Gay, Qi, Gill, Dufour, Murigneux and Bernard2004) and D-genome sequences (Jia et al. Reference Jia, Zhao, Kong, Li, Zhao, He, Appels, Pfeiffer, Tao, Zhang, Jing, Zhang, Ma, Gao, Gao, Spannagl, Mayer, Li, Pan, Zheng, Hu, Xia, Li, Liang, Chen, Wicker, Gou, Kuang, He, Luo, Keller, Xia, Lu, Wang, Zou, Zhang, Xu, Gao, Middleton, Quan, Liu, Wang, Yang, Liu, He, Mao and Wang2013), the QTL was physically anchored in 2DL-3 deletion bin and scaffold41009. QTmrs-1A, Q25%G-1A, QTs-1A and QTo-1A detected under drought stress in the present study were physically mapped in a distal deletion bin 1AS-3. These data will not only assist in marker development and map-based cloning of target genes, but also are helpful to understand the genetic mechanism of leaf senescence and yield traits.
This work was supported by CGIAR Generation Challenge Programme (GCP, G7010.02.01), the Specialized Research Fund for the Doctoral Program of Higher Education (20121403110005), Research Project Supported by Shanxi Scholarship Council of China (2010048) and the Introduction of Talent and Specialized Development Fund in Shanxi (2011).