I. INTRODUCTION
Graphitization of silicon carbide (SiC) via thermal decomposition in a high-vacuum environment has been studied for about 40 years. Reference Van Bommel, Crombeen and Van Tooren1–Reference Tromp and Hannon4 Since the breakthrough research revealing the remarkable transport characteristics of graphene in 2004, Reference Novoselov, Geim, Morozov, Jiang, Zhang, Dubonos, Grigorieva and Firsov5,Reference Berger, Song, Li, Li, Ogbazghi, Feng, Dai, Marchenkov, Conrad, First and de Heer6 a dramatic increase in the study of SiC thermal decomposition has occurred. Graphene synthesis by thermal decomposition of SiC exploits incongruent sublimation when the material is exposed to high temperature and low pressure. Under these conditions, the vapor in equilibrium with SiC has a Si concentration which is about four orders of magnitude greater than the carbon concentration, Reference Drowart, De Maria and Inghram7,Reference Davis, Anthrop and Searcy8 leading to graphitization of the surface. The underlying SiC substrate, having the space group P63 mc with a hexagonal lattice, provides excellent symmetry matching for graphene epitaxy. Graphene grown in this manner is referred to as “epitaxial graphene,” Reference Berger, Song, Li, Li, Ogbazghi, Feng, Dai, Marchenkov, Conrad, First and de Heer6 and possesses 2D Dirac electron properties rivaling those of exfoliated graphite, including the quantum Hall effect and a Berry's phase. Reference Berger, Song, Li, Wu, Brown, Naud, Mayou, Li, Hass, Marchenkov, Conrad, First and de Heer9–Reference Shen, Neal, Bolen, Gu, Engel, Capano and Ye13
Most early investigations of epitaxial graphene were performed in ultra-high vacuum (UHV). Growth in UHV facilitated the use of many in situ surface analytical techniques, such as low-energy electron diffraction or microscopy (LEED or LEEM), scanning tunneling microscopy (STM), and x-ray photoelectron spectroscopy. These analytical techniques provided substantial information about the structural transformation from SiC to graphene. Specific surface reconstructions were consistently observed prior to the formation of graphene. On Si-terminated 4H– or 6H–SiC, subsequently referred to as SiC(0001), transition in surface reconstructions occurred from Si-rich (3 × 3) to (1 × 1) to (√3 × √3) to (6√3 × 6√3) R30° to graphene as temperature increased.
Reference Forbeaux, Themlin and Debever14,Reference Hannon and Tromp15
Similar studies on the C-terminated face, referred to hereafter as SiC (000
 $\bar 1$
), showed a transition from Si-rich (3 × 3) directly to graphene.
Reference Emtsev, Speck, Seyller, Riley and Ley16
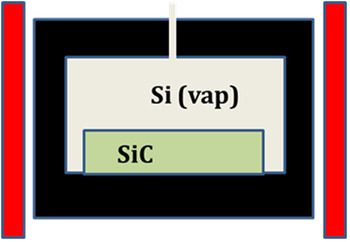
The premier example of epitaxial graphene growth in UHV is the “confinement controlled growth” solution developed at Georgia Tech, shown schematically in Fig. 1. Reference de Heer, Berger, Ruan, Sprinkle, Li, Hu, Zhang, Hankinson and Conrad17 In this method, SiC is placed in an enclosure under UHV conditions. As the temperature is ramped to about 1500 °C, silicon begins to sublime from SiC. In a perfect enclosure free of holes, Si vapor would be in equilibrium with the SiC crystal. A hole in the enclosure allows a small quantity of Si vapor to escape, resulting in graphene growth. The only variable that controls growth kinetics is temperature. The drilled hole “fixes” the departure of the sample/vapor system from thermodynamic equilibrium. Although graphene showing outstanding electronic properties is grown this way, scale-up to wafer dimensions is difficult.
Schematic illustration of the confinement control system for graphene.

A chemical vapor deposition (CVD)-based method for epitaxial graphene has been presented by the authors in 2007 at the International Conference for Silicon Carbide and Related Materials, and subsequently published in the open literature. Reference Wu, Ye, Capano, Xuan, Sui, Qi, Cooper, Shen, Pandey, Prakash and Reifenberger18 This work proved UHV conditions are not required for epitaxial graphene. Later, Emtsev et al., Reference Emtsev, Bostwick, Horn, Jobst, Kellogg, Ley, McChesney, Ohta, Reshanov, Rohrl, Rotenberg, Schmid, Waldmann, Weber and Seyller19 published a paper describing “Ar-mediated growth” at atmospheric pressure. The Ar-mediated technique of Emtsev et al. relies on gas-phase dynamics to reflect a portion of sublimated Si back onto the surface to restrict further sublimation. This method is a step toward wafer-scale graphene synthesis but lacks sufficient process flexibility to achieve highly uniform graphene on large area wafers.
References Reference Wu, Ye, Capano, Xuan, Sui, Qi, Cooper, Shen, Pandey, Prakash and Reifenberger18 and Reference Bolen, Shen, Gu, Colby, Stach, Ye and Capano20 represent growth conditions that are intermediate between those of confinement control Reference de Heer, Berger, Ruan, Sprinkle, Li, Hu, Zhang, Hankinson and Conrad17 and Ar-mediated Reference Emtsev, Bostwick, Horn, Jobst, Kellogg, Ley, McChesney, Ohta, Reshanov, Rohrl, Rotenberg, Schmid, Waldmann, Weber and Seyller19 growth methods. The growth process in Refs. Reference Wu, Ye, Capano, Xuan, Sui, Qi, Cooper, Shen, Pandey, Prakash and Reifenberger18 and Reference Bolen, Shen, Gu, Colby, Stach, Ye and Capano20, referred to as “controlled ambient synthesis,” is an extremely versatile approach to growing graphene. In this article, graphene growth in the pressure regime of 1–150 mbar is considered. The range of pressures examined is chosen because high-mobility C-face graphene has been demonstrated at these pressures. Reference Bolen, Shen, Gu, Colby, Stach, Ye and Capano20,Reference Tedesco, VanMil, Myers-Ward, Culbertson, Jernigan, Campbell, McCrate, Kitt, Eddy and Gaskill21
II. EXPERIMENTAL
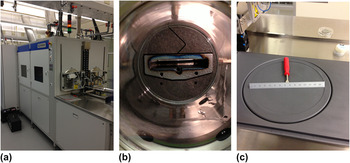
Silicon carbide (SiC) substrate material used for all growth runs is nominally on-axis, semi-insulating 4H–SiC from Cree Inc. (Durham, NC). Before each growth run, samples are cleaned with solvents and acid solutions. An Epigress VP508 hot-walled reactor (Lund, Sweden), shown in Fig. 2, is used for hydrogen etching and graphene growth. Etching is performed at 1500 °C in 150 mbar of pure H2 to remove scratches. Graphene synthesis by thermal decomposition at high temperature (1400–1650 °C) is carried out under high-vacuum with a chamber pressure approximately 10−5 mbar or in an Ar environment ranging from 1−900 mbar. Typical hold time is 10 min. A more detailed description of the growth conditions can be found elsewhere. Reference Bolen, Harrison, Biedermann and Capano22
CVD system for graphene growth up to 150-mm diameter showing (a) external perspective, (b) looking down 300-mm diameter quartz growth cell, and (c) 150-mm diameter wafer holder.

After growth, samples are analyzed using multiple techniques. Atomic force microscopy is performed using a Veeco Dimension 3100 atomic force microscope (AFM; Plainview, NY) in dynamic force mode, with Veeco's TESP model uncoated Si microcantilevers. Raman spectroscopy is performed using a 532-nm sapphire laser at 6 mW with an Acton 300i spectrometer (Princeton Instruments, Acton, MA). For this article, structural characterization of samples is performed with high-resolution (resolution limit of about 0.008 Å−1) grazing incidence x-ray diffraction (GIXD) at the Stanford Synchrotron Radiation Laboratory (SSRL). Reference Lee, Toney, Ko, Randel, Jung, Munakata, Lu, Geballe, Beasley, Sinclair, Manoharan and Salleo23
III. RESULTS AND DISCUSSION
As stated in Sec. I, growth in argon reduces the overall Si sublimation rate from the SiC surface, leading to more homogeneous graphene films with larger domain sizes than attainable under high-vacuum. Reference Wu, Ye, Capano, Xuan, Sui, Qi, Cooper, Shen, Pandey, Prakash and Reifenberger18,Reference Sutter24,Reference Virojanadara, Syväjarvi, Yakimova, Johansson, Zakharov and Balasubramanian25 There is great interest in graphene on the C-face of SiC because its transport properties are superior to those on the Si-face. Reference Hass, Feng, Li, Li, Zong, de Heer, First, Conrad, Jeffrey and Berger26–Reference Tedesco, VanMil, Myers-Ward, McCrate, Kitt, Campbell, Jernigan, Culbertson, Eddy and Gaskill29 Although the number of graphene layers on the C-face is usually large (often tens of layers thick), individual layers are electronically decoupled due to stacking disorder, resulting in high electron mobility and 2D-like electronic properties. Reference de Heer, Berger, Wu, First, Conrad, Li, Li, Sprinkle, Hass, Sadowski, Potemski and Martinez27,Reference Hass, Feng, Millán-Otoya, Li, Sprinkle, First, de Heer, Conrad and Berger30,Reference Hass, Varchon, Millán-Otoya, Sprinkle, Sharma, de Heer, Berger, First, Magaud and Conrad31 However, comparisons of carrier mobility between Si- and C-face samples grown in vacuum, and C-face samples grown in vacuum and low-pressure Ar ambient presented in Table I, illustrate that growth in argon does not guarantee high-mobility graphene on the carbon face of SiC.
Mobility data for graphene under various processing conditions.

Immediately evident from the data is the lack of a systematic variation in C-face mobility as a function of pressure. If the premise for growing in Ar is to reduce Si sublimation, than growth in 1 mbar argon is expected to yield a higher average mobility than growth in vacuum, all other parameters are equal. To better understand this mobility data, and to gain a measure of the reproducibility of graphene synthesis, the structure of these films is investigated by GIXD.
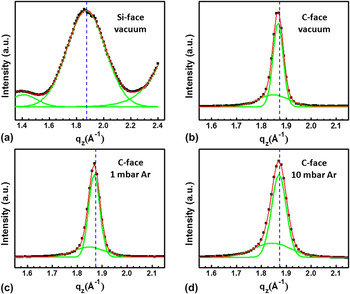
A specular scan in Fig. 3(a) of the Si-face graphene layer displays a broad peak with a Gaussian shape centered at q z = 1.873 Å−1, and a small lower Q peak, which is a finite-size peak (Kiessing fringe). The main peak has a (full-width at half maximum) FWHM = 0.283 Å−1 corresponding to a 2.22-nm (7 monolayers) thick graphene film with an interlayer spacing of 3.355 Å, nearly identical to the interplanar spacing of Bernal-stacked graphite (d = 3.354 Å). Specular scans of C-face graphene films (samples B, C, and D) are best fit with two Gaussian peaks having very different FWHM values [Figs. 3(b)–3(d)]. This suggests the graphene thickness distribution is bimodal, with films possessing thick and thin regions, in agreement with previous reports. Reference Jernigan, VanMil, Tedesco, Tischler, Glaser, Davidson, Campbell and Gaskill28,Reference Luxmi, Guowei, Feenstra and Fisher32 Using the Scherrer equation, film thicknesses are estimated based on curve fitting. Thin and thick regions are approximately 15 and 46 monolayers in sample B, 14 and 42 monolayers in sample C, and 12 and 32 monolayers in sample D [Figs. 3(b)–3(d)]. The number of monolayers in the thicker regions decreases faster (from 46 to 32 layers) than in the thinner film regions (from 15 to 12 layers) as argon pressure increases, indicating higher Ar pressure reduces thickness nonuniformity.
X-ray specular scan of (a) sample A (Si-face, vacuum), (b) sample B (C-face, vacuum), (c) sample C (C-face, 1 mbar Ar), and (d) sample D (C-face, 10 mbar Ar). Curve fitting (red traces) of the spectra around q z = 1.873 Å−1 using a single Gaussian for sample A, and two Gaussian curves (green traces) for sample B, C, and D. The blue dashed lines correspond to the d-spacing of Bernal-stacked graphite (q z = 1.873 Å−1, d = 3.354 Å).

A rough estimate of the relative amount of thin and thick regions on any one sample can be obtained by calculating the area ratios under the Gaussian peaks. The calculated ratios of thick:thin regions are 1.3:1, 1:1, and 1.1:1 for sample B (vacuum), sample C (1 mbar Ar), and sample D (10 mbar Ar), respectively. The lack of dependence of thickness ratio on argon pressure may indicate variations in defect distributions in the substrate are a dominant factor in determining thickness uniformity.
Figure 4 is an x-ray topograph that reveals dislocations in 4H–SiC starting materials. Although no single topograph can image all dislocations, the (10
 $\bar 1$
8) x-ray topograph reveals all screw dislocations with Burgers vector [000n]. This topograph is taken in reflection to image dislocations close to the surface. Specular scans of Fig. 3 are collected using a small incidence angle, and long sections of the surface (several mm2) contribute to the diffraction data. In locations with high dislocation density, Si–C bonds are more highly strained, and the activation barrier for Si sublimation is lower. It is reasonable to expect thickness variations in light of the dislocation density variations shown in Fig. 4.
X-ray reflection topograph from (10
 $\bar 1$
8) diffraction peak. Lighter features on dark background are defects near the SiC surface. Low defect area is located at “1” and a highly defective region is located at “2.” Total area is 1 × 1 cm.

Peak positions of graphene films on the C-face in Fig. 3 are observed at smaller q z compared to Bernal-stacked graphite (q z = 1.873 Å−1). Hence, the d-spacing of graphene layers on the C-face (about 3.400 and 3.367 Å for sample B; about 3.400 and 3.364 Å for sample C, and about 3.409 and 3.360 Å for sample D) is markedly larger than on the Si-face (about 3.355 Å). This interlayer expansion of C-face graphene layers contributes to a higher mobility usually measured compared to mobility measured from Si-face graphene. Reference Hass, Feng, Li, Li, Zong, de Heer, First, Conrad, Jeffrey and Berger26,Reference Tedesco, VanMil, Myers-Ward, McCrate, Kitt, Campbell, Jernigan, Culbertson, Eddy and Gaskill29,Reference Hass, Feng, Millán-Otoya, Li, Sprinkle, First, de Heer, Conrad and Berger30
Azimuthal (phi) scans of in-plane graphene (100) peaks in Fig. 5 are used to determine the in-plane texture of the films, with ϕ = 0° defined along the [
 $10\bar 10$
] direction of SiC. The sharp peak at ϕ = 30° with a narrow FWHM (=0.25° for sample A) confirmed that graphene layers are epitaxial and displayed the expected crystallographic relationship with respect to the SiC substrate. A phi scan away from the graphene (100) peak coincided with the baseline intensity in Fig 5(a), showing there is no randomly oriented graphene on the Si-face of SiC [Fig. 5(a)]. In vacuum-grown C-face graphene (sample B),
Reference de Heer, Berger, Wu, First, Conrad, Li, Li, Sprinkle, Hass, Sadowski, Potemski and Martinez27,Reference Sprinkle, Hicks, Tejeda, Taleb-Ibrahimi, Fèvre, Bertran, Tinkey, Clark, Soukiassian, Martinotti, Hass and Conrad33
there is a measurable diffraction signal up to approximately 10° off the main peak in the phi scan [Fig. 5(b)]. The graphene (100) diffraction away from 30° becomes more prominent in Ar-grown graphene films (samples C and D) even though these films have a smaller number of layers than the vacuum-grown sample [Figs. 5(c) and 5(d)]. This observation demonstrates that Ar-grown samples have more in-plane disordered graphene. As a result, these layers become more electronically decoupled and behave more like a single sheet of graphene.
Reference Hass, Feng, Millán-Otoya, Li, Sprinkle, First, de Heer, Conrad and Berger30,Reference Hass, Varchon, Millán-Otoya, Sprinkle, Sharma, de Heer, Berger, First, Magaud and Conrad31
Stacking disorder reduces van der Waals interactions between graphene layers, which leads to an increase of the interlayer spacing of graphene,
Reference Hass, Feng, Millán-Otoya, Li, Sprinkle, First, de Heer, Conrad and Berger30,Reference Hass, Varchon, Millán-Otoya, Sprinkle, Sharma, de Heer, Berger, First, Magaud and Conrad31,Reference Franklin34,Reference Baskin and Meyer35
in agreement with the specular scans [Figs. 3(b)–3(d)]. Specular diffraction data show the thinner regions in samples B, C, and D have larger interlayer stacking distances than graphite. The thicker regions, on the other hand, have interlayer spacing closer to that of Bernal-stacked graphite. To explain these observations, it is hypothesized that graphene layers initially form with randomly stacked layers on the C-face because of inadequately controlled sublimation leading to high initial growth rates. As layers grow thicker, the interlayer spacing relaxes to a value closer to that of Bernal-stacked graphite.
X-ray azimuthal phi-scan of the (100) in-plane peak around ϕ = 30° with respect to the underlying SiC lattice along the [
 $10\bar 10$
] direction of SiC in (a) sample A (Si-face, vacuum), (b) sample B (C-face, vacuum), (c) sample C (C-face, 1 mbar Ar), and (d) sample D (C-face, 10 mbar Ar).

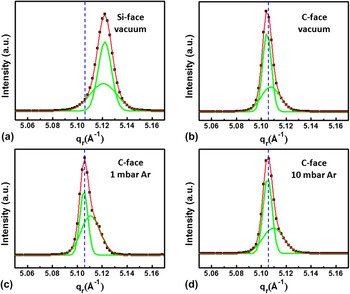
High-resolution in-plane GIXD is used to study the structure of graphene in the film plane. All samples display the typical features of the graphene unit cell as shown in radial scans along the graphene (100) and (110) directions. Reference Lee, Toney, Ko, Randel, Jung, Munakata, Lu, Geballe, Beasley, Sinclair, Manoharan and Salleo23,Reference Hass, Feng, Li, Li, Zong, de Heer, First, Conrad, Jeffrey and Berger26,Reference de Heer, Berger, Wu, First, Conrad, Li, Li, Sprinkle, Hass, Sadowski, Potemski and Martinez27,Reference Wallace36 The radial peaks of graphene on the Si-face (sample A) are shifted toward larger q r (=smaller a G) compared to the expected values for graphite (q r = 2.553 Å−1, a G = 2.461 Å, and q r = 5.106 Å−1, a G/2 = 1.2305 Å) [Fig. 6(a)], suggesting graphene layers are under biaxial compressive strain at room temperature. The compressive strain of this graphene film is isotropic and calculated to be 0.31%. This isotropic compressive strain can be attributed to the large difference in thermal expansion coefficients between graphene and SiC (αG < αSiC), Reference Röhrl, Hundhausen, Emtsev, Seyller, Graupner and Ley37,Reference Ferralis, Maboudian and Carraro38 which affects the electronic properties of graphene films. Reference Robinson, Wetherington, Tedesco, Campbell, Weng, Stitt, Fanton, Frantz, Snyder, VanMil, Jernigan, Myers-Ward, Eddy and Gaskill39–Reference Huang, Yan, Heinz and Hone41 Such strain information averaged over relatively large areas of graphene on SiC (≈mm2 for these experiments) cannot be obtained with characterization tools that probe local structures such as Raman spectroscopy. Reference Röhrl, Hundhausen, Emtsev, Seyller, Graupner and Ley37,Reference Ferralis, Maboudian and Carraro38,Reference Robinson, Puls, Staley, Stitt and Fanton42 In contrast to graphene on the Si-face (sample A), radial scans of graphene on the C-face samples display peaks located very close (within 0.05%) to that of unstrained graphite [Figs. 6(b)–6(d)], indicating that a relaxation of the compressive strain has occurred in these thicker films. The lattice constant of graphene films converges to that of bulk graphite as layer thickness increases and forms wrinkles or ridge structures, which are usually observed in thermally grown epitaxial graphene on the C-face caused by thermal stresses built-up upon cooling. Reference Bolen, Shen, Gu, Colby, Stach, Ye and Capano20,Reference Luxmi, Guowei, Feenstra and Fisher32,Reference Tedesco, Jernigan, Culbertson, Hite, Yang, Daniels, Myers-Ward, Eddy, Robinson, Trumbull, Wetherington, Campbell and Gaskill43–Reference Colby, Bolen, Capano and Stach45
X-ray radial scan of (a) sample A (Si-face, vacuum), (b) sample B (C-face, vacuum), (c) sample C (C-face, 1 mbar Ar), and (d) sample D (C-face, 10 mbar Ar) across the (11) rod of graphene reciprocal lattice. Curve fitting (red traces) of the spectra around q r = 5.106 Å−1 using two Gaussians (green traces) for all samples. The blue dashed lines correspond to one half of the lattice constant of the unit cell in unstrained graphene (q r = 5.106 Å−1, a G/2 = 1.2305 Å).

Peaks in the radial scans contain much information about the microstructure of graphene. A complete and systematic analysis of their shape and position as a function of processing conditions is beyond the scope of this manuscript. Nevertheless, qualitative statements can be made. The width of the radial scan across the (11) rod is broader in Si-face graphene compared to C-face graphene. This observation strongly suggests Si-face graphene is smaller grained in-plane compared to C-face graphene. The larger coherence length contributes to the (generally) higher carrier mobility of graphene on the C-face graphene compared to mobility on the Si-face graphene, in agreement with previous reports. Reference Sutter24,Reference Hass, Feng, Li, Li, Zong, de Heer, First, Conrad, Jeffrey and Berger26,Reference de Heer, Berger, Wu, First, Conrad, Li, Li, Sprinkle, Hass, Sadowski, Potemski and Martinez27,Reference Zhou, Gweon, Fedorov, First, de Heer, Lee, Guinea, Castro Neto and Lanzara46 Furthermore, on C-face graphene, peaks in the same radial scans show a pronounced asymmetry. Such a peak shape (i.e., the existence of a “tail” at q r higher than the peak q r) suggests the grain structure has two distributions coexisting in the film with differently sized domains having slightly different lattice parameters. The angular resolution of the scans does not permit accurate deconvolution of components, but it is reasonable that the high-q r tail is due to a population of smaller compressively strained crystallites. Interestingly, the film that displays the lowest mobility (sample C) has the largest population of small crystallites (coherence length on the order of ∼30 nm) as evidenced by the broader, more intense tail. Samples B and D, on the other hand, have different average mobility, but their in-plane grain structure appears similar. The higher mobility of the film grown in the Ar atmosphere (9000 cm2/Vs) may be attributed to the more pronounced rotational disorder which increases isolation of individual graphene layers. It should be added that a more complete analysis would entail measuring these parameters in all crystallographic orientations. These results, nevertheless, indicate that graphene film structures can vary dramatically under Ar growth conditions.
IV. CONCLUSIONS
Growth in a low-pressure Ar environment is shown to lead to inconsistent structural characteristics of graphene. Specular scans of C-face graphene manifest a bimodal distribution of thicknesses that decrease with increasing Ar pressure. Thin and thick regions are centered at 15 and 46 monolayers when grown at high vacuum, 14 and 42 monolayers when grown at 1 mbar, and 12 and 32 monolayers when grown at 10 mbar. Azimuthal scans showed graphene displays orientation relationships consistent with epitaxy. In-plane azimuthal rotational disorder increases as pressure increases. Peaks in radial scans are asymmetric, suggesting the grain structure has a bimodal distribution of large and small domains. Relative populations of small and large domain sizes from sample to sample tracks with measured average mobility from C-face graphene. Variations in structure and mobility of C-face graphene are attributed to inadequate control of Si sublimation during growth.
ACKNOWLEDGMENTS
This work is funded through grants from Indiana's 21 Fund, AFRL, and DARPA. Portions of this research were carried out at the Stanford Synchrotron Radiation Lightsource, a Directorate of SLAC National Accelerator Laboratory and an Office of Science User Facility operated for the U.S. Department of Energy Office of Science by Stanford University. The authors acknowledge the contributions of Diana Convey (Arizona State University) for help with x-ray topography.