

1 Introduction
Regulations play a critical role in shaping the institutions that impact individuals, entrepreneurs, and firms. An examination of the numerous formal rules involved in the production, consumption, and trade of goods and services offers insight into the substantial impact of regulations on society. Available data regarding regulation at the federal level in the United States suggests that regulation is increasingly relied upon to alleviate social and economic issues. A page count of the Federal Register and an analysis of RegData, which provides a quantification of regulation at the federal level, both display increases in federal regulatory activity in recent years.Footnote 1, Footnote 2 Furthermore, Dudley and Warren show that annual federal regulatory budgets have increased in real terms while federal regulatory staffing has increased in an analysis of recent spending and staffing trends of seventy-five regulatory agencies.Footnote 3
Effective regulations are of extreme importance as regulations are currently relied upon to address numerous social and economic issues in society. The primary contribution of this paper involves the examination of regulatory interpretation across regulators, entrepreneurs or firms, and the courts. Regulatory interpretation ideally involves a common understanding of the requirements necessitated by a regulation. Although this may seem straightforward at first glance, the interpretation of regulation can be complex in practice. Some specific rules that apply to a single scenario, such as laws that prohibit the hours of operation for a firm, may be relatively simple to interpret. However, other regulatory rulings are often exponentially more complex, such as those related to service in the health care industry or financial regulation. When applying a regulatory ruling in real world applications, regulatory interpretation may vary greatly across the parties involved. Additionally, regulatory interpretation may often diverge and evolve over time due to a host of changes in areas such as culture, politics, values, norms, agency leadership and employee turnover, scientific discovery, and other regulatory or legal rulings.
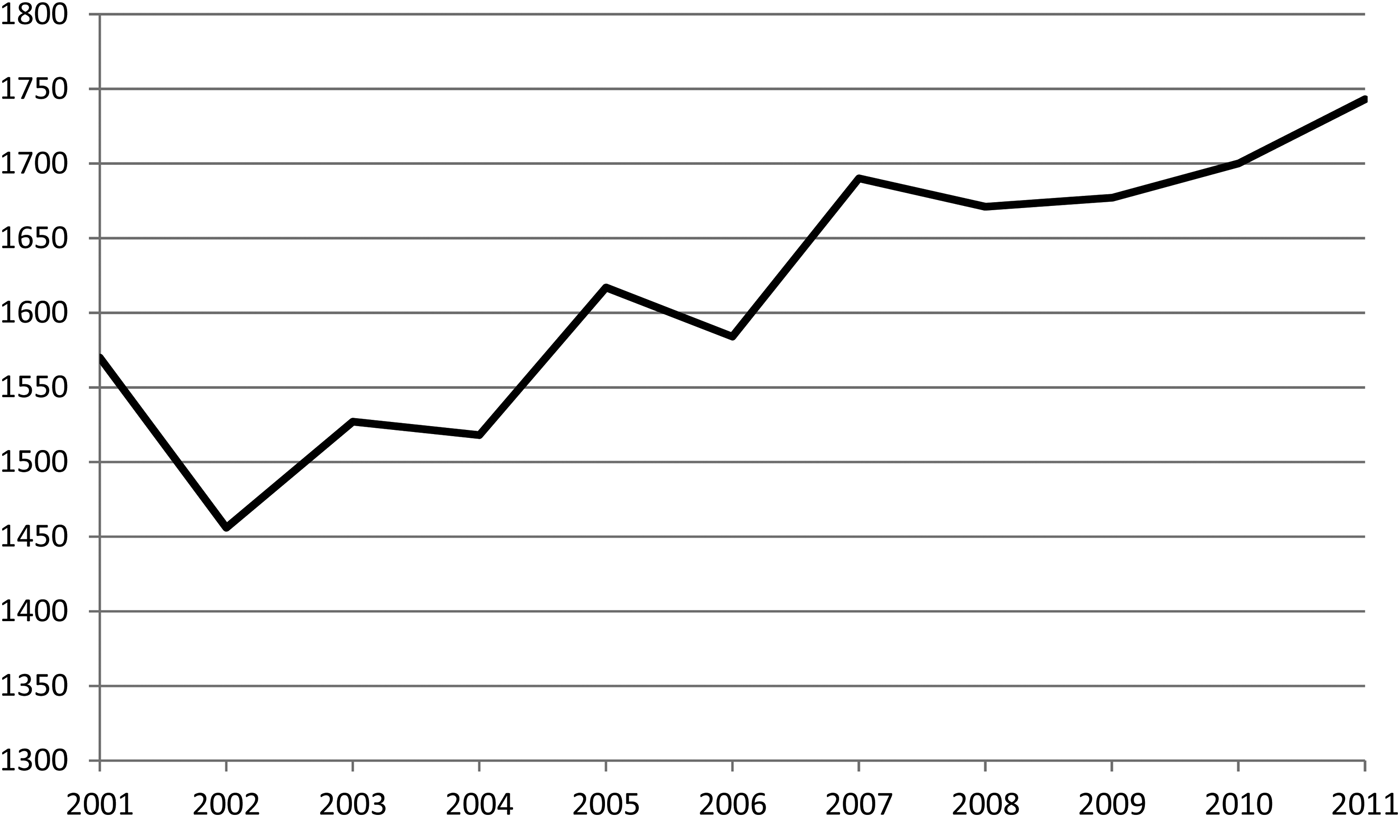
Regulatory interpretation has a significant impact on regulators, firms, and the courts, the three primary parties involved in the regulatory process. While regulators are often viewed as simple implementers of regulation in theory, regulators must often craft regulation from legislative orders, issue rules and regulations through congressional authority, interpret regulatory rulings, and apply regulatory rulings to various situations that change and evolve over time. Firms and entrepreneurs must interpret regulations to comply through reliance on compliance departments, regulatory agency employees, consultants, and rulings and handbooks issued by regulators. Regulatory agencies also utilize their own administrative tribunals and administrative law judges to assist in the enforcement of regulations. The courts are ultimately responsible for interpreting regulation if the regulator decides to prosecute a firm regarding a regulation or if a dispute arises between the parties. U.S. District Courts averaged approximately 1600 regulatory cases per year from 2001–11, highlighting the importance of regulatory interpretation in the courts. Further evidence of the significance of regulatory interpretation by the courts is apparent in the law literature.Footnote 4, Footnote 5
After briefly reviewing regulatory research to highlight the treatment of regulatory interpretation in the literature and exploring the insights within the public policy implementation literature that can assist in addressing regulatory interpretation challenges in section 2, the impact of regulatory interpretation on the parties involved in the regulatory process is outlined in section 3. A theoretical framework is introduced in section 4 with discussion of specific examples to highlight the role of regulatory interpretation in the interaction between the parties involved in the process and to demonstrate the varying degree of difficulty of regulatory interpretation across regulations. Section 5 explores the viability of several recent initiatives aimed at improving regulatory efficacy in addressing the challenges associated with regulatory interpretation and considers the implications regarding the design and use of regulation that emerge from the consideration of regulatory interpretation. Section 6 concludes with ideas for future research.
2 Economic theory of regulation and the regulatory literature
Policymakers and economists have long been interested in the potential for regulation to address various social and economic issues. An extensive literature across the fields of public policy, public administration, economics, law, and political science has produced a great deal of theoretical work examining the potential for regulation to be applied to specific industries and situations, often through the creation of formal models of regulation. Additionally, scholars in the fields of public policy, public administration, and political science have explored public policy implementation in detail. Related research has examined regulatory design, regulatory enforcement, regulatory compliance, and the culture of regulatory agencies. However, the impact of regulatory interpretation across the parties involved in the regulatory process is largely missing from much of the discussion, although the policy implementation literature does provide insight regarding methods to address regulatory interpretation challenges.
Much of the regulatory design theory explores the need for regulation in specific industries and attempts to design models to address issues from a regulatory standpoint. Crew and Kleindorfer provide an overview of the regulatory economics literature and highlight the primary debates and questions surrounding regulatory research.Footnote 6 The regulatory economics literature largely focused on limiting the inefficiencies associated with monopolies using peak-load pricing and Ramsey pricing through the 1980s. However, Baron and Myerson changed the direction of regulatory economics, integrating the concepts of principle-agent theory, mechanism design, and information economics.Footnote 7 Laffont and Tirole further refocused the field as regulatory economics began to specifically emphasize the incentives that confront parties involved in regulation.Footnote 8
However, Crew and Kleindorfer note that all lines of research within the field of regulatory economics suffer from a reliance on the regulator's common knowledge of firm details and/or perfect information to some extent.Footnote 9 Additionally, Crew and Kleindorfer highlight the challenge in regulatory design of simply keeping up with changes across many industries as the result of technology.Footnote 10 Despite these challenges, regulatory theory has been able to significantly impact regulatory policy in practice.
A common thread across the regulatory literature is the general omission of the issue of regulatory interpretation. While policymakers and economists have long recognized the role of information asymmetry and imperfect information in the regulatory process, the concept of regulatory interpretation in the regulatory theory literature is often generally considered to be obvious or excluded from the analysis entirely. While regulatory interpretation is mentioned in a number of academic studies, the explicit consideration of regulatory interpretation has only recently been the focus of some legal scholars due to the increasing importance of regulatory interpretation in the courts.Footnote 11 Regulatory interpretation differs from the standard information problems that regulators traditionally face in the regulatory economics literature, where the regulator may lack the information to properly design or enforce regulation. The issue of regulatory interpretation concerns how the parties involved in the regulatory process interpret a regulatory ruling. Depending on the regulatory issue at hand, regulatory interpretation issues may significantly impact the parties involved in the regulatory process and the efficacy of regulatory policy.
Previous research surrounding public policy implementation provides insight into the methods available to regulators and administrators to implement policies and regulations, although regulatory interpretation across parties is generally not explicitly addressed in the literature. O'Toole Jr. and Saetren each provide an overview of the public policy implementation literature.Footnote 12 O'Toole Jr. notes that through the 1980s the literature generally focused on a debate between a top-down approach to policy implementation, where policy designers are the focus and implement policy from a central position, and a bottom-up approach to policy implementation, where the final implementers and those who are the target of the policy are the focus of the process.Footnote 13 While much debate regarding the implementation of specific policies remains, a synthesis of the different approaches has emerged to some degree that provides insight regarding policy implementation. Matland offers theoretical guidance by considering both the ambiguity of a policy and the conflict between the parties involved in the implementation of a policy.Footnote 14 The theory suggests that a top-down approach, where regulators design a policy and push directives down to regulated parties, can work effectively for a clear, low-conflict policy implementation. A bottom-up approach, where regulators work with regulated parties to properly design and implement regulation, may be a better fit for an ambiguous, low-conflict policy implementation. High-conflict polices that are ambiguous provide challenges and likely requires elements of both approaches.
Furthermore, O'Toole Jr. cites the importance of the impact of research regarding institutional analysis, governance, and networks on policy implementation.Footnote 15 Berry et al. review the consideration of networks in policy implementation, which is of interest in this article as the success of policy often hinges on the participation of all of the parties in the process.Footnote 16 The network approach to public policy implementation research suits the regulatory process as regulators at various levels, firms, and the courts are ultimately involved in the regulatory process. Insight from the general policy implementation literature and the network approach to the examination of policy implementation is applied through the remainder of this article to examine regulatory interpretation.
3 The challenge of regulatory interpretation
Consider the three primary participants in the regulatory process: the regulator, the regulated firm, and the court. A simple model by Glaeser and Shleifer highlights the interaction between these three parties.Footnote 17 Glaeser and Shleifer model the interaction between a regulator and firms in which the firm's production creates some type of harmful byproduct. The regulator must decide whether to verify that a firm has violated a regulation and determine whether to prosecute, which depends on the costs of enforcing the regulation by proving that a firm violated a ruling in court. Other parties such as competitors, customers, or other private citizens may also assist the regulator by identifying and reporting violations. The regulated firm must decide whether to continue to operate given the potential for penalties, as well as if they will cooperate with the regulatory ruling in general. Finally, the court is ultimately responsible regarding the prosecution of a firm for violating a regulatory ruling and must make a final ruling on whether the firm violated the regulation.
While Glaeser and Shleifer employ the model to examine when quantity restrictions are preferable to a tax policy to limit damage for a given harmful action, the interaction between the various parties involved highlights the crucial importance of regulatory interpretation. Each of the parties involved must interpret the regulation, which may be straightforward or challenging depending on numerous factors. It is important to note that most regulatory interpretation involves the regulators at various levels of the regulatory process and the regulated parties. The courts only become involved in the process when the regulator decides that criminal or civil prosecution is necessary, there is a disagreement between the regulator and a regulated party, or the regulated party decides to employ the legal system to challenge a regulatory ruling. The remainder of this section discusses the issue of regulatory interpretation as it pertains to the three primary parties involved in regulation. The potential difficulties surrounding the issue of regulatory interpretation can be better understood when considering the potential impact on the network of parties involved in the regulatory process.
3.1 The regulator
While it is often assumed that regulators simply ensure that regulated parties abide by the regulation that they are responsible for enforcing, many issues are more challenging in reality. Regulators are often in charge of designing, implementing, and enforcing regulation that is the result of legislation or executive orders. Regulators must interpret congressional mandates and orders from authorities to develop and implement regulations. Other times, regulators are given more discretion in accomplishing specific regulatory goals and can issue regulations as well. Regulators must accomplish these tasks with the budget and resources available to them. The total annual regulatory budget for seventy-five U.S. federal regulatory agencies from 2000–14 is displayed in figure 1. The visual is created utilizing data provided by Dudley and Warren (Reference Dudley and Warren2013) that examines the budget of seventy-five regulatory agencies, including separate annual budgets for social and economic regulation. While regulatory budgets have grown over time in real terms, the responsibilities of regulators have increased as well. In addition to using resources to implement and enforce regulation across agencies, it is likely that regulators devote additional time and resources to the interpretation of regulation and in assisting regulated parties in interpreting regulation.
Federal Regulatory Budgets, 2000–14 (billions of dollars)

O'Toole Jr. and Saetren provide descriptions of the public policy implementation literature that assists in the application of regulation, but regulatory interpretation does not end once policy from a regulatory ruling is implemented.Footnote 18 Once a regulatory ruling is designed and implemented, regulators must apply the ruling in an environment that is constantly in flux. As noted in Crew and Kleindorfer, constant changes in technology in recent years have resulted in challenges for regulators.Footnote 19 Additionally, regulated parties and other parties impacted by the regulatory process may change their behavior as the result of a regulatory ruling or for other reasons including changes in the political environment, agency turnover, and culture changes. Regulators are often forced to apply a regulatory ruling in a changing environment that may appear quite different from the environment at the time the regulation was designed.
3.2 Regulated parties
Firms must interpret regulations to operate in accordance with the law and avoid penalty. While compliance may be straightforward under some regulations, understanding and complying with regulatory rulings can be a challenge in other instances. Many firms employ chief compliance officers and other compliance staff to assist in the navigation of regulatory issues. Regulators offer materials and assistance in many cases to support interpretation of regulation and compliance. Firms may also rely on consultants and other assistance. However, firms ultimately must make decisions under uncertainty in many cases. Firms may need to devote time and resources to anticipate and adapt to industry regulation and regulators. The Office of Management and Budget estimates the annual costs of federal regulation to be between $68.5 billion and $101.8 billion, although these costs only cover major regulations instituted between 2003 and 2013 and the costs are estimated by the regulatory agencies responsible for the major regulations.Footnote 20 However, firms undoubtedly experience costs related to the ongoing interpretation of regulation, which may often fall outside the traditional scope of costs considered regarding regulation.
While regulatory requirements are generally assumed to be communicated to firms through regulatory rulings and by the regulators, numerous variables can make it challenging for firms to interpret regulations in the same context as the regulators. Firms face some similar challenges to regulators in interpreting new regulations, adjusting to changes in regulation and regulatory interpretation, and properly interpreting and complying with regulations in a changing environment. The leadership and culture within a regulatory agency impacts the interpretation and enforcement of regulation and firms must often coordinate with regulatory agencies to properly interpret regulations. However, changes in political offices, agency leadership changes, and employee turnover do occur, which can change the culture and institutional knowledge of a regulatory agency. Some regulatory leaders and employees may take a consultative approach to regulatory interpretation while others may opt to approach regulatory rulings in a strict enforcement fashion. These changes can alter the regulatory interpretation and expectations of the regulatory agency, which ultimately impact the firm's ability to plan, react, and anticipate future changes. Further, in some instances the same firm can be subject to multiple regulations from multiple agencies. In many industries, such as healthcare, it is not uncommon for multiple agencies to be involved in the regulation of various elements of the firm's activities. The regulation and regulatory interpretations may differ across the regulatory agencies, resulting in challenges for the firm regarding multiple interpretations and the potential for conflicting regulation.
3.3 The courts
The court system is ultimately responsible for interpreting regulations as well when regulatory issues result in court cases. While regulators often rely on administrative actions to enforce regulations, regulators may choose to utilize criminal or civil prosecution depending on the intent and severity of a regulatory violation. Additionally, challenges from regulated parties regarding the interpretation and legitimacy of a regulatory design, as well as challenges to the uniformity of regulatory enforcement, may force courts to interpret regulations. When a third party is added into the regulatory process, the potential for interpretation challenges increase further.
Regulatory court cases have increased in recent years according to the caseload statistics from the Administrative Office of the U.S. Courts. Figure 2 displays the number of annual regulatory court cases in U.S. District Courts from 2000–11.Footnote 21 The data highlight incidences of regulatory interpretation in the court system. Further, Randolph and Fetzner highlight the link between regulations and the courts, finding that the growth of regulation in the United States at the federal level throughout the beginning of the twenty-first century has resulted in an increase in regulatory court cases.Footnote 22 It is important to note that while regulatory court cases have increased in recent years, the vast majority of regulatory interpretation occurs within the regulatory agencies and firms involved in the process, as court cases occur only when regulators or the regulated parties invoke the courts. Additionally, the growth in regulatory court cases does not necessarily indicate problems with regulatory schemes or the courts, but does highlight the fact that courts are ultimately responsible for interpreting regulations.
U.S. District Regulatory Court Cases Commenced, 2000–11

Several recent works in the law literature address regulatory interpretation in the courts and offer suggestions to assist in the interpretation of regulation. Stack highlights the issue of regulatory interpretation within the courts, suggesting that courts look to the statement of purpose from a regulatory ruling and interpret regulations based on the original intent of the regulation in question.Footnote 23 Georgosouli argues that courts should interpret regulations in a constructive method, which involves the courts interpreting a regulation from the written law in a way that best justifies the intent of regulation.Footnote 24 This contrasts with a conversational method in which the court considers the way in which all parties involved in the regulatory process interpret a regulatory ruling. However, regulatory interpretation would remain difficult in many instances even under standard practices in the court system due to the complicated nature of some regulations. Further, allowing for diversity in the interpretation of law can potentially increase the accuracy of law by incorporating additional information into adjudication.Footnote 25 Additional research contends that the efficiency of legal developments depends on the constraints and incentives that judges face, noting that the reliance on the legal precedence of previous legal rulings as a binding constraint can reduce efficiency.Footnote 26 This finding also implies that diversity in legal interpretation can be beneficial in the development of law.
4 A framework for regulatory interpretation
The extent to which regulatory interpretation presents challenges varies widely across regulatory rulings and depends on a multitude of factors. While it is difficult to identify every factor that impacts regulatory interpretation, many factors can generally be categorized under either regulatory complexity or the complexity of the environment in which a regulation is developed and applied. In order to assist researchers and policymakers in identifying both the sources of regulatory complexity and the potential overall regulatory interpretation complications associated with a given regulation, we propose a framework that utilizes the measurement of both regulatory complexity and environmental complexity to approximate the expected overall degree of regulatory interpretation challenges associated with a regulatory ruling.
Regulatory complexity is the first dimension to consider regarding regulatory interpretation challenges, which involves the clarity, precision, and certainty of the regulation as it is written. Regulations that clearly state an objective, to whom the objective applies, and the requirements of the regulation are most likely to result in consistent interpretation. In order to minimize the complexity associated with a written regulation, the regulation ideally would be concisely drafted to accomplish a specific goal that is measurable using clear criteria. However, this is not always a straightforward task when drafting regulation. The objectives associated with the regulation of some issues may include multiple goals or involve goals related to many activities. Further, the assessment of compliance associated with the regulation may be difficult to communicate and evaluate. Additional challenges may arise when regulators must interpret congressional mandates to draft regulations that satisfy the intent and requirements associated with the acts and rulings that necessitate the creation of regulation.
Several potential measures of regulatory complexity could assist in quantifying the degree of complexity related to written regulation. The length of the written regulation, quantified by a count of words contained within a specific regulation, could provide a rough measure of the complexity associated with a written regulation as additional language could presumably involve additional goals, requirements, and measurements. However, utilizing Al-Ubaydli and McLaughlin's method of quantifying regulation by examining the number of regulatory restrictions included in a written regulation could provide a more accurate evaluation of the complexity of a specific regulation by offering an assessment of the quantity of limitations placed on regulatory parties.Footnote 27 In addition to considering the overall number of restrictions, the restrictions associated with a given regulation could also be compared to a baseline or average number of restrictions for comparison purposes. Other measurements that can potentially assist in quantifying complexity associated with written regulations include the number of goals identified in the regulation, the quantity of issues governed by the regulation, and the number of measurement criteria to be utilized in assessing compliance.Footnote 28
A second category of factors that impact regulatory interpretation concern the environment in which a regulation is applied. This dimension of complexity involves both the regulatory landscape and the general state of the environment in which a regulation is applied. These factors include whether the activity is regulated by multiple parties or subject to multiple regulations, the context in which the regulation is interpreted, the intricacy of the activity being regulated, and the estimated degree to which changes impact the environment over time. The interaction of regulations with previous regulatory rulings issued by the regulatory agency in charge or rulings from other regulatory agencies may further complicate interpretation due to the regulatory environment. When one regulatory body is responsible for the regulation of a straightforward activity by specific parties within a setting that is unlikely to change substantially, the complexity associated with the regulatory environment is generally likely to be low. However, the environment in which regulations are applied may involve complicated activities that are likely to change substantially over time and be subject to regulation from multiple parties.
The measurement of the complexity of regulation associated with the environment is perhaps more challenging than analyzing the complexity of written regulations. Nevertheless, several measures exist to assist in the quantification of environmental complexity. The cumulative number of restrictions as identified by Al-Ubaydli and McLaughlin that apply to a given industry could provide a sense of the overall level of regulation for an industry, which could be compared to other industries.Footnote 29 The number of regulatory bodies responsible for the regulation of a specific activity could be considered as well. While the relative complexity of a given industry or activity is difficult to assess, industry-related measures like labor productivity could serve as a rough proxy for the rate of technological change for regulatory environments related to specific industries. Technological change is a primary driver of labor productivity, although a number of other factors including changes in efficiency associated with resource usage and the quantity of resources deployed impact labor productivity as well.Footnote 30 Size of the industry (measured as a percentage of GDP) could also provide insight into the scope of the issue to be regulated, with larger shares of the economy potentially associated with greater potential for complications related to regulation. The number of firms, quantity of new entrants into an industry, and the number of patents associated with an industry could also provide a rough sense of the scale of change in a given industry when compared to industry averages. Complexity associated with industries could also potentially be quantified using an assessment of the information required to describe the specific industry or activity similar to research quantifying manufacturing complexity in the operational strategy literature, although the strategy could be difficult for service industries.Footnote 31
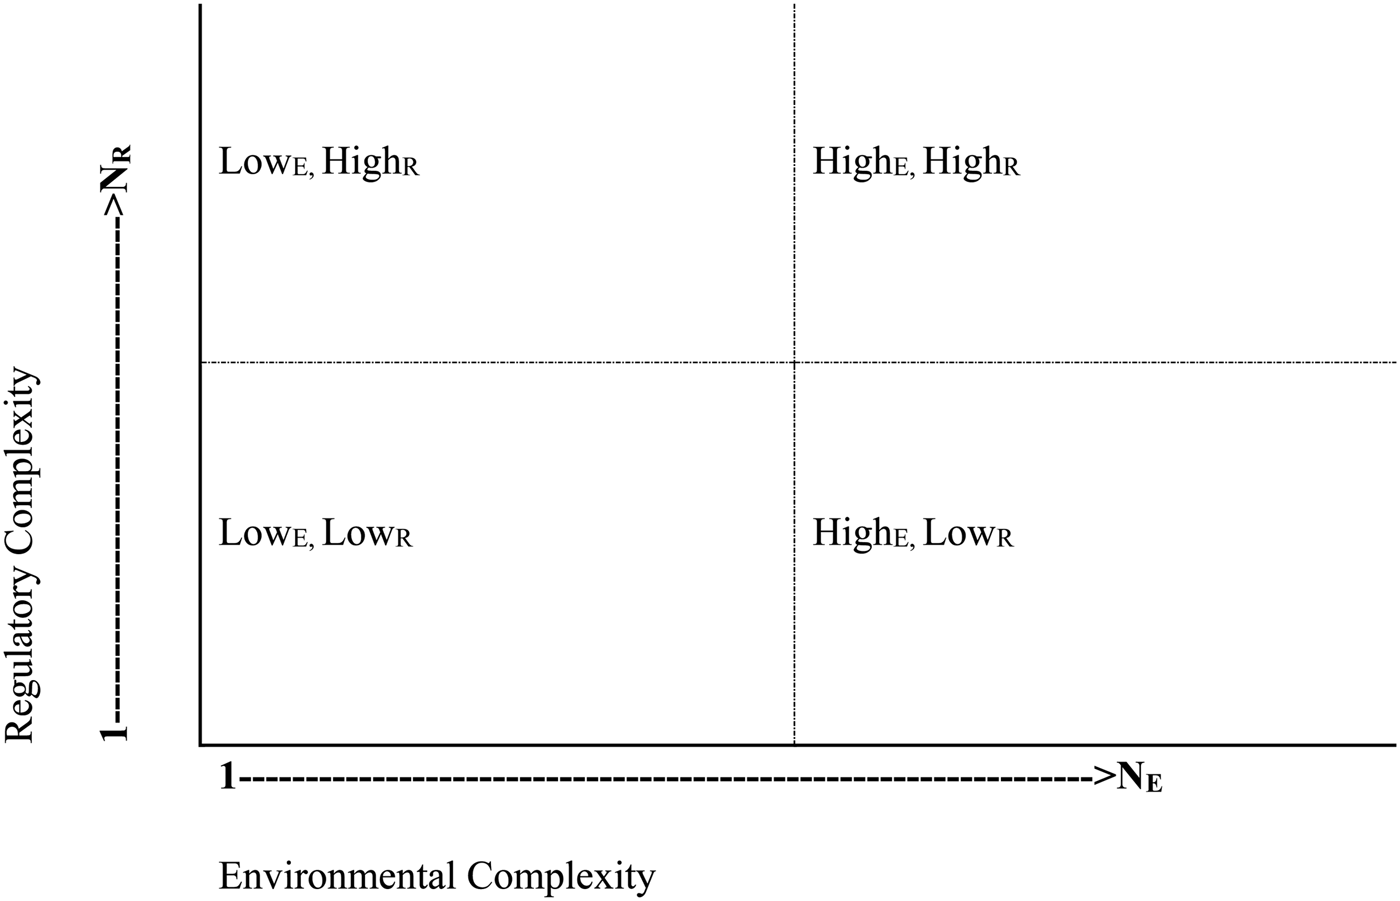
In order to visualize the challenges associated with regulatory interpretation, consider the regulatory interpretation framework presented in figure 3. The regulatory interpretation matrix helps to highlight the types of regulations that are likely to result in multiple interpretations. Regulations that can be interpreted with relative certainty across parties are likely to result in a minimal number of regulatory interpretations. On the other hand, high complexity regulations that are applied in a relatively complex environment are likely to result in numerous interpretations due to the uncertainty surrounding regulatory interpretation. Using the measurement tools outlined above for both regulatory complexity and environmental complexity, the overall estimated complexity associated with a given regulation can approximated utilizing the regulatory interpretation matrix. Figure 3 shows that one common interpretation may result when both the regulation and the regulatory environment are straightforward, but that many potential interpretations may result when the regulation and the regulatory environment are complex. The regulatory interpretation matrix considers both regulatory complexity and environmental complexity at a given point in time. This provides an opportunity to assess the likely number of interpretations that could foreseeably occur in the future. However, environmental changes including technological advances and changes in the context in which regulations are interpreted could effectively shift the degree of known environmental complexity for a given regulation over time.
Regulatory Interpretation Matrix

In figure 3, NR represents the potential number of regulatory interpretations for a given regulatory ruling due to regulatory complexity while NE represents the possible number of regulatory interpretations for a given regulatory ruling due to the complexity of the environment in which the regulation is developed and applied. The number of potential interpretations ranges from 1 to (NE x NR), depending on the known complexity of both the regulation and the regulatory environment at a given point in time. Low complexity regulations applied in a relatively simple environment are displayed in the (LowE, LowR) quadrant. These types of regulations are more likely to result in a minimal number of regulatory interpretations. On the other hand, high complexity regulations that are applied in a relatively complex environment are likely to result in numerous interpretations, as indicated in the (HighE, HighR) quadrant. The (HighE, LowR) quadrant displays low complexity regulations applied in a highly complex environment while the (LowE, HighR) quadrant contains highly complex regulations applied in a low complexity environment.
Figure 3 provides insight regarding the potential regulatory interpretation challenges associated with a given regulatory ruling. Regulations can generally be classified into one of the four categories presented in figure 3 using the measurement criteria provided for regulatory and environmental complexity at a given point in time. Consider a regulation that that requires a type of business within a community to close at a specific time. The complexity associated with the written regulation is low as there is one goal and one clear method to evaluate compliance. Additionally, complexity in the environment is low since the activity is not subject to multiple regulations or regulatory parties and the information required to describe the activity is minimal. This example involves a low level of regulatory complexity and relatively straightforward environment, which is identified as the (LowE, LowR) quadrant in figure 3. There are minimal ways in which these regulations can be interpreted as the requirements of the regulation are clear and the environment is relatively uncomplicated. The regulatory ruling is probable to result in a common understanding of the regulatory requirements across all parties involved. While disputes may still arise and regulatory enforcement may be required, regulatory interpretation is unlikely to result in a significant challenge for regulators, firms, or the courts. It is worth noting that a given regulation could reside in a relatively low complexity environment at a given point in time but shift to a higher complexity environment over time. However, some regulatory environments are unexpected to change dramatically over time.
Regulatory interpretation is more likely to result in challenges in the other three categories displayed in figure 3. Regulations that are relatively complex in nature but generally applied in environments that are comparatively simple at a given point in time can create interpretation challenges primarily due to the complexity of the regulation, as identified in the (LowE, HighR) quadrant. Some of the requirements under the Wild Bird Conservation Act of 1992 may qualify as a high complexity regulation with a relatively low complexity environment.Footnote 32 The regulation stipulates that birds can be imported into the United States if the U.S. Fish and Wildlife Service determine that importation of the bird is biologically sustainable, not harmful to the species survival in the wild, and the bird is exported from a country that meets the requirements mandated by the Convention on International Trade in Endangered Species.Footnote 33 The act addresses the import of numerous distinct species that are subject to change and includes multiple criteria utilized to determine whether a bird can be imported. A total of thirty-eight regulatory restriction terms appear the actual language of the document. On the other hand, the environment is relative uncomplex as the activity is mostly regulated by a single agency and the regulated activity is straightforward. The application of the regulation ultimately applies specifically to the importation of birds, but the interpretation of the written regulation may leave room for multiple interpretations. The number of potential interpretations associated with this type of regulation are limited, but can likely result in multiple interpretations due to the complexity of the regulatory language.
Various regulations can be categorized as simple according to the regulatory requirements but are applied in a complex environment, as displayed in the (HighE, LowR) quadrant in figure 3. Examples may arise under the regulations required by the U.S. Food and Drug Administration.Footnote 34 Many of the regulatory rulings involve language that identifies clear requirements with a single goal, such as regulatory edicts regarding the requirements of a product to attain a specific food or beverage classification. However, requirements may be less certain due to numerous factors in the environment including technological advancements, the introduction of new products, related and sometimes conflicting health and safety regulations, and continuous shifts in consumer preferences and cultural attitudes towards food, drinks, dietary supplements, and drugs. The industry is subject to numerous regulations that have accumulated over time.Footnote 35 Due to these issues and a multitude of other factors in the environment in which the FDA regulations are applied, these types of regulations may generate multiple interpretations. While the interpretations are limited by the scope of the language in the regulation, the complex regulatory environment can result in challenges associated with regulatory interpretation.
Additionally, challenges related to the application of relatively low complexity regulations in a high complexity environment can arise when multiple regulations apply to a specific issue and/or when the parties involved in the regulatory process change. Health care services are often subject to regulations at the federal level and through other regulatory agencies at the state level. The combination of being regulated by multiple parties and the impact of regulatory accumulation over time contribute to complexity in the environment in which a regulation is applied. One specific example involves the federal regulatory requirements implemented by the Center for Medicare & Medicaid Services (CMS) regarding Medicare reimbursement. CMS requires a physician signature before a firm bills Medicare for any plan of treatment for home health services.Footnote 36 However, the state of Pennsylvania technically requires a physician signature be obtained within seven days of the beginning of the plan of treatment.Footnote 37
The Pennsylvania state requirement had always been actively interpreted as a standard that did not need to be complied with if one met the Medicare rules of participation as the timeline of the federal and state regulations generate very different interpretations of how the regulated firm is to act in order to comply. This was the interpretation for decades in Pennsylvania, until a change in state administration lead to a change in leadership at the Department of Health within the state. The new leadership required firms to comply with the state rule regarding physician signatures, which placed all previous reimbursements in violation of the state regulation and potentially subject to reclamation.Footnote 38 The change in regulatory interpretation occurred due to the turnover in leadership and a change in the culture of a regulatory agency. The complexity of the environment being regulated provided an interpretation challenge even though each individual regulation (state or federal) was designed with a singular goal and clear assessment process to confirm compliance. Further challenges may result when a given regulation interacts with another regulation issued by the governing regulatory body or regulations issued by other regulatory agencies. These types of environmental complexity challenges are more likely when multiple bodies are involved in the regulation of an activity. While it is difficult to predict the specific way in which these types of regulations will result in regulatory interpretation challenges, the known complexity of the environment suggests that regulatory challenges are likely to occur.
The greatest regulatory interpretation challenges are likely to arise when both the regulation and the environment are complex, identified in the (HighE, HighR) quadrant of figure 3. Many regulations that apply to the finance industry are likely to fit into this category. Portions of the Dodd-Frank Wall Street Reform and Consumer Protection Act serve as an example of a complex regulation applied in a complex environment.Footnote 39 The complexities of the written regulatory requirements are highlighted by the challenges in writing the regulations, which are a work in progress years after the passage of the original act.Footnote 40 While the time to complete a written regulation depends on factors like regulatory workload in addition to complexity, the number of goals and multiple criteria required to assess regulatory compliance contribute to the complexity of written regulations related to banking and financial services.
The financial industry can also be classified as a complex environment due both the intricacy of the overall regulatory environment in the industry and the general complexity of the financial industry. The financial industry is subject to a relatively high degree of regulation that accumulates over time. For example, the number of new regulatory restrictions imposed on the finance and insurance industry was almost double the industry average for 2014.Footnote 41 The financial industry also contributes a significant share of the U.S. economy, with finance, insurance and real estate accounting for approximately twenty percent of gross domestic product in 2015.Footnote 42 Further, the information required to describe the financial sector is substantial as well.
Section 619 of the Wall Street Reform and Consumer Protection Act, known as the Volcker Rule, highlights the challenge of a complex environment in addition to the challenge of a complex regulation. Broadly speaking, the Volcker Rule prohibits banks that accept deposits from engaging in proprietary trading. However, many analysts note that it can be extremely difficult to differentiate between bank activities that benefit customers from those activities that explicitly profit the bank.Footnote 43 This combination of complex regulations applied in a complex environment is the most likely situation to result in regulatory interpretation challenges. The Dodd-Frank Act also highlights a situation where regulators face challenges in interpreting congressional mandates to construct regulations, which is yet another potential source of challenges for regulatory interpretation. The size, scope, and complexity associated with the Dodd-Frank Act created challenges for regulators regarding the interpretation and implementation of the requirements necessitated by the act.Footnote 44
5 Implications for regulatory theory and practice
Support for regulatory reform has emerged in recent decades, although preferences regarding regulatory reform vary across parties. Sunstein notes that presidents in the United States over the past three decades have somewhat agreed on broad elements of three key areas of reform, which include an analysis of costs and benefits for major proposed regulations, engagement through public comments before major regulations are enacted, and some form of retrospective review of regulations.Footnote 45 Regulatory reform is a topic of interest for U.S. presidents and Congress, as evidenced by recent presidential executive orders and bills proposed in Congress. Former President Barack Obama signed Executive Orders 13563, 13579, and 13610, which included orders regarding retrospective regulatory review.Footnote 46 In the spring of 2017, two bills that address regulatory analysis and regulatory review were introduced in Congress.Footnote 47
Given the current efforts surrounding regulatory reform, this section reviews three relatively recent reforms that have potential to assist in the regulatory interpretation challenges described in the previous sections of this paper and offers an assessment of the implications associated with the regulatory framework outlined in this manuscript. The reforms assessed in this section include requirements regarding the language utilized in drafting regulations, public comment related to regulation, and retrospective review of regulation. While it is difficult to completely assess the efficacy of reforms as numerous factors impact regulatory outcomes and there are many criteria that can be used to evaluate regulatory effectiveness, available evidence regarding the potential benefits associated with each of the reforms are useful in considering potential methods that can be used to address challenges associated with regulatory interpretation.
5.1 Plain writing in regulation
In order for regulators, firms, and the courts to interpret regulations, the language utilized to construct regulations must be understandable. This desire for comprehensible language resulted in the adoption of the Plain Writing Act of 2010. The act effectively requires government agencies to use plain writing in the development of documents and train employees to utilize language that is understandable. The act was a response to many documents prepared by government agencies that were difficult for individuals and firms to understand due to the use of technical and sometimes confusing language.
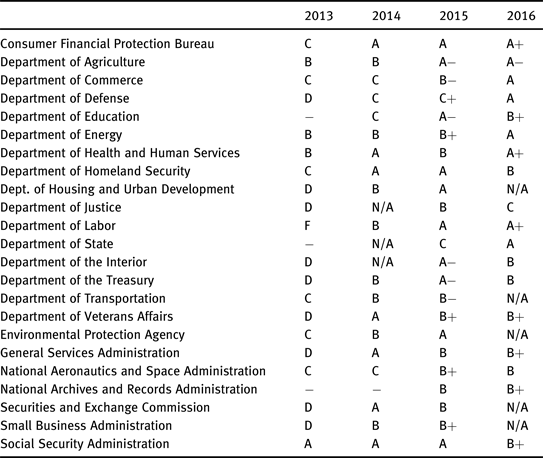
While it is difficult to completely assess the impact of this act, the Center for Plain Language Center attempts to analyze the language utilized by regulatory agencies on an annual basis.Footnote 48 The organization encourages agencies to submit writing samples for analysis on an annual basis. The Center for Plain Language then analyzes the samples to assess both agency adherence to the act and the readability of the documents. Grades are assigned to each agency that submits writing samples. A summary of grades for agencies is included in appendix table 1. The table specifically reports on the readability of documents for agencies across time. While some agencies declined to submit samples in recent years, grades assigned by The Center for Plain Language have improved in the years since the enactment of the Plain Language Act of 2010. While this does not guarantee that regulations are easy to interpret, the improvement in readability suggests that the passage of an act requiring clear language assisted in improving communication regarding regulation.
5.2 Public comment
The concept of accepting public comment regarding the issuance of new regulations and major changes in regulations has long been a part of the rulemaking process.Footnote 49 Public comment is theoretically desirable as it affords the public an opportunity to participate in the rulemaking process and offers an opportunity for agencies to gain valuable feedback. While the concept of public comment is a relatively established process, it is difficult to completely assess the impact of public comments on regulatory efficiency and effectiveness.
Recent research regarding proposed rules from the Department of Transportation has identified early commenters for newly proposed rules as having a significant impact on both the content of regulations that are issued and in halting the progress of regulatory rulings that conflict with the interests of early commenters.Footnote 50 Furthermore, recent research finds that federal agencies are more likely to alter their proposed regulations when a large number of comments are received for regulations that are relatively complicated and rulings that lack political divisiveness in a review of proposed rules from the Department of Health and Human Services.Footnote 51 While this research suggests that the public comment requirements do impact the outcome of proposed regulatory rulings, it is important to note that public comment historically ends when a regulation is formally codified. However, Executive Order 13610 invites public comment regarding existing regulations.Footnote 52 While this relatively new public comment opportunity has yet to be critically analyzed, it affords interested parties with an opportunity to comment on regulations at any point in time.
5.3 Retrospective regulatory review
The retrospective review of existing regulations was highlighted in recent Executive Orders 13563, 13579, and 13610.Footnote 53 In light of Executive Order 13563 issued in 2011, federal agencies were required to submit preliminary plans for retrospective review in just four months from the issuance of the order.Footnote 54 Sunstein notes that this initial retrospective analysis of existing regulations resulted in twenty-six plans from agencies and encompassed 580 changes to existing regulations. While subsequent executive orders encouraged additional retrospective reviews, this initial push highlights changes that were suggested as the result of a simple requirement to review outdated existing regulations.
5.4 Broad implications
The consideration of regulatory interpretation combined with the analysis of recent regulatory reforms results in several implications regarding regulatory theory and the use of regulation in practice. Regulatory capture, information problems, and regulatory enforcement strategies are well-known in the regulatory literature, but regulatory interpretation involves numerous additional challenges for all parties involved in the regulatory process. Regulators, firms, and the courts must ultimately be able to interpret regulations and adjust to regulatory environment changes for regulation to best achieve the intended outcome of the regulation.
When considering the application of regulation as a policy tool, policymakers should recognize that greater levels of regulation increase the complexity of the environment being regulated and correspondingly lead to more regulatory interpretation challenges. While this does not imply that regulation should be avoided, it does suggest that policymakers and regulators should consider the long-term impact on environmental complexity that additional regulation can have and thereby seek to limit the number of regulatory interpretations that may arise across the parties in the regulatory network to the extent possible when designing regulation. Special consideration should be given to complex regulations and intricate regulatory environments to minimize the interpretation challenges that are likely to result throughout the regulatory network. While this consideration entails increased effort in the analysis of the design phase of the regulatory process, it is likely to create greater efficiency in, and efficacy of, the implemented regulation.
Policymakers should seek to design regulatory mandates that clearly state objectives so that regulators can interpret mandates to design and implement regulation. The improvement in the readability of regulations across many regulatory agencies with the adoption of the Plain Writing Act of 2010 suggests that the clarity surrounding the writing of regulations can be improved when agencies are required to clearly state objectives.Footnote 55 Additionally, continuous attention to, and management of, regulatory interpretations once a regulation is applied in a complex and evolving environment should be considered to further improve regulatory interpretation. The public policy implementation literature can provide some guidance for policymakers in terms of strategies to implement regulatory measures, but innovations will be required to address complexity in practice.Footnote 56 In addition to recognizing the insights that existing research strategies can provide, regulators and policymakers should seek to implement processes to address regulatory interpretation challenges throughout the regulatory network.
Regulatory interpretation and the evolution of each individual regulation and its associated environment over time significantly impact regulators, firms, and entrepreneurs. Firms and entrepreneurs expend a great deal of time and resources to interpret, comply with, and anticipate changes in regulations and the regulatory environment. All regulated parties must determine the requirements necessitated by a regulatory ruling and how the regulator will interpret and enforce the regulatory ruling. Progress in addressing the challenges outlined in this paper will likely require improvements in regulatory development mechanisms that can reduce the amount of uncertainty surrounding regulatory interpretation over time. Enhanced retrospective reviews of regulation and the provision of feedback by regulated firms throughout the regulatory implementation process could assist regulators and regulated parties in the interpretation of regulation. While the research discussed in the previous section of this paper suggests that public comment does impact regulatory outcomes, public comments have traditionally been limited to the timeframe before a regulation is adopted. Recent requirements in Executive Order 13610 offer an opportunity to invite public comment during retrospective regulatory review periods and at any other point in time.Footnote 57
Additionally, while regulators generally can incorporate changing regulatory interpretations as they evolve over time into formal law, new interpretations are not generally codified into formal laws. The adoption of methods to encourage or require regulators to formalize regulatory interpretations into formal law could improve the ability of entrepreneurs to operate in a regulated society, although no simple methods exist to accomplish this task. An adjustment to the current Administrative Procedure Act could potentially improve understanding across parties by requiring agencies to codify any new interpretations as interpretative rules.Footnote 58
An increased focus on performance standards as the mechanism to accomplish regulatory goals could be explored given the challenges that regulators face in applying regulatory rulings in changing environments. The Federal Government has already recognized performance standards as preferable to regulating behavior, as evidenced in the requirements in Executive Order 13563.Footnote 59 However, additional research into the effectiveness of performance standards relative to other regulatory methods would be valuable.Footnote 60 Private regulatory schemes may be able to complement public regulation in addressing economic and social challenges in certain situations, but the limited conditions under which private regulation is likely to succeed suggests that public regulation will remain the primary method.Footnote 61
Furthermore, regulatory theory should acknowledge the potential challenges of regulatory interpretation and consider the entire network of parties involved in the regulatory process, particularly when regulations and/or the regulatory environment are complex. Regulation provides an avenue for policymakers to address social and economic problems when private ordering and the courts are ineffective. Shleifer notes that regulation is particularly appealing when the courts are biased, when legal rulings are unpredictable, or when some parties have more power than others through the legal system.Footnote 62 When this is the case, contracts interpreted by courts may not solve problems as the interpretation of contracts within the court system may be biased or uncertain. However, it is important to recognize the entire network of parties involved in the regulatory process. In addition to interpretation by regulators and firms, regulation is also subject to interpretation by the courts when regulators decide to prosecute or a regulation is challenged. A better and more thorough understanding of how a regulation and its associated environment has evolved over time, as well as the associated impact on past and future regulatory interpretation, will assist the courts in efficiently and justly resolving regulatory disputes.
Regulation remains the preferred policy option in many cases. However, much of the potential benefits of regulation is diminished if the parties involved in the regulatory process are unable to consistently interpret and apply regulations. In the development of future regulatory theory, regulatory research should attempt to design systems to address the interpretation challenges that are likely to arise due to complexity in the regulation or regulatory environment. This task is particularly difficult as the challenges are often unknown at the time at which the regulation is designed and initially implemented, but acknowledging the complexity of the environment throughout the regulatory process could assist in addressing regulatory interpretation challenges in practice.
6 Conclusion
Regulatory interpretation is an important component of the regulatory process that impacts regulators, firms, and the courts. Complex regulations applied in a complex environment are likely to create ongoing interpretation challenges for all parties involved in the regulatory process. Additionally, as the volume of regulation increases, these challenges are likely to increase as the regulated environment increases in complexity. Regulators, firms, and courts currently employ substantial time and resources to the interpretation of regulation. Without further research and associated improvements such as the ones outlined in this paper, these costs are likely to grow in the future while the challenges of regulatory interpretation remain. Recognizing and addressing regulatory interpretation is a challenging, but potentially rewarding, task for policymakers. Improvements in the function of regulatory systems can better achieve the aims of regulation, promote productive entrepreneurial activity, and free resources to devote to more productive uses.
Future research should explore the impact of the complexity of regulations and the complexity of the regulatory environment on the participants in the regulatory process. The development of better ex-ante identification and measurement of both regulatory complexity and environmental complexity could assist policymakers in mitigating regulatory interpretation challenges in the regulatory development phase. Insight into the challenges that regulators, firms, and courts face and the current methods that the parties employ to interpret regulations would assist in understanding the magnitude of the regulatory interpretation challenge and provide guidance regarding processes that could alleviate regulatory interpretation challenges. Additionally, future research should explore regulatory mechanisms that seek to mitigate regulatory interpretation challenges to further promote efficiency in the application of regulation. These mechanisms could include adjustments to the current regulatory framework such as enhanced retrospective regulatory reviews, the codification of regulatory interpretations into formal rule, and alternative regulatory interpretation management mechanisms.
Appendix
Federal Plain Language Report Card Grades Across Federal Agencies