Introduction
Airborne particulate matter (PM) resulting from marine transport represents a significant environmental challenge with far-reaching implications. Cargo ships are a primary source of PM emissions, sulfur oxides (SOx), nitrogen oxides (NOx), carbon dioxide (CO2), and volatile organic compounds (VOCs). The main sources of these pollutants in seaports include combustion of heavy fuels in cargo ships, loading and unloading operations, heavy vehicle traffic in the port, port machinery and equipment (Wang et al. Reference Wang, Liu, Wang, Chen and Wang2023; Zhang et al. Reference Zhang, Zeng and Wang2024).
Even though seaports are crucial to global trade, their environmental impact is a considerable cause of local air quality, respiratory and cardiovascular health problems in nearby populations, contribution to climate change, acid rain, and damage to ecosystems. Numerous ports are adopting cleaner fuel alternatives, implementing advanced emission reduction technologies, and enforcing more stringent emissions regulations to mitigate these environmental challenges. (González-Rivera et al. Reference González-Rivera, Mugica-Álvarez, Sosa-Echeverría, Sánchez-Álvarez, Magaña Rueda, Vázquez Cruz and Retama2023; Mueller et al. Reference Mueller, Westerby and Nieuwenhuijsen2023; Zhang et al. Reference Zhang, Zeng and Wang2024).
Both PM2.5 and PM10 include carbonaceous aerosols. Total carbon (TC) is typically composed of organic carbon and elemental carbon (black carbon) (Pöschl Reference Pöschl2005). These particles may also have a mixture of heavy metals, sulfates, nitrates, organic, and inorganic carbon. Analysis of 14C in aerosols gives information about the atmospheric particles’ fossil and non-fossil origins. Carbonaceous aerosols emitted by fossil sources do not contain 14C because their carbon has been isolated from the atmosphere for millions of years, during which all 14C has decayed, whereas biogenic aerosols have a 14C signal similar to atmospheric CO2 (Szidat et al. Reference Szidat, Jenk, Gäggeler, Synal, Fisseha, Baltensperger, Kalberer, Samburova, Wacker, Saurer, Schwikowski and Hajdas2004).
Atmospheric aerosol studies aimed at understanding the composition and emission sources in Mexico have been conducted mainly in urban, industrial, and rural areas as well as in areas with critical levels of pollutants (Gómez et al. Reference Gómez, Solís, Chávez, Andrade, Ortiz, Huerta, Aragón, Rodríguez-Ceja, Martínez-Carrillo and Ortiz2016; Solís et al. Reference Solís, Gómez, Ortíz, Chávez, Miranda, Aragón, Martínez-Carrillo, Castro and Peralta2017). In these areas, the analysis of 14C in atmospheric aerosols has been successfully applied to establish the fossil and non-fossil character of the emission sources in Mexico. Expanding its application to determine port activities´ effects on atmospheric pollution would contribute to designing new mitigation and conservation strategies with scientific validation.
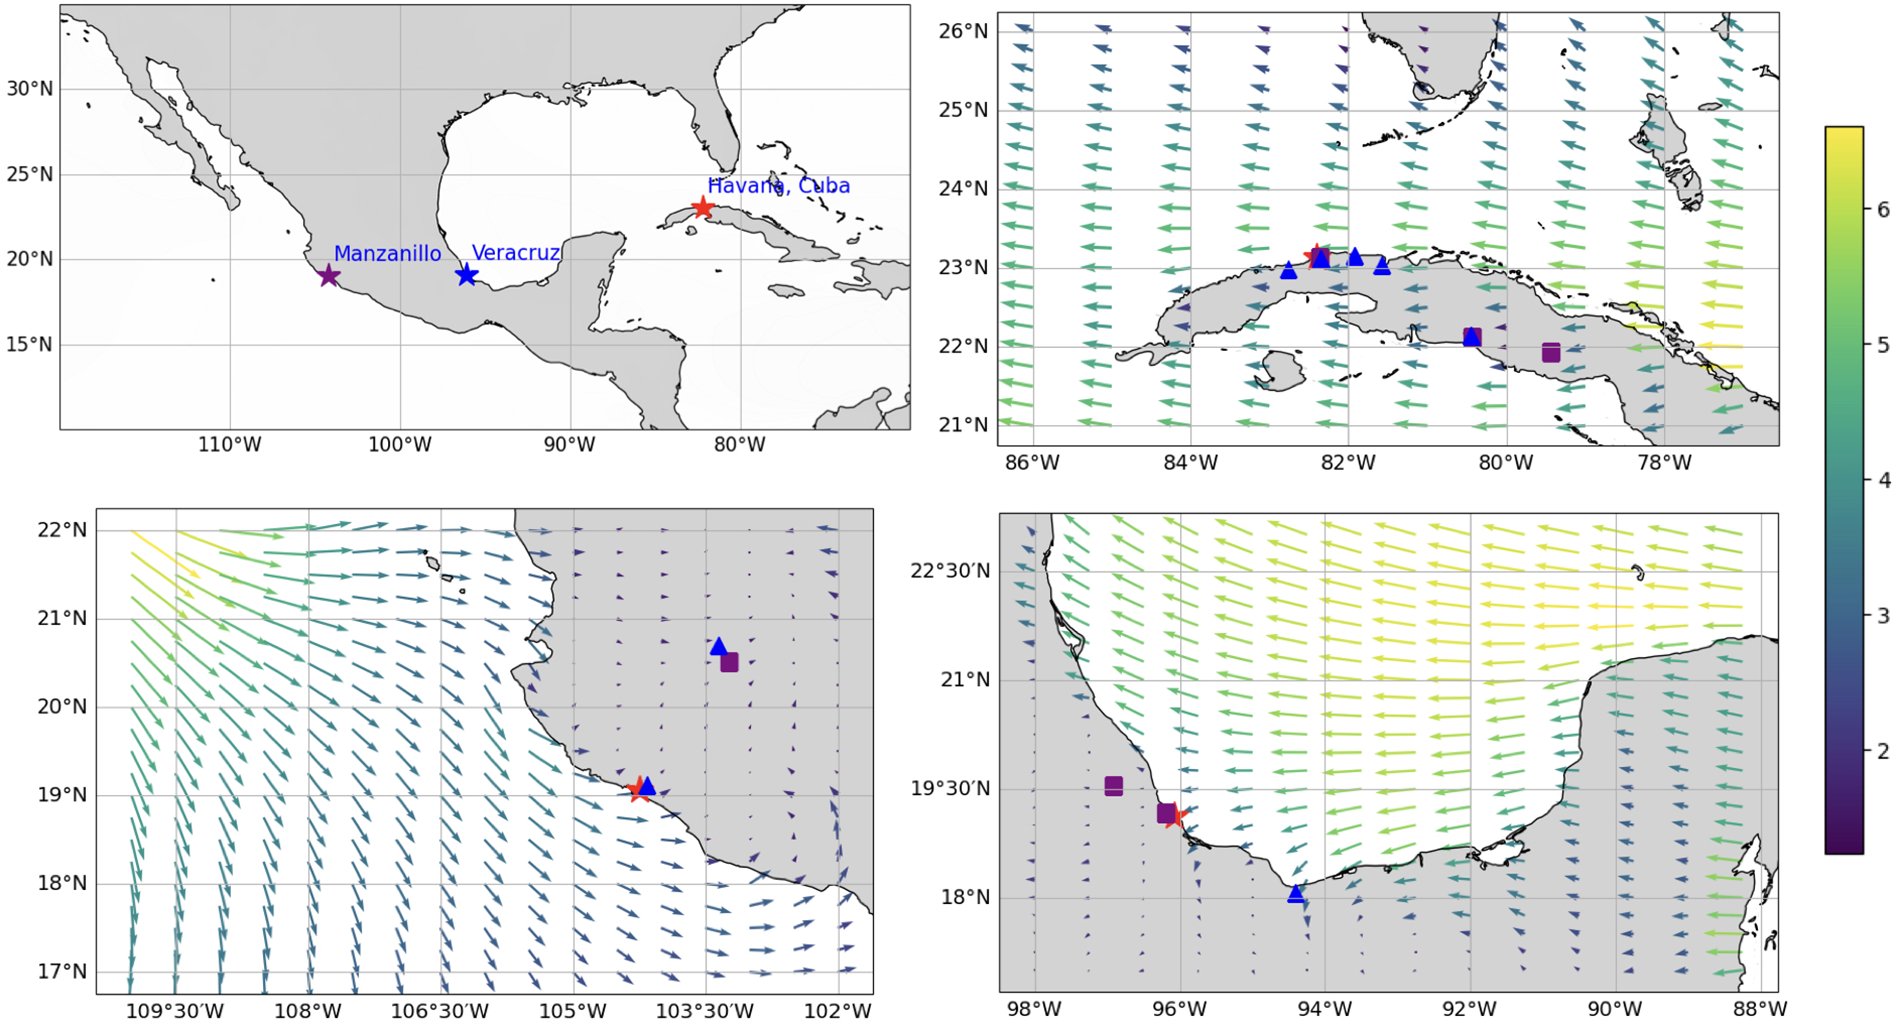
In this work we applied the 14C-AMS analysis in conjunction with the use of receptor models and meteorology to determine the influence of port activities on the fossil component of and PM2.5 aerosols collected at seaports of Veracruz and Manzanillo in Mexico and of PM10 aerosols collected in Havana in Cuba (Figure 1a). The obtained results were compared with previous studies carried out on aerosol filters collected in urban areas of Mexico City and Cuernavaca, in the state of Morelos in Mexico (Chávez Reference Gómez Chávez2020; Solís et al. Reference Solís, Gómez, Ortíz, Chávez, Miranda, Aragón, Martínez-Carrillo, Castro and Peralta2017). The former represents a Megacity (approximately 21.3 million Mexico City metropolitan area in 2012), with higher rates of fossil pollution relative to the latter, a smaller city (approximately 0.37 million in 2012) with lower fossil signature. A greater influence of fossil fuels will result in low amounts of 14C present in aerosols (low F14C values), since fossil fuels are depleted in 14C (F14C=0), while a high biogenic contribution will result in high F14C values close to the atmospheric levels.
a) Location of the study sites: Havana, Cuba (red star), Veracruz, Mexico (blue star), and Manzanillo, Mexico (purple star). b) Mean wind direction and wind speed, refineries (purple squares), and thermoelectric plants (blue triangles) in Havana, Cuba sampling site (red star). c) Wind direction and wind speed climatology near the Manzanillo sampling site. d) wind direction and wind speed at the port of Veracruz, Mexico.

Figure 1. Long description
Panel A: A map showing the locations of study sites with Havana, Cuba marked by a red star, Veracruz, Mexico by a blue star, and Manzanillo, Mexico by a purple star. Panel B: A diagram illustrating mean wind direction and wind speed in Havana, Cuba, with refineries indicated by purple squares and thermoelectric plants by blue triangles. The sampling site is marked by a red star. Panel C: A diagram showing wind direction and wind speed climatology near the Manzanillo sampling site. Panel D: A diagram depicting wind direction and wind speed at the port of Veracruz, Mexico.
Methodology
Study sites
Havana, Cuba: Is in the Western Caribbean Region (23°6′49″N and 82°21′59.73″W). The island, with close to 2 million inhabitants in 2022, extends from Cape San Antonio to Punta Quemado, having 5746 km of coastline, more than 200 bays and 289 beaches. In recent years, economic growth has been driven by the development of the tourism industry, which is positioned as the main source of income for the country. It is closely followed by the sugar industry, the oil sector and tobacco production. The Havana sampling site is influenced by nearby industrial activities, including petroleum refining and thermoelectric generation. The Ñico López refinery is located within the metropolitan area of Havana and represents the most direct local fossil-related point source potentially affecting the site. In addition, two major thermoelectric power plants—Ernesto Guevara (Santa Cruz del Norte) and Antonio Guiteras (Matanzas)—are located east of Havana at distances of less than 85 km (Mapoteca Digital de la Red Cubana de la Ciencia 2021).
Regarding port services, Havana comprises activities covering loading, stowage, unloading, and transshipment of merchandise, which imply significant maritime traffic (ODEPA 2012).
Veracruz, Mexico (19°11′25″N 96°09′12″W) has a population of 406,000 inhabitants and covers an area of 78.82 km2. For 250 years, it was the only entry and exit point for goods between Continental America and Europe. Its main source of income is trade, given its status as an important commercial port. Veracruz is one of the most important ports for oil exports. It is considered the main oil port for the products; it distributes crude oil, petroleum products and petrochemicals (Fuentes-García et al. Reference Fuentes-García, Baldasano Recio, Sosa Echeverría, Hernández, Zamora Vargas, Antonio Durán and Kahl2021). The port facilities of Veracruz have an anchorage area of 900 hectares. The main function is to receive fuels distributed in the area. In addition, tourism plays a significant role, especially during the Veracruz Carnival, considered the most important in Mexico. Other relevant economic activities include the automotive, steel and fishing industries. (Cortéz-Huerta et al. Reference Cortéz-Huerta, Echeverria, Garcia, Duran, Alvarez, Magana and Retama2023).
Manzanillo (19°06′39″N, 104°19′40″W), is in the state of Colima. It stands out as one of the main economic centers in this area. The city and port of Manzanillo have a population of 159,853 inhabitants, according to the XIV Census of the INEGI (ASIPONA 2024). Its role in the import of products from Asia is especially notable, as it manages approximately half of the containerized cargo imported into the region (DIGAOHM 2024a). In 2022, Manzanillo ranked first in cargo handling, covering general cargo, bulk, oil and its derivatives, registering a total of 34.4 million tons. This result surpassed the port of Veracruz, in second place, by 0.5% (DIGAOHM 2024b).
Aerosol sampling and 14 C-AMS analysis
A high-volume PM2.5 and PM10 sampler was used with a flow rate of 1000 L/min, with Pallflex 2500 quartz filters (QAT-UP; Pall Sciences, Ann Arbor, MI, USA). Filters were baked at 600 °C for 6 hours, weighed, wrapped in aluminum foil, and stored in plastic bags until sampling. PM2.5 aerosol samples were also collected using a portable MiniVol TAS 5.0 air sampler (Airmetrics, USA), which operates at an airflow rate of 5 L min–1, on Teflon or polycarbonate filters. These filters were subjected to a constant temperature and pressure for 24 hours prior to their use. In all cases, a blank sample was prepared using quartz filters and a blank sample for Teflon filters. The quartz filters were preserved in aluminum foil, while the Teflon filters were stored in petri dishes; both were kept at 4 °C before and after collection. The Teflon filters were used for elemental analysis by XRF, and the quartz filters were used to determine 14C. In Havana, PM10 sampling on quartz filters was conducted on the roof of a building in the city´s central area, from April 8 to May 22, 2022. In Veracruz, PM2.5 samples were collected on Teflon and quartz filters daily from May 23 to June 7, 2023, on the roof of a building, 900 m from the port of Veracruz. In Manzanillo, PM2.5 samples were collected every 24 hr on Teflon filters and every 48 hr on quartz filters at a height of 20 m. The conversion of carbon contained in the aerosol filters to graphite was carried out in an automated graphitization equipment (AGE 3 Ion Plus). Several punches were taken from each quartz filter, with an equivalent to 150–300 μg of carbon and combusted at 950 °C in the elemental analyzer of AGE 3. The resulting CO2 was transferred to the reactors of AGE 3, where graphite was produced at 580 °C in the presence of Fe powder and H2. The 14C-AMS analysis was performed in the LEMA AMS system of the Institute of Physics, National Autonomous University of Mexico, which is based on a 1 MV Tandetron (HVEE, the Netherlands). The oxalic acid OXAII (Standard Reference Material: 4990C) was used as the primary standard for normalizing the isotope ratios and phthalic acid (C8H6O4) free of 14C was used as a blank. The results are expressed as a fraction of modern carbon (F14C), the isotopic ratio of 14C/12C in 1950. The statistical analysis of the 14C/12C and 13C/12C ratios was performed, and quantitative results were corrected by δ13C fractionation (Solís et al. Reference Solís, Chávez-Lomelí, Ortiz, Huerta, Andrade and Barrios2014). The F14C values of the quartz filters are not blank corrected because the 14C abundance of the blank filters was under the detection limit and the contribution of the blank filter was considered negligeable.
Study design and practical constraints
The sampling campaigns were conducted as discrete, site-specific measurement periods, subject to the operational and logistical constraints typical of port environments. The Havana campaign was deliberately designed as an exploratory PM10 study, aimed at capturing both combustion-related contributions and the geological component of the coarse fraction. Building on these results, the campaigns in Mexico were implemented using a PM2.5-focused approach to emphasize the fine carbonaceous fraction and increase sensitivity to carbon associated with fossil-fuel use. Accordingly, cross-site contrasts are reported as campaign-based comparisons, interpreted within their respective sampling periods and size fractions, rather than as strict intercomparisons.
Meteorology
A methodological analysis of wind conditions over the last 30 years was conducted for the three study sites to assess the historical influence of wind direction on the sampling results and their interpretation. The analysis focused on identifying the predominant wind patterns during the months of May, June and July over the period 1993–2023 (Figure 1b–d). Wind climatology analyses were derived using data from the ERA5 reanalysis dataset, provided by the European Centre for Medium-Range Weather Forecasts (ECMWF), which combines numerical weather prediction outputs within situ and satellite observations and provides global hourly data at a horizontal resolution of 0.25° × 0.25° (Hersbach et al. Reference Hersbach, Bell, Berrisford, Hirahara, Horányi, Muñoz-Sabater and Thépaut2020). Hourly wind data at 10 m height were retrieved for the months of May, June and July. Figure 1a shows the study sites: Havana, Cuba (red star), Veracruz, Mexico (blue star), and Manzanillo, Mexico (purple star). Figure 1b shows the thermoelectric plant (blue triangle), and the refineries (purple squares).
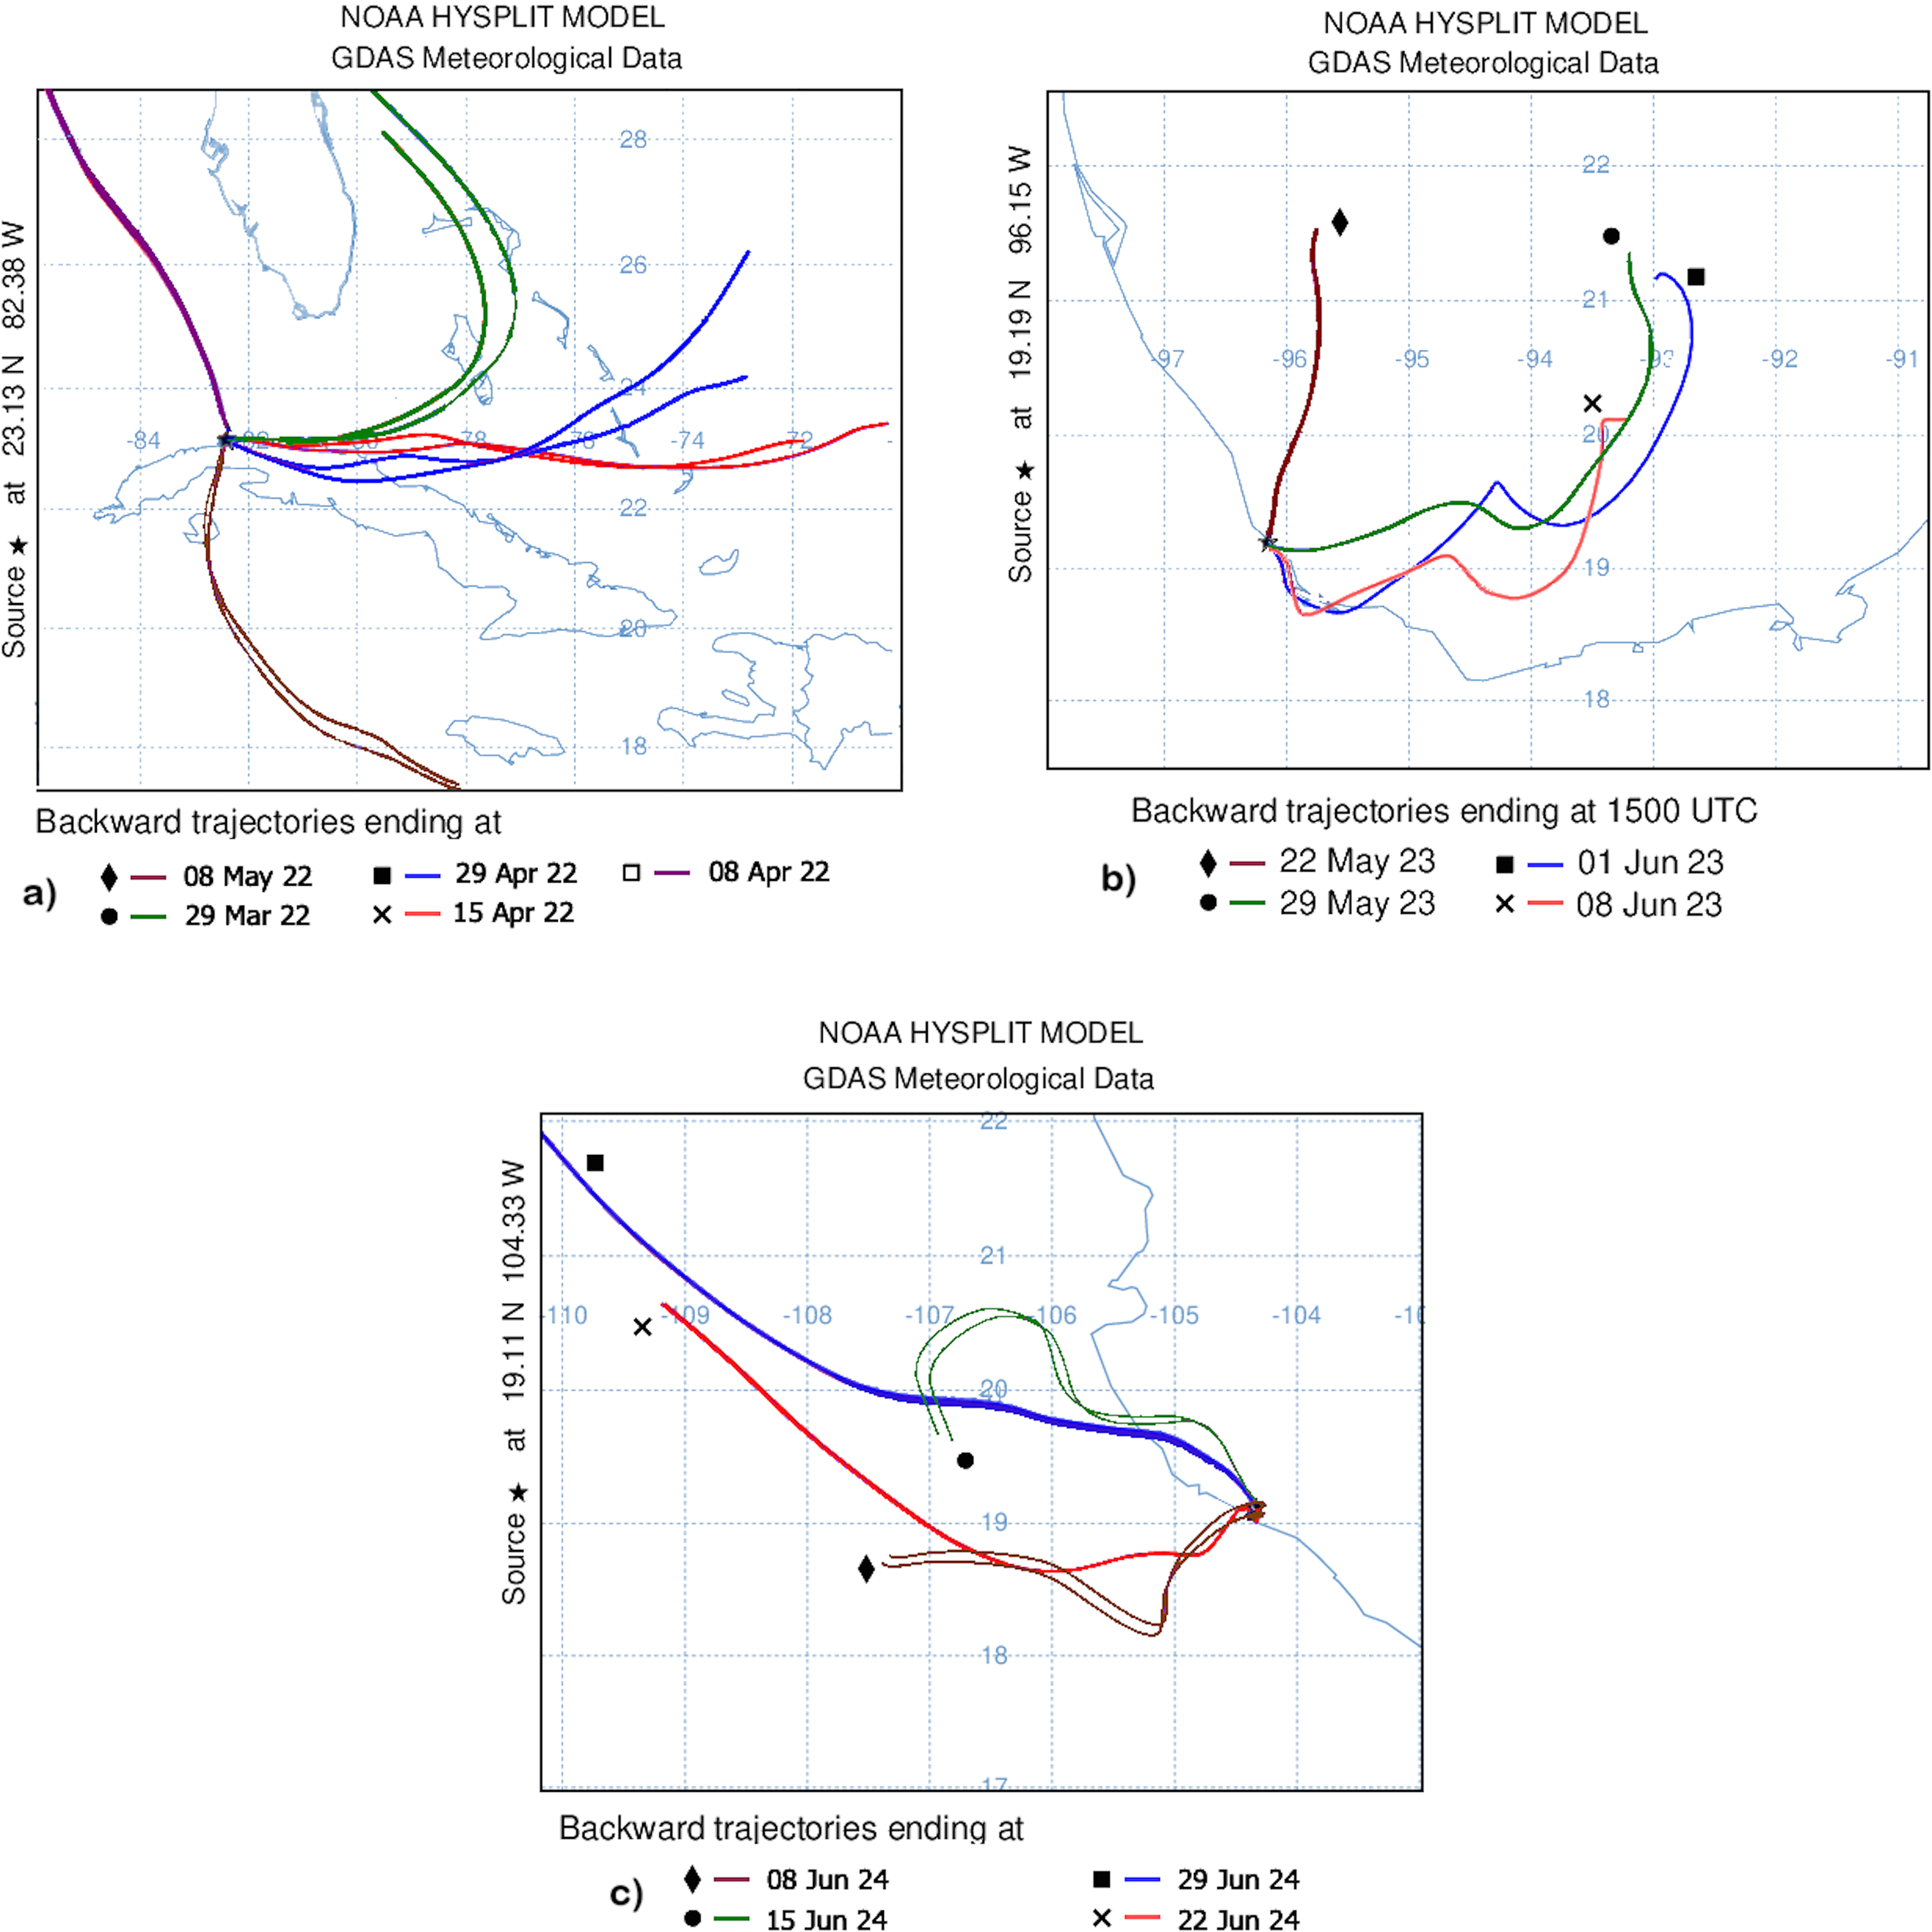
To determine the meteorological conditions during the sampling campaign we have computed and included site-specific backward air-mass trajectories using the NOAA HYSPLIT model (GDAS meteorological fields) for the sampling dates at the three locations. The multi-decadal wind climatology provides a seasonal-scale context for typical transport regimes, while HYSPLIT back trajectories are used to interpret air-mass origins on the specific sampling days at each site.
PMF
The Positive Matrix factorization (PMF) model is multivariate which allows us to identify and quantify the sources of pollutants using the data obtained from different times to estimate the profiles and sources as well as the contribution of these in the recorded concentrations. To investigate the main sources of Manzanillo to the PM2.5 fraction, the elemental composition of Teflon filters collected in this port were using PMF. The result obtained by applying the model consisted of 4 factors where the Qtrue/Qexp of 1.45 falls within the value for data that have consistency in the model (Brown et al. Reference Brown, Eberly, Paatero and Norris2015).
Results and discussion
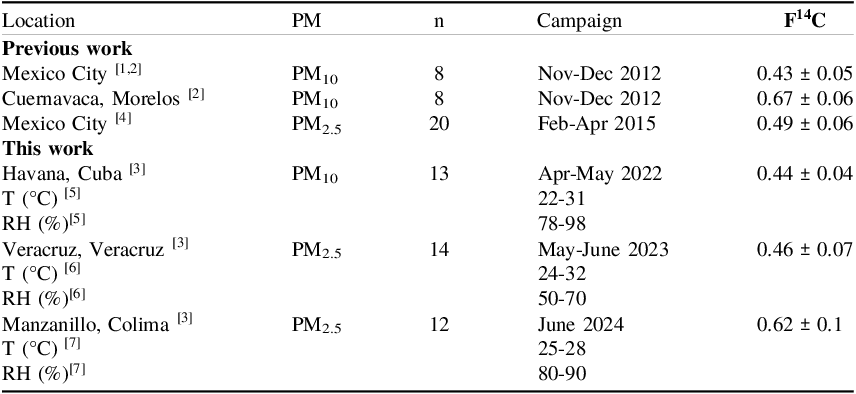
The Havana campaign focused on the PM10 fraction as an exploratory study to assess contributions from combustion and crustal (geological) sources. Based on these results, we extended the work to Mexican ports and refined the approach by analyzing the PM2.5 fraction to increase the relative contribution of organic material. Table 1 shows the fraction of modern carbon (F14C) values measured in various locations in Mexico and Cuba in this work and in earlier studies. The meteorological conditions (temperature and relative humidity) during the sampling are also included. The three campaigns were carried out during the dry season. Only in Manzanillo were there some episodes of precipitation during the last four days of sampling. Havana, Veracruz and Manzanillo had warm temperatures with maximums of 31, 32 and 28 respectively. The highest humidities were measured in Havana and Manzanillo (98% and 90% respectively), while Veracruz had a 50% to 70% humidity range.
Fraction of modern carbon in PM10 and PM2.5, and deviation of the mean, in several locations from previous reports and the campaigns carried out in this work. Temperature (T) and Relative Humidity (RH) (minimum and maximum values) during the sampling period of this work are also shown.

[1] Gómez et al. Reference Gómez, Solís, Chávez, Andrade, Ortiz, Huerta, Aragón, Rodríguez-Ceja, Martínez-Carrillo and Ortiz2016; [2] Solís et al. Reference Solís, Gómez, Ortíz, Chávez, Miranda, Aragón, Martínez-Carrillo, Castro and Peralta2017; [3] This work; [4] Gómez Chávez MV. 2020, [5] El tiempo en La Habana en la primavera, https://es.weatherspark.com/s/16780/0/ [6] Archivo meteorológico Manzanillo- meteoblue; [7] Archivo meteorológico Veracruz - meteoblue
PM10 aerosols collected in Mexico City and Havana’s maritime port showed low F14C values, indicating a significant contribution of fossil fuel emissions. In contrast, Cuernavaca displayed high F14C values, reflecting a predominance of modern carbon sources such as biomass burning or biogenic emissions. This comparison highlights the influence of urban and industrial activities on the carbon isotopic composition of aerosols, as Cuernavaca is less industrialized compared to Mexico City and Havana, which are characterized by higher fossil fuel consumption.
The lowest F14C (highest fossil carbon contribution) in PM2.5 aerosols was observed in aerosols collected in Mexico City, followed by Veracruz. Manzanillo had the lowest fossil contribution, despite being a port with a lot of commercial activity and a thermoelectric plant.
The results in Table 1 contrast the campaigns in maritime ports, with previous studies in continental urban zones in Mexico. It should be noted that the measurements were taken in different aerosol fractions (PM10 vs. PM2.5) and during different sampling periods. A direct comparison is not possible because this would lead to misinterpretation, as the contribution of modern carbon has progressively decreased due to the bomb pulse due to nuclear tests.
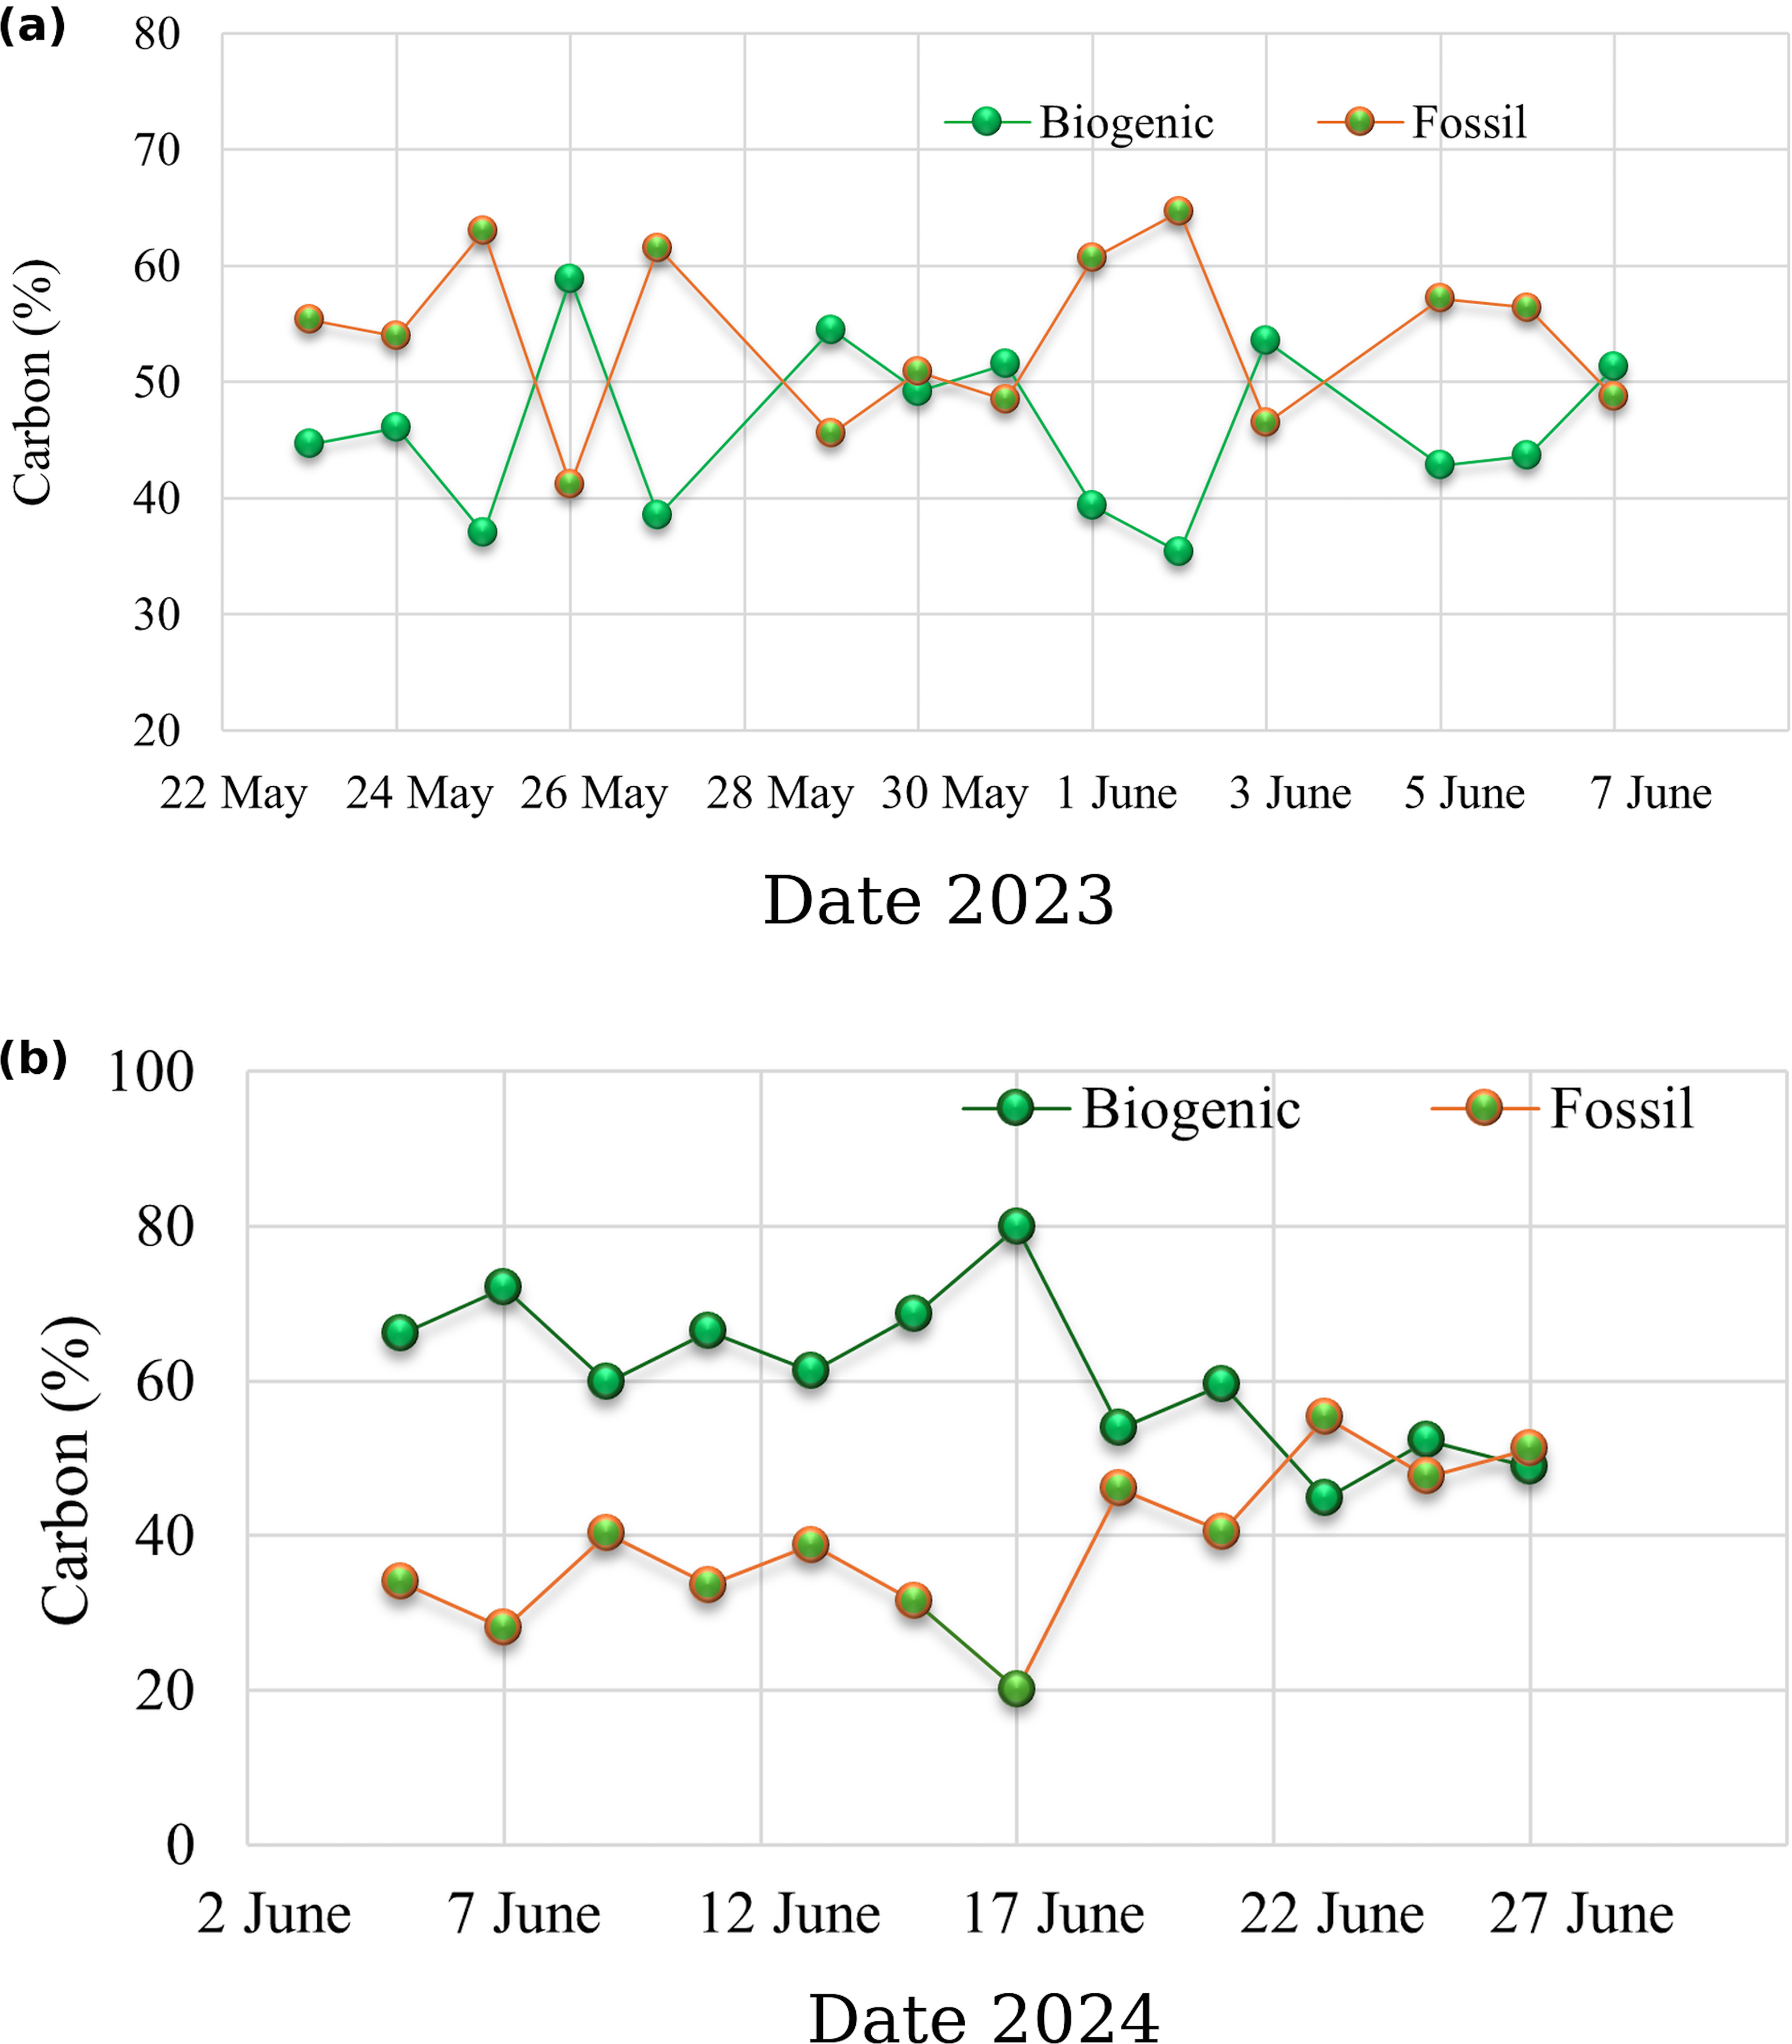
Temporal variation of fossil and biogenic fractions of TC based on 14C mass balance for Veracruz and Manzanillo aerosols is shown in Figure 2. The contributions of carbon from biogenic (Biogenic) and fossil fuel (Fossil) sources present in aerosols were determined using the fraction of modern carbon (F14C) and the total carbon (TC) percentage, based on the equations (1) and (2) (Takahashi et al. Reference Takahashi, Hirabayashi, Tanabe, Shibata, Nishikawa and Sakamoto2007)
 ${\rm{Biogenic\;carbon\!\!:Biogenic = {F^{14}}C \times TC}} \times f$
 ${\rm{Fossil\; fuel\; carbon\!\!:Fossil = TC-Biogenic}}$
Temporal variation of biogenic carbon (CT Biogenic) and fossil carbon (CT fossil). left: Veracruz, right: Manzanillo.

Figure 2. Long description
Panel A: A line graph shows the temporal variation of biogenic and fossil carbon in Veracruz from May 22 to June 7, 2023. The x-axis represents the date, and the y-axis represents the carbon percentage. The graph includes two lines: one for biogenic carbon in green and another for fossil carbon in orange. The biogenic carbon line fluctuates between approximately 30 percent and 60 percent, while the fossil carbon line remains relatively stable around 50 percent to 60 percent. Panel B: Another line graph illustrates the temporal variation of biogenic and fossil carbon in Manzanillo from June 2 to June 27, 2024. The x-axis represents the date, and the y-axis represents the carbon percentage. This graph also includes two lines: one for biogenic carbon in green and another for fossil carbon in orange. The biogenic carbon line varies between approximately 20 percent and 80 percent, while the fossil carbon line stays around 40 percent to 60 percent.
Where f represents a correction factor equal to 1/1.015 = 0.9852. The value 1.015 corresponds to the mean F14C value of coffee beans (pure biomass) grown in various regions of Mexico, collected between 2022 and 2024 (Mas et al. Reference Mas-Ruiz, Zinicovscaia, Yushin, Chávez, Espejel, Huerta, Reza, Rodriguez-Ceja and Solis2025). We assumed that their carbon originated in the upper soil layers and in aboveground biomass, reflecting CO₂ assimilated over several years. In this study, the F1⁴C determined in biomass is used as a reference for contemporary carbon. By comparison, in 2012 and 2015, when PM2.5 sampling was carried out in Mexico City, the value of atmospheric F14C was higher (1.038 and 1.0235 respectively for the NH Zone 2) because of the nuclear bomb pulse (Hua et al. Reference Hua, Turnbull, Santos, Rakowski, Ancapichún, De Pol-Holz, Hammer, Lehman, Levin, Miller, Palmer and Turner2022). The average fossil fraction was 54 ± 7 % for Veracruz vs. 39 ± 10% for Manzanillo, while the biogenic fraction was 46% in Veracruz vs. 61% in Manzanillo.
Regarding the predominance of contributions from fossil sources, the results for Veracruz are consistent with those previously reported (González Rivera et al. Reference González-Rivera, Mugica-Álvarez, Sosa-Echeverría, Sánchez-Álvarez, Magaña Rueda, Vázquez Cruz and Retama2023) who evaluated the air quality of the port of Veracruz from October 2019 to December 2020. From the emissions from vessels during maneuvering and hotelling activities, these authors calculated an emissions inventory. Additionally, they analyzed meteorology and concluded that the Veracruz port area is the main source of polluting emissions (SO2 and PM2.5) throughout the year.
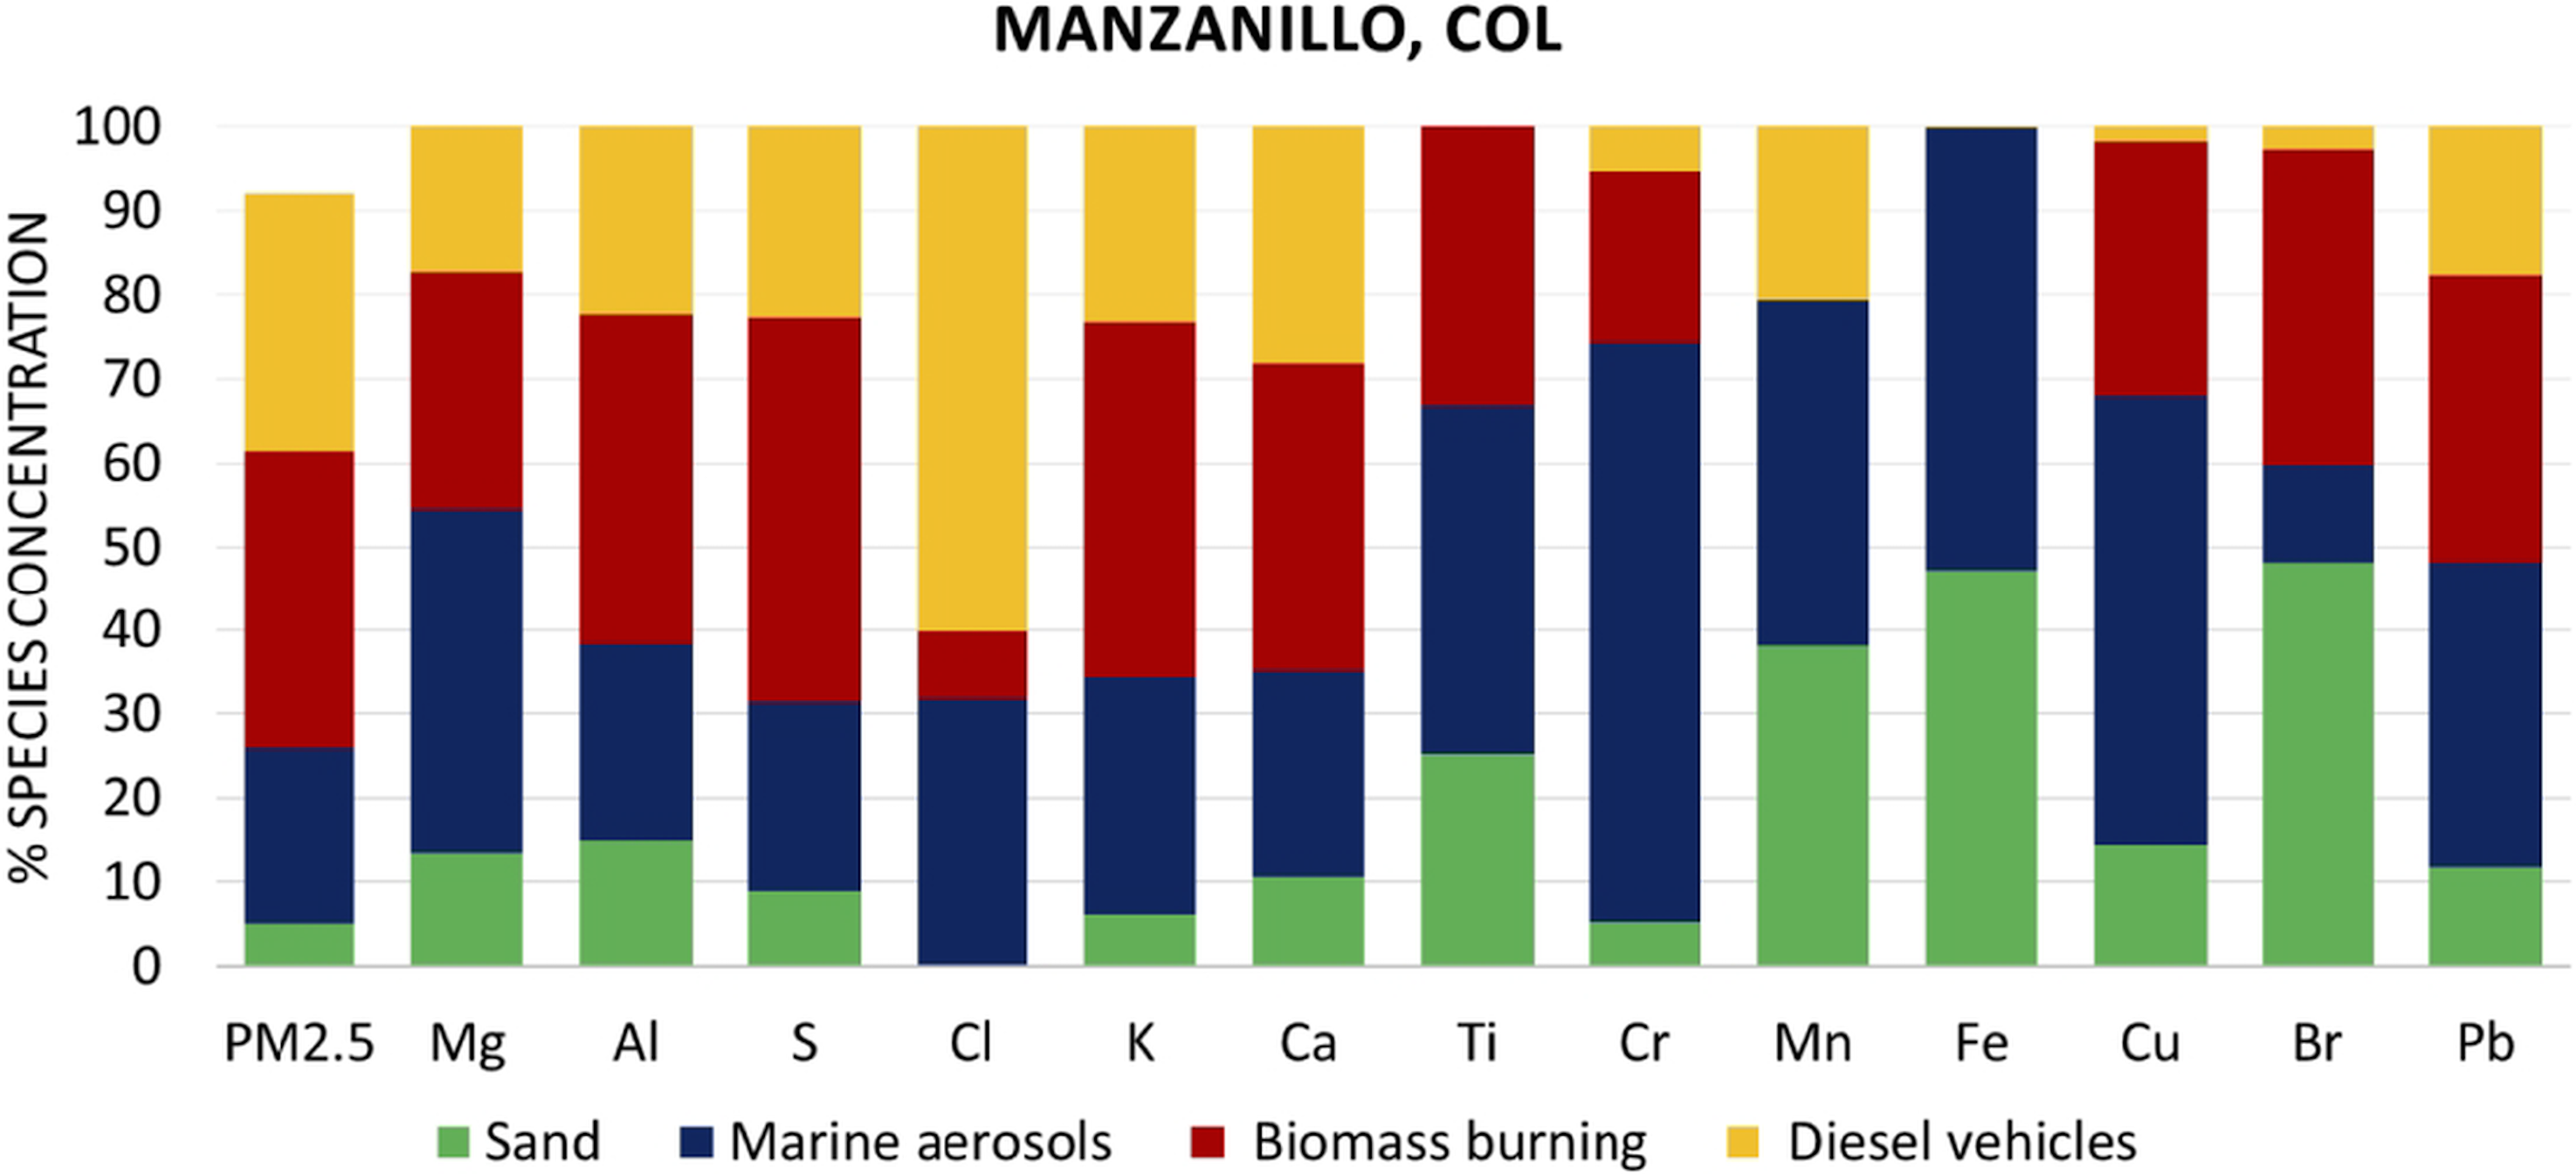
To investigate the main sources of Manzanillo to the PM2.5 fraction, the elemental composition of Teflon filters collected in his port, was analyzed using Positive Matrix Factorization model. The PMF run for the data obtained from the Teflon filters with 4 factors, resulted in a Qtrue/Qexp of 1.45, which falls within the value for data that have consistency in the model (Brown et al. Reference Brown, Eberly, Paatero and Norris2015). The factors determined in the PMF are shown in Figure 3, and were assigned as the following sources: sand, marine aerosols, biomass burning, and diesel vehicles, respectively (Carranza-Edwards et al. Reference Carranza-Edwards, Kasper Zubillaga, Rosales Hoz, Morales de la Garza and Lozano Santa Cruz2009; Mancilla et al. Reference Mancilla, Medina, González and Mendoza2022; Torres-Ortiz et al. Reference Torres-Ortiz, Reyes Salazar, Sánchez González and Núñez Miranda2009). Among these, it is observed that biomass burning has the greatest influence, contributing 35% to PM2.5, indicating a higher influence of biogenic carbon, which aligns with the result obtained in the 14C fraction for the port of Manzanillo.
Apportionment obtained with the PMF model for each species and four sources at the Manzanillo seaport.

The results obtained for the three ports studied are contrasting even though they are three ports with intense port activity. The air quality of the ports of Veracruz and Havana shows a more significant influence on port activities, resulting in a more outstanding contribution of fossil sources, as the low F14C values indicate (0.46 ± 0.07 and 0.44 ± 0.04 respectively).
On the other hand, the Port of Manzanillo exhibits an F1⁴C value of 0.62 ± 0.1, indicating an appreciable contribution of non-fossil sources to urban aerosols. Considering the wind pattern over Manzanillo (Figure 1c), which shows predominantly onshore advection from the ocean toward the sampling site, this non-fossil contribution is consistent with inputs associated with marine air masses. In this context, Dusek et al. (Reference Dusek, Brink, Meijer, Kosb, Mrozek, Röckmann, Holzinger and Weijers2013) reported F1⁴C values close to 0.8 for aerosol carbon under clean marine air-mass conditions, providing a comparative framework for interpreting the non-fossil component observed here. Consistent with the above statement, the application of PMF receptor model estimates that in the campaign conducted in Manzanillo in June 2024, fossil fuels contribute much less than biogenic sources, despite the intense maritime activity in that port.
For Havana, reports on environmental quality in the port are based on studies of the elemental composition of airborne particulate matter PM10 and PM2.5. For example, a PIXE study conducted in Havana (Zayas et al. Reference Zayas, Hernández, Aruca, Gala, Esquivel, Varona, Fernández Arocha, Aldape and Flores2009) detected 14 elements in both fractions, highlighting the presence of high concentrations of elements such as S, V, Ni, and Pb associated with electricity generation and petrochemicals.
The studies reported for Veracruz focus mainly on determining emissions inventories. For example, the study conducted between 2019 and 2020 (González-Rivera et al. Reference González-Rivera, Mugica-Álvarez, Sosa-Echeverría, Sánchez-Álvarez, Magaña Rueda, Vázquez Cruz and Retama2023) reports high levels of SO₂ and PM2.5 emissions, which, unlike what was seen in Havana, is consistent with a marked influence of combustion associated with port operations and with episodes of resuspension linked to the construction zone for the port expansion.
The analysis of air mass backward trajectories through NOAA-HYSPLIT for Havana, Veracruz and Manzanillo is shown in Figure 4. These trajectories provide a more direct and event-relevant basis to link air-mass origin and transport pathways with the observed source signatures.
Combination of HYSPLIT simulation of 48-hour back trajectories for the weeks during which sampling was carried out for a) Havana, Cuba; b) Veracruz, Mexico; c) Manzanillo, Mexico.

In Havana, the main influence was from air masses coming from the East direction, crossing the mainland before reaching the port (Figure 4a). Air masses coming directly from the South and North were also observed, albeit less frequently. Based on the locations of regional sources and the sampling-period air-mass transport pathways, we consider the Ñico López refinery (Havana) the most plausible local point source contributing to the high percentage (56 ± 7%) of fossil fuel contribution in Havana. While the Ernesto Guevara (Santa Cruz del Norte) and Antonio Guiteras (Matanzas) thermoelectric power plants are located East of Havana and within ∼85 km of the sampling site, they also fall within the air-mass transport pathways during the sampling period, as indicated by the HYSPLIT backward trajectories (Figure 4a). Conversely, the Sergio Soto and Camilo Cienfuegos refineries and the Carlos Manuel de Céspedes thermoelectric plant, located to the Southeast, are not expected to contribute to the fossil signature under the observed transport regimes. The backward trajectories for Veracruz (Figure 4b) show predominantly marine transport over the Gulf of Mexico on several sampling days, which is consistent with a strong marine influence and atmospheric dilution relative to purely continental inflow. At the same time, the presence of trajectories that partially intersect the coastal land sector suggests enhancement of combustion-related aerosols and resuspended dust, superimposed on the marine background. In this context, the transport regimes identified here are consistent with evidence showing a contribution of fossil emissions depleted in 14C. In Manzanillo (Figure 4c), most of the trajectories originate in the West (Pacific Ocean), with long and relatively direct paths, indicating a strong contribution of marine aerosols containing salts, sulfate, and marine carbon during the monitoring campaign. Likewise, there were air masses from the continent contributing with carbon from local and biogenic sources and resuspending material, but that are not provided by the port activities.
The Havana campaign focused on the PM10 fraction as an exploratory study to assess contributions from combustion and crustal (geological) sources. Based on these results, we extended the work to Mexican ports and refined the approach by analyzing the PM2.5 fraction to increase the relative contribution of organic material. We expected similar F1⁴C values across all ports, reflecting a strong fossil contribution relative to the biogenic fraction of aerosols due to intense port activity.
Conclusions
The 14C abundance was analyzed in aerosols collected at three seaports: Havana, Cuba, and Veracruz and Manzanillo, Mexico. This sequential approach first enabled the identification of fossil and non-fossil contributions and subsequently guided a refined assessment of carbonaceous material in the Mexican ports.
The Havana campaign was designed as an exploration PM10 study to jointly assess combustion-related carbon and the potential relevance of geological material in a coastal urban/port setting. The findings from Havana motivated a refining assessment of carbonaceous material in the Mexican ports. This led to a PM2.5-focused sampling strategy in Mexico, as PM2.5 is more representative of fine carbonaceous aerosols and provides greater sensitivity to combustion-related sources. Accordingly, results from the three sites are best interpreted as campaign-based contrasts rather than as direct intercomparisons.
Fossil carbon content in Havana and Veracruz reflects the impact of port activity, oil and energy infrastructure, and the proximity of these maritime ports to urban areas. On the other hand, Manzanillo port exhibited lower pollutant levels due to local climatic conditions and less regional industrialization and urbanization. The receptor model (PMF) based on elemental composition enables discrimination of source contributions and indicates the influence of non-fossil and natural sources, highlighting a dominant biomass-burning component, along with marine aerosols, sand, and a diesel-vehicle factor.
This study supports the need to incorporate air-quality monitoring in seaports and to integrate 1⁴C-AMS analyses with elemental and meteorological analyses to better constrain fossil versus modern contributions and inform mitigation strategies in coastal regions with intense port activity.
Acknowledgments
The authors thank to Arcadio Huerta and Sergio Martínez, Juan Carlos Pineda, for technical assistance. This work was partially supported by grants DGAPA PAPIIT-UNAM IN112023, IA101323 and SECIHTI 2023-LNC-58. AK Hernández Rangel received a fellowship from SECIHTI.