Introduction
When central vision is damaged, the ocular motor system loses its reference position—which is at the fovea in the normal eye—leading to difficulties in ocular motor control. Most patients adapt to their impairment by using the healthy eccentric parts of the retina for fixation; these eccentric retinal areas are called preferred retinal loci or PRLs and they play the role of a “pseudo-fovea” (von Noorden & Mackensen, Reference von Noorden and Mackensen1962; White & Bedell, Reference White and Bedell1990; Guez et al., Reference Guez, Le Gargasson, Rigaudiere and O’Regan1993; Fletcher & Schuchard, Reference Fletcher and Schuchard1997; Schuchard, Reference Schuchard2005). It has been shown that, occasionally, more than one PRL may occur, especially in patients with long-lasting scotomas, and that the PRL locations can vary with viewing conditions or the duration of disease (Lei & Schuchard, Reference Lei and Schuchard1997; Duret et al., Reference Duret, Issenhuth and Safran1999; Deruaz et al., Reference Deruaz, Whatham, Mermoud and Safran2002; Crossland et al., Reference Crossland, Sims, Galbraith and Rubin2004b, Reference Crossland, Culham, Kabanarou and Rubin2005; Schuchard, Reference Schuchard2005; Reinhard et al., Reference Reinhard, Messias, Dietz, Mackeben, Lakmann, Scholl, Apfelstedt-Sylla, Weber, Seeliger, Zrenner and Trauzettel-Klosinski2007).
The precision and accuracy of eye movements with an eccentric PRL are worse than those with a fovea. Although optokinetic nystagmus seems to be unaffected in patients with moderate central scotomas (Abadi & Pantazidou, Reference Abadi and Pantazidou1997; Valmaggia et al., Reference Valmaggia, Charlier and Gottlob2001), and smooth pursuit and vergence have yet to be explored, research has shown that saccadic eye movements are affected in patients with central vision loss: they generate inaccurate, slower, and more frequent saccades, with longer initiation latencies than normally sighted observers (White & Bedell, Reference White and Bedell1990; McMahon et al., Reference McMahon, Hansen and Viana1991; Whittaker et al., Reference Whittaker, Cummings and Swieson1991).
Two aspects of an eccentric PRL are of interest: fixation stability and retinal location. First, fixation stability refers to the precision of eye fixation when one fixates intently on a stimulus for a certain period of time (González et al., Reference González, Teichman, Markowitz, Lillakas and Steinbach2006). Research shows that people with central vision loss have impaired fixation stability and this may contribute to their poor visual performance (Timberlake et al., Reference Timberlake, Mainster, Peli, Augliere, Essock and Arend1986, Reference Timberlake, Sharma, Grose, Gobert, Gauch and Maino2005; Crossland et al., Reference Crossland, Culham and Rubin2004a; Tarita-Nistor et al., Reference Tarita-Nistor, González, Markowitz and Steinbach2008).
Second, it has been shown that the PRL occurs in the inferior or in the left part of the visual field in a large proportion of patients, but the location is not consciously chosen (Guez et al., Reference Guez, Le Gargasson, Rigaudiere and O’Regan1993; Sunness et al., Reference Sunness, Applegate, Haselwood and Rubin1996; Fletcher & Schuchard, Reference Fletcher and Schuchard1997; Deruaz et al., Reference Deruaz, Whatham, Mermoud and Safran2002; Cacho et al., Reference Cacho, Dichinson, Reeves and Harper2007; Tarita-Nistor et al., Reference Tarita-Nistor, González, Markowitz and Steinbach2008). Furthermore, the location is typically at the border of the scotoma, and it is not always optimal for visual tasks such as reading (Petre et al., Reference Petre, Hazel, Fine and Rubin2000; Frennesson & Nilsson, Reference Frennesson and Nilsson2007). There is a theoretical advantage to reading with a PRL located in the inferior part of the visual field. Both inferior and superior parts of the visual field offer a larger visual span (Whittaker & Lovie-Kitchin, Reference Whittaker and Lovie-Kitchin1993), and it has been shown that reading is better when the PRL is located in the inferior rather than the superior part of the visual field, probably because of this area’s importance for locomotion (Frennesson & Nilsson, Reference Frennesson and Nilsson2007). In addition, this location avoids the difficulties encountered when the PRL is located on the side of the scotoma: it allows the readers to know where the eyes have fixated previously so they can properly guide their eye movements, it does not affect the programming of left-to-right saccades, and it eliminates the problem of the text being occluded by the scotoma (Guez et al., Reference Guez, Le Gargasson, Rigaudiere and O’Regan1993; Deruaz et al., Reference Deruaz, Whatham, Mermoud and Safran2002; Chung et al., Reference Chung, Legge and Cheung2004). Studies involving people with normal vision and simulated scotomas confirmed the advantage of this PRL location in reading (Petre et al., Reference Petre, Hazel, Fine and Rubin2000; Frennesson & Nilsson, Reference Frennesson and Nilsson2007), but conflicting results have been obtained from people with central vision loss: some reports show greater advantage from reading with a PRL below the scotoma in the visual field (Nilsson et al., Reference Nilsson, Frennesson and Nilsson1998, Reference Nilsson, Frennesson and Nilsson2003), while others showed no benefit at all (Fletcher et al., Reference Fletcher, Schuchard and Watson1999; Crossland et al., Reference Crossland, Culham, Kabanarou and Rubin2005). PRLs in this location occur naturally in less than half of the patients (Guez et al., Reference Guez, Le Gargasson, Rigaudiere and O’Regan1993; Sunness et al., Reference Sunness, Applegate, Haselwood and Rubin1996; Fletcher & Schuchard, Reference Fletcher and Schuchard1997). To date, there is no clear explanation for what determines the location of a PRL (see Cheung & Legge, Reference Cheung and Legge2005, for a review).
Stabilizing fixation and relocating the PRL to a better retinal location may have positive consequences on visual performance. Such actions, however, require great plasticity of the visual system of patients with central vision loss and one may wonder if this plasticity exists. Fortunately, support for such plasticity has started to emerge: for example, there is proof that a new PRL can be trained in an optimal retinal location for reading, with huge improvements on reading performance (Nilsson et al., Reference Nilsson, Frennesson and Nilsson2003). Yet, the combined training of fixation stability and of a new PRL in an optimal location has not been performed.
PRL location and fixation stability can be recorded with the MP-1 microperimeter (Nidek Technologies Srl., Vigonza, Padova, Italy). This new instrument combines computerized perimetry, measurement of fixation stability, and digital fundus photography, as well as an auditory biofeedback system. In this study, we used the biofeedback feature of the MP-1 to train patients with central vision loss to relocate the PRL to a more suitable location and improve fixation concomitantly. The purpose of this study was to see whether fixation stability improvement and PRL relocation are possible and, if they are, whether these changes have positive consequences on reading performance. In addition, we evaluated whether these patients could consistently use the same PRL when viewing different fixation targets, both before and after training.
Materials and methods
Participants
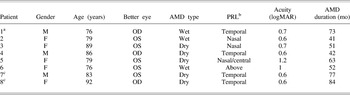
The demographic and clinical characteristics of the patients at baseline are shown in Table 1. Initially, eight patients participated in the experiment but two were excluded (Patients 7 and 8) because they were unable to make use of the auditory biofeedback training. Both could not follow instructions during training, one had malfunctioning hearing aids and the other had difficulty keeping his eye open. Therefore, the success rate of the biofeedback training was 75%, and only data from six participants (four females, two males, mean age 80.8 ± 5.4 years) were included in the analysis. Patients had a corrected visual acuity between 0.6 and 1.2 logMAR (mean acuity = 0.80 ± 0.24 logMAR) in the better seeing eye and a scotoma size smaller than 20 deg. All but one (Patient 6) had a PRL located temporal or nasal to the scotoma (Table 1). Although this patient’s PRL was above the scotoma, her fixation stability was rather poor.
Demographic and clinical characteristics of the patients prior to training

OS, left eye, OD, right eye, AMD, age-related macular degeneration. aOS enucleated. bPRL location relative to scotoma. cPatients excluded from analysis.
Apparatus and stimuli
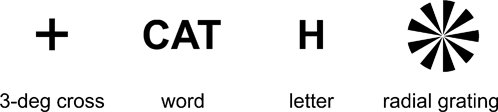
PRL location and fixation stability were recorded with the MP-1 microperimeter. This instrument records fixation using an auto eye-tracking system that registers horizontal and vertical eye position relative to an anatomical landmark (i.e., a retinal blood vessel) while compensating for stimulus projection location. The fundus movements are recorded while the patient fixates on a target projected on a graphics screen at a rate of 25 Hz. Four fixation targets were used: a 3-deg red cross, a three-letter word, a letter, and a nine-cycle square-wave symmetrical radial grating stimulus. The latter stimulus subtended 9 deg and is described elsewhere (González, et al., Reference González, Teichman, Markowitz, Lillakas and Steinbach2006). The letter and the word were in red capital letters and matched the size of the 20/200 MP-1 acuity stimulus. All fixation targets were presented on a white background that had a luminance of 1.27 cd/m2. The fixation targets are shown in Fig. 1.
Fixation stimuli used with the MP-1 for measurements of fixation stability and PRL location. The cross, word, and letter were in red.

In addition to measuring eye position, a new fixation location can be trained using the MP-1’s auditory biofeedback feature. The desired retinal location is selected and the patient’s task is to align it with the fixation target while guided by instructions from the operator and an intermittent sound whose frequency increases as the new retinal location approaches the fixation target. The intermittent sound becomes continuous when the selected retinal location is within the area designated as the fixation target.
Visual acuity was measured using the Early Treatment Diabetic Retinopathy Study (ETDRS) chart (Lighthouse Int., New York, NY). Reading ability was measured with the MNRead (Lighthouse Int.) in two versions of the black-on-white chart. The MNRead test is a continuous-text reading chart that measures three reading parameters: (1) reading acuity: the smallest print size that can be read without significant errors; (2) maximum reading speed: the highest speed at which a text can be read without being limited by print size; and (3) critical print size: the smallest print size that can be read with maximum speed.
Chapters from Black Beauty by Anna Sewell were provided for each patient as homework reading materials. This book was chosen because it is in the public domain (Project Gutenberg: www.gutenberg.org) and is of moderate difficulty. The reading materials were printed using the Microsoft Office Word™ software in Courier bold (a fixed-space, serif type font), double-spaced, and with horizontal lines above and below the text for help with gaze control and navigation across the page. The print size was customized for each patient’s visual abilities.
Procedure
The patients participated in two assessment sessions (one at the beginning and one at the end of the program) and five training sessions. Only the better seeing eye was tested and trained, while the other was patched. The assessment sessions included the following tests: (1) Best-corrected visual acuity at 1 m. (2) Reading performance at 40 cm using one version of the MNRead test randomly selected and different for each assessment session. For this test, patients wore newly refracted reading glasses and were asked to read from the chart, one sentence at a time. The experimenter timed each sentence with a stopwatch and prompted the patient to start reading the next sentence. If a patient was unable to read any sentence on the chart, the distance was adjusted to 15 cm. (3) Fixation stability, microperimetry, and fundus photographs were performed with the MP-1. Patients were seated with their head on the headrest of the instrument and asked to look at the fixation stimulus projected in the middle of the viewing area. Fixation stability was recorded 4 times, each time with a different fixation target presented in random order. Each fixation stability examination lasted less than 1 min, after all setup adjustments were made. The microperimetry of the better seeing eye was performed with a static semiautomatic perimetry test. The patients were to press a button any time they detected a brief spot of light [Goldmann III stimuli with intensities ranging from 0 dB (127 cd/m2) to 20 dB (1.27 cd/m2) and durations of 200 ms] while looking at the cross. The microperimetry test did not last more than 15 min in all cases. A fundus photograph was obtained at the end of the examination.
The training sessions were 1 h long, once a week for five consecutive weeks. The part of the retina to be trained was selected after the initial assessment session and was based on the microperimetry and fixation stability examinations. The new location was chosen in the upper part of the retina in all cases, selected to be at approximately the same radial distance from the old fovea (but no farther than 10 deg), and in a retinal area with similar or better sensitivity as the old location (Supplementary information on all patients is available from http://journals.cambridge.org/vns). (In Patient 5, the central scotoma prohibited training at the same radial distance from the old fovea.) During these sessions, each patient was asked to look at a fixation stimulus projected on the viewing display of the MP-1 with the better seeing eye, while the other eye was patched. The preferred fixation stimulus during biofeedback training was the 3-deg cross. The experimenter selected the retinal area to be trained and instructed the patient in which direction to move the eye (e.g., “look up and to the left”). The intermittent sound of the biofeedback procedure and the experimenter’s constant guidance helped the patients align the selected retinal area with the fixation target. The patients were encouraged to maintain fixation in the position that triggered the continuous tone for periods of 15–30 s. They were also asked to be aware of and remember the position of their eye. In order to avoid fatigue, brief rest periods were taken every 10 min of PRL relocation and fixation stability practice. The fixation stability of the old PRL and of the new PRL was recorded at the beginning and at the end of each training session for the period recommended by the MP-1 manufacturer (15–30 s). The instruction to use the old PRL and record fixation was: “Look straight at the target so you can see it and keep your eye steady on it.” To use the new PRL, patients were told: “Look at the target by keeping the eye in the trained position.” The experimenter could observe on the MP-1 monitor which PRL the patients were using and gave appropriate instructions when recording fixation stability of the old and the new PRL.
At the end of the training session, the patients left with reading materials that had a print size customized for their visual abilities. They were instructed to read 1 h a day in a well illuminated room, while wearing their new reading glasses, covering the other eye with a patch and keeping their viewing eye in the trained position. They were free to read in shorter more frequent sessions (e.g., read 2 times a day for half an hour) but did not keep a log or a diary. We documented their progress in each session, and kept a log of how much they read, as new reading material was handed out at the end of each session.
Data analysis
Fixation stability was evaluated with the bivariate contour ellipse area (BCEA). Its calculation is described in Timberlake et al. (Reference Timberlake, Sharma, Grose, Gobert, Gauch and Maino2005) and given by the formula:

where χ 2 is the chi-squared value (2 df) corresponding to a probability value of P = 0.682 (±1 s.d.), σ x and σ y are s.d.s of the horizontal and vertical eye movements, and ρ is the Pearson product–moment correlation coefficient of the horizontal and vertical eye movements. Analysis was carried out in accordance with the guidelines described in Tarita-Nistor et al. (Reference Tarita-Nistor, González, Markowitz and Steinbach2008) in order to reduce instrument artifacts.
Reading acuity in logMAR was calculated with the formula provided by the MNRead manual: reading acuity = 1.4 − (sentences × 0.1) + (errors × 0.01). A correction of 0.42 logMAR was added when the viewing distance was reduced to 15 cm. Maximum reading speed was measured in words per minute (wpm) and critical print size in logMAR units. An alpha level was set at 0.05 for all statistical tests. In cases where two-way repeated measures analyses of variance were performed, the main and interaction effects were tested using a univariate criterion with a Greenhouse–Geisser correction.
Results
Location of the PRLs
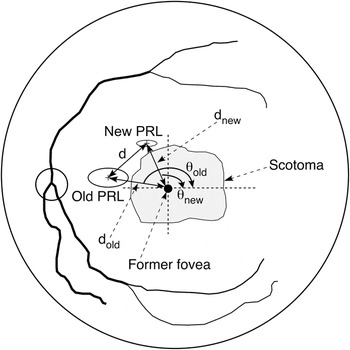
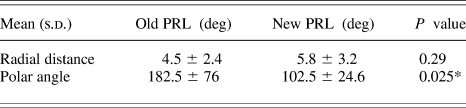
After training, all participants successfully developed a new PRL in the upper part of the retina. As revealed by the microperimetry, this retinal area had similar or better sensitivity than the old location. The mean difference in PRL location before and after training was 5.25 ± 3.06 deg, when viewing the 3-deg cross. The mean radial distance of the new PRL from the former fovea was not different from that of the old PRL, t(5) = 1.19, P = 0.29, but their mean polar angles were t(5) = 2.57, P = 0.025, one tail. The location of the former fovea was estimated as being at 15.5 deg horizontally and −1.3 deg vertically from the center of the optic disc, as reported in Tarita-Nistor et al. (Reference Tarita-Nistor, González, Markowitz and Steinbach2008). Schematics located of radial distances and polar angles are shown in Fig. 2, and the means are reported in Table 2.
Schematic of the PRL location measures: shown radial distance of the old PRL (dold) and of the new PRL (dnew) from the former fovea; distance (d) between the centroids of the old and new PRL; polar angle of the old PRL (θ old) and new PRL (θ new).

Mean radial distances (s.d.) and polar angles between the former fovea and the centroid of the PRL when viewing the 3-deg cross, for the old and the new PRL locations

* P < 0.05 (one tail).
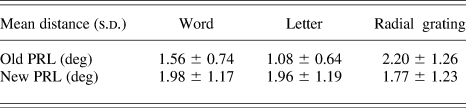
A two-way repeated measures analysis of variance was performed in order to determine whether the patients used a consistent PRL when viewing different targets, both before and after training. We used differential map analysis—a feature of the MP-1 that compares two different fixation examinations of the same patient—to calculate the distance between the locations of the PRL when viewing the word, letter, and radial gratings relative to the location of the PRL when viewing the 3-deg cross (the default stimulus). These measurements were obtained for both the old PRL location (before training) and the new PRL location (after training). The within-subject factors were Condition with two levels (before and after training) and Target with three levels (word, letter, and radial grating). The results showed that the distances of the PRL centroids when viewing different targets relative to the cross were very small and not statistically different from each other, F(2, 10) = 0.88, P = 0.44. The averages of these distances were not different for the old and new PRL location, F(1, 5) = 0.38, P = 0.57. Also, there was no Condition × Target interaction effect, F(2, 10) = 1.40, P = 0.29. The means and s.d.s are shown in Table 3.
Mean distances (s.d.) between the centroid of the PRL when viewing the 3-deg cross and that of the PRL when viewing different targets, for the old and the new PRL locations

Fixation stability with different targets before training (old PRL location) and after training (new PRL location)
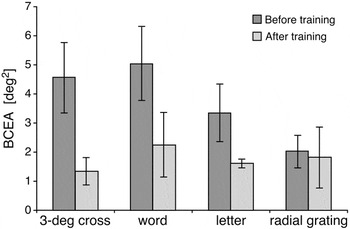
A two-way repeated measures analysis of variance was performed to determine whether fixation stability of the initial PRL before training was different from that of the trained PRL (new location) and whether fixation stability changed with different targets. The within-subject factors were Condition with two levels (before and after training) and Fixation Target with four levels (3-deg cross, word, letter, and radial grating). The results showed that the Condition main effect was significant, F(1, 5) = 12.99, P < 0.05; overall mean BCEA of the old PRL before training (mean = 3.74 ± 1.42 deg2) was higher than that of the new PRL after training (mean = 1.75 ± 1.59 deg2). Overall, fixation stability improved by 53%. The Fixation Target main effect was not significant, F(3, 15) = 1.75, P = 0.23. The statistical analysis revealed that there was no Condition × Fixation Target interaction, F(3, 15) = 1.33, P = 0.31; however, Fig. 3 shows only minimal improvement of fixation stability in the radial grating condition, suggesting that the analysis of variance failed to detect the interaction, most likely due to our small sample size. We would have needed a sample size of N = 10 to detect a significant interaction, for an alpha level of 0.05, effect size of 0.18 (medium), and a power of 0.8.
Means (±1 s.e.) of the BCEAs recorded when viewing different targets, before training (old location) and after training (new location).

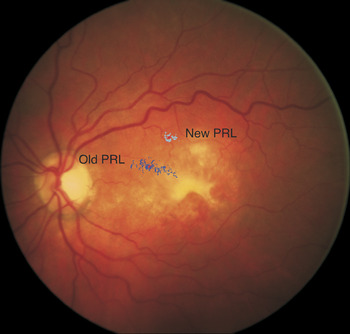
An example of a differential map analysis that shows the PRL location and fixation stability before training (old PRL) and after training (new PRL) of the same patient is shown in Fig. 4.
Differential map analysis showing fixation stability with the old PRL before training (nasal, dark blue fixation points) and with the new PRL after training (above, light blue fixation points) on the same fundus photograph (Patient 4).

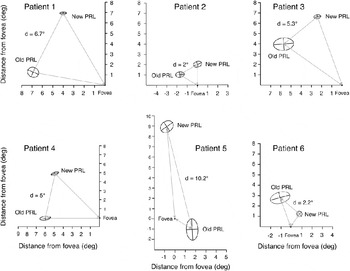
Graphical representations of the fixation stability before training (old PRL) and after training (new PRL) as well as the PRLs’ location relative to the former fovea for all patients are shown in Fig. 5. The BCEAs encompass 68.3% of all fixation points, and all dimensions are drawn to scale. Retinal images as those shown in Fig. 4 and the microperimetry examinations of all patients are shown in the supplementary material available online.
Old and new PRL BCEAs (P = 68.3) for each patient. The damaged fovea’s location was inferred from data obtained from people with normal retinae (Tarita-Nistor et al., Reference Tarita-Nistor, González, Markowitz and Steinbach2008). All dimensions are drawn to scale.

Transfer of learning to the old PRL location
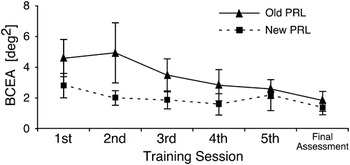
Patients were able to fixate with both the old and the new PRL locations. When asked to look at the stimulus in the MP-1, they could fixate with the trained location but also could easily use the old location as well. The use of other untrained locations was not observed. The mean BCEAs at the end of each training session and the final assessment session for the old PRL and the new PRL are plotted in Fig. 6.
Mean BCEA (± 1 s.e.) at the end of each training session and at the final assessment for the old and new PRL locations.

Two planned paired-samples t-tests were performed in order to determine whether fixation stability of the old PRL before training differs from that of the old PRL at the end of the training program (same location) and from that of the new PRL at the end of the training program (new location). The results showed that not only was the mean BCEA of the new PRL at the end of the training program significantly smaller than that of the old PRL recorded before training, t(5) = 2.89, P < 0.05, but the improvement also transferred to the old location as well: the mean BCEA of the old PRL after training was significantly smaller than it was before training, t(5) = 3.06, P < 0.05.
Reading performance before and after training
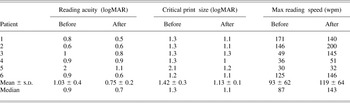
Means, s.d.s, and medians of the reading parameters before and after training are shown in Table 4. Patient 5 showed remarkable improvement in reading acuity and critical print size, which makes the medians better estimates than the means.
Changes in reading parameters as a function of training

Discussion
This study confirmed that a new PRL can be trained and consistently used for viewing different targets, fixation stability can be improved, and learning transfers to an untrained retinal location. These results highlight the plasticity of the ocular motor system in patients with central vision loss, a quality that can be used for maximizing the function of residual vision.
First, we showed that a new PRL can be trained; patients who had a PRL in an unfavorable part of the retina were able to develop a new PRL in the inferior part of the visual field using biofeedback training. This location is desirable because it allows left-to-right readers to attain the minimum visual span required for fluent reading (Nilsson et al., Reference Nilsson, Frennesson and Nilsson1998, Reference Nilsson, Frennesson and Nilsson2003; Petre et al., Reference Petre, Hazel, Fine and Rubin2000). Moreover, fixation stability could be significantly improved: fixation stability of the new PRL at the end of the program was on average 53% better than that of the old PRL at the beginning of the program.
Second, patients with central vision loss used a consistent PRL location when viewing different stimuli, and fixation stability was not affected by the type of fixation stimuli, both at the old (before training) and at the new (after training) locations. It is important to note that these targets were presented at the same viewing distance and the background luminance was the same for all stimuli. Studies have shown that patients with central vision loss may develop multiple PRLs, but it seems that this is a characteristic of patients who are in the process of losing their central vision or have done so recently (Lei & Schuchard, Reference Lei and Schuchard1997; Crossland et al., Reference Crossland, Sims, Galbraith and Rubin2004b, Reference Crossland, Culham, Kabanarou and Rubin2005) and only happens seldom in patients with long-lasting central vision loss (Reinhard et al., Reference Reinhard, Messias, Dietz, Mackeben, Lakmann, Scholl, Apfelstedt-Sylla, Weber, Seeliger, Zrenner and Trauzettel-Klosinski2007). Finally, an interesting consequence of the training was that learning transferred to the untrained location: fixation stability of the old PRL also improved, despite the fact that this location was not trained. This was a surprising result and we did not collect data to document any improvement in visual performance with the old PRL after training.
Some may argue that these improvements in ocular motor control could be coincidental, and not due to the training program per se, since a control group was not used. While this could be a limitation of our study, we find it unlikely that improvements of the magnitude reported here could happen without intervention in the course of only a few weeks in patients with long-lasting macular disease. The same can be said against the argument that the transfer of training effect really represents the overcoming of the deficit imposed by forced monocular viewing with the eye patch. The data from our enucleated patient (Patient 1, see Table 1) also argue against the idea of monocular practice as an alternative to transfer of learning. Patient 1’s BCEA with the old PRL before training was 3.56 deg2. Fixation stability with the new PRL after training produced a BCEA of 0.47 deg2 and the BCEA of the old PRL improved to 0.84 deg2—more than 4 times better than before—despite the fact that this location was never trained. Since this patient had only one eye, the improvement in fixation stability at the old location can only be explained by transference of learning.
The improvements in fixation stability and PRL relocation were accompanied by improvements in reading performance after training. The overall reading performance was significantly better after than before training. In addition, all three parameters of reading improved at the end of the program. Patients who were trained gained two lines in both critical print size and reading acuity. Their maximum reading speed increased to an average of 26 wpm or 28%. These results are in line with those of Chung et al. (Reference Chung, Legge and Cheung2004) who trained normally sighted observers to read single words at a 10 deg eccentricity in the lower and upper visual fields. After four 1.5-h training sessions, they found a 41% increase in the maximum reading speed at these eccentricities. Our findings are also in agreement with those reported by Seiple et al. (Reference Seiple, Szlyk, McMahon, Pulido and Fishman2005) who trained saccadic control in patients with age-related macular degeneration and obtained an average of a 25 wpm improvement in reading speed after eight training sessions.
The question of whether patients used the new PRL when reading is an important one but, to our knowledge, it is technologically impossible to monitor the absolute location of the PRL when one reads continuous text at a reading distance of 40 cm. We are confident, however, that the patients attempted to use the new PRL because they had to look slightly up when reading, and the experimenter visually monitored their eye position when reading performance was evaluated at the end of the training program. Yet, in the event that they did not use the new PRL, these patients still benefited from the fixation stability improvement, which transferred to the old PRL location.
The present study adds to the growing evidence that peripheral vision assumes other functions after central vision loss. Not only that most patients develop PRLs in the healthy eccentric part of the retina that serve the function of a pseudo-fovea (von Noorden & Mackensen, Reference von Noorden and Mackensen1962; Guez et al., Reference Guez, Le Gargasson, Rigaudiere and O’Regan1993; Fletcher & Schuchard, Reference Fletcher and Schuchard1997; Schuchard, Reference Schuchard2005) but also the role of peripheral vision in motion detection and spatial orientation is enhanced (Tarita-Nistor et al., Reference Tarita-Nistor, González, Markowitz and Steinbach2008). It has been suggested that these adaptive changes are driven by the plasticity in the visual system in the form of perceptual learning (Karmarkar & Dan, Reference Karmarkar and Dan2006; Huxlin, Reference Huxlin2008) or of cortical reorganization after bilateral central vision loss (Baker et al., Reference Baker, Peli, Knouf and Kanwisher2005, Reference Baker, Dilks, Peli and Kanwisher2008; Dilks et al., Reference Dilks, Baker, Peli and Kanwisher2009).
It is known that the primary visual cortex (V1) is retinotopically organized and that the cortical magnification factor is exceedingly larger at the fovea than at the periphery (Wassle et al., Reference Wassle, Grunert, Rohrenbeck and Boycott1990; Cheung & Legge, Reference Cheung and Legge2005). The question is: when older adults lose their central vision, does this part of the visual cortex become unresponsive or does a great deal of plasticity take place?
Support for the plasticity of the visual system in adults has been growing in recent years (for reviews see Gilbert, Reference Gilbert1998; Cheung & Legge, Reference Cheung and Legge2005; Karmarkar & Dan, Reference Karmarkar and Dan2006; Huxlin, Reference Huxlin2008). Yet, claims of reorganization of the primary visual cortex after central vision loss come from two functional magnetic resonance imaging studies that examined patients who had had extensive bilateral central retinal lesions for many years (Baker et al., Reference Baker, Peli, Knouf and Kanwisher2005, Reference Baker, Dilks, Peli and Kanwisher2008). When patients were shown a visual stimulus in the region of the former fovea, no activation of the cortex was observed; when the patients actually saw the stimulus with the PRL that—because of extensive retinal damage—was far in the periphery, strong activation of the foveal cortex occurred. On the contrary, the foveal cortex of normally sighted observers was vigorously activated by foveal but not by peripheral stimuli (Baker et al., Reference Baker, Peli, Knouf and Kanwisher2005, Reference Baker, Dilks, Peli and Kanwisher2008). This cortical reorganization was not evident in a patient with a horseshoe scotoma and a spared part of the central macula as the cortical area corresponding to the scotoma was silent. However, this patient did not develop an eccentric PRL because parts of the central macula were still functional, providing relatively good vision and excellent fixation stability near the fovea (Sunness et al., Reference Sunness, Liu and Yantis2004). It seems that the activation of the visual cortex corresponding to the scotoma is task specific in patients with long-lasting central vision loss, and some suggest that it may not be due to a true large-scale cortical reorganization but rather due to task-dependent cortical responses that are typically suppressed in the fully responsive V1 (Masuda et al., Reference Masuda, Dumoulin, Nakadomari and Wandell2008).
Interestingly, recent evidence supports the idea that cortical activation of these areas is not specific to the PRL. That is, the foveal cortex is activated not only by the PRL but also by other peripheral retinal locations (Dilks et al., Reference Dilks, Baker, Peli and Kanwisher2009). This activation of the foveal cortex by stimulation of the peripheral retinal areas that are not specific to the PRL could be explained not necessarily by the reorganization of the visual cortex but by the loss of lateral inhibition arising from the now unresponsive fovea. Regardless of whether the plasticity of the visual system in patients with central vision loss comes from large-scale cortical reorganization or from other mechanisms, our results bring further support that such plasticity exists.
In conclusion, we have shown that the ability of the ocular motor system to fixate is flexible in patients with central vision loss: a new PRL can be trained, fixation stability can be improved, and learning transfers to an untrained location. This property can be exploited to optimize the residual vision of patients with central vision loss.
Acknowledgments
The authors thank the two anonymous reviewers for their helpful suggestions and Linda Lillakas for her valuable comments on the manuscript. The study was supported by the CNIB EA Baker Applied Research Grant (E.G.G.); Natural Sciences and Engineering Research Council of Canada grant A7664 (M.J.S.); the Sir Jules Thorn Charitable Trust (M.J.S.); the Krembil Family Foundation (M.J.S.); Vision Science Research Program, Toronto Western Hospital; and an anonymous donor.