“Everybody seems to agree that we should be studying comprehension, but how?” (Shankweiler, Reference Shankweiler1999, p. 113). This quote captures a sentiment shared by many, although the last decade in the psychology of reading, based on the number of publications, could truly be called the decade of the psychology of reading comprehension. Part of the problem invariably stems from difficulties in characterizing reading comprehension. Standardized measures of word decoding exhibit strong and robust intercorrelations, whereas standardized measures of reading comprehension demonstrate low and inconsistent associations (Cutting & Scarborough, Reference Cutting and Scarborough2006). This heterogeneity in measurement highlights the complexity of reading comprehension, a complexity that makes quantification at the cognitive level difficult and is thought to introduce heterogeneity at the genetic level of analysis.
Variability in word decoding is substantially heritable, ranging from 0.65 (Harlaar, Spinath, Dale, & Plomin, Reference Harlaar, Spinath, Dale and Plomin2005) to 0.85 (Gayán & Olson, Reference Gayán and Olson2003), a widely replicated finding (for a review, see Grigorenko, Reference Grigorenko2004). Individual differences in reading comprehension also appear to be heritable, but there are far fewer genetically informed studies of comprehension, and the obtained heritability estimates tend to be lower than those of word decoding (e.g., Betjemann et al., Reference Betjemann, Willcutt, Olson, Keenan, DeFries and Wadsworth2008; Keenan, Betjemann, Wadsworth, DeFries, & Olson, Reference Keenan, Betjemann, Wadsworth, DeFries and Olson2006). Notwithstanding the inconsistency in methods and assessments mentioned above (see also Cain & Oakhill, Reference Cain and Oakhill2006b; Keenan, Betjemann, & Olson, Reference Keenan, Betjemann and Olson2008), heritability for reading comprehension has been estimated at 0.50–0.76, with 27%–94% of this genetic variance shared with measures of word decoding (Betjemann et al., Reference Betjemann, Willcutt, Olson, Keenan, DeFries and Wadsworth2008; Byrne et al., Reference Byrne, Samuelsson, Wadsworth, Hulslander, Corley and DeFries2007, Reference Byrne, Coventry, Olson, Samuelsson, Corley and Willcutt2009; Keenan et al., Reference Keenan, Betjemann, Wadsworth, DeFries and Olson2006). A recent meta-analysis of behavior–genetic studies of reading comprehension has resulted in the estimate of narrow-sense heritability at 51%, with shared and nonshared environment accounting for ~24% of the variance in comprehension of each. It was stressed, however, that these estimates vary dramatically across countries, studies, and assessments (Pasisz & Schatschneider, Reference Pasisz and Schatschneider2010).
Despite the tight connection between words and text, decoding words is not equivalent to appreciating Goethe. It is recognized that reading comprehension (and the quality of lexical processing) is influenced by a variety of cognitive processes ranging from relatively low-level processes (i.e., working memory; Engle, Cantor, & Carullo, Reference Engle, Cantor and Carullo1992) to relatively high-level processes (i.e., inferencing; Gernsbacher & Faust, Reference Gernsbacher and Faust1991). Deficient comprehension might result from one of many weaknesses operating in isolation or in combination (Cain & Oakhill, Reference Cain and Oakhill2006a). It is typical, however, that the fluency and accuracy of single-word lexical processing is a prerequisite of comprehension; success with text begins with the single word (Perfetti & Hogaboam, Reference Perfetti and Hogaboam1975). There is recognition, however, of the differentiation of typical and atypical developmental pathways. Whereas in typically developing individuals, indicators of word decoding generally highly correlate with indicators of reading comprehension, in atypically developing individuals, these indicators might demonstrate a substantial level of discrepancy, for example, individuals with “hyperlexia” are characterized by the presence of a pronounced gap between a higher level of word decoding and a lower level of reading comprehension (Grigorenko et al., Reference Grigorenko, Kiln, Pauls, Sent, Hooper and Volkmar2002; Grigorenko, Klin, & Volkmar, Reference Grigorenko, Klin and Volkmar2003).
Yet, single-word decoding, although a prerequisite for comprehension, is itself a complex process emerging in the foundation of many other psychological processes (for a brief list, see Grigorenko et al., Reference Grigorenko, DeYoung, Getchell, Haeffel, af Klinteberg and Koposov2007). These other processes, typically described as sublexical, underlie the emergence of reading, which is a lexically based skill. This transition from sublexical to lexical processing appears to be faulty in disorders of reading acquisition (Zoccolotti et al., Reference Zoccolotti, de Luca, di Pace, Gasperini, Judica and Spinelli2005). Modern models of reading acquisition (e.g., Seidenberg, Plaut, Petersen, McClelland, & McRae, Reference Seidenberg, Plaut, Petersen, McClelland and McRae1994) assume there are two major types of such sublexical processing, phonological and orthographic. At the level of the single word, phonological processes are typically captured by the task of word naming and orthographic processes, that is, lexical decision (LD). It has been observed that a LD heavily engages lexical knowledge, whereas a naming task does not (Martens & de Jong, Reference Martens and De Jong2006). Given that lexical knowledge is central to comprehension (Perfetti, Reference Perfetti2007), it is reasonable to assume that performance of an LD task might be equally or more predictive of performance of a reading comprehension task than performance of a word naming task (Holmes, Reference Holmes2009; Michael, Reference Michael2009). In summary, reading comprehension is a complex trait that assumes that multiple lower-level processes have been developed to support the emergence of reading comprehension. For typical developmental trajectories, indicators of all these processes tend to correlate with indicators of reading comprehension. Atypical developmental trajectories, however, could be characterized by peaks, valleys, and abysses among indicators of various comprehension-contributing processes, such that a lower level of comprehension may result from various patterns of deficiencies in processes, as per the principle of equifinality.
In response to the difficulty of the genetic analysis of complex traits, the endophenotype approach was developed and has gained considerable traction in the past few years (Gottesman & Gould, Reference Gottesman and Gould2003). Endophenotypes are traits that are thought to be intermediate to complex neuropsychiatric disorders, simpler, and “closer” to the underlying biological deficits, thus making them more amenable to identification and localization in genetic studies (Almasy & Blangero, Reference Almasy and Blangero2001; Iacono & Malone, Reference Iacono and Malone2011; Kendler & Neale, Reference Kendler and Neale2010; Peterson & Weissman, Reference Peterson and Weissman2011). Studies of a number of neuropsychiatric disorders have utilized the endophenotype approach (e.g., on P50 inhibition in schizophrenia, see Aulchenko & Struchalin, Reference Aulchenko and Struchalin2009; Freedman et al., Reference Freedman, Coon, Myles-Worsley, Orr-Urtreger, Olincy and Davis1997; on inhibitary control in ADHD, see Goos, Crosbie, Payne, & Schachar, Reference Goos, Crosbie, Payne and Schachar2009; on duration discrimination in ADHD, see Himpel et al., Reference Himpel, Banaschewski, Gruttner, Becker, Heise and Uebel2009; on motor inhibition in obsessive–compulsive disorder, see Morein-Zamir, Fineberg, Robbins, & Sahakian, Reference Morein-Zamir, Fineberg, Robbins and Sahakian2010; on N400 in alcoholism, see Roopesh et al., Reference Roopesh, Rangaswamy, Kamarajan, Chorlian, Pandey and Porjesz2010). The appeal of endophenotypes stems from the apparent simplicity of the concept. Genes for complex traits are difficult to localize because many of them may be contributing differentially across individuals; an endophenotype is a simpler trait, a “building block” of the deficit, presumably influenced by fewer genes that are easier to identify. Endophenotypes should not only be influenced by fewer genes than complex traits, but it is critical that these genes must also influence the complex trait under investigation, although other genes might also contribute to this trait (Kendler & Neale, Reference Kendler and Neale2010). Otherwise, an endophenotype that does not share genes with the complex trait, although it might be related to it, is simply a specific case of the phenomenon that virtually all traits are heritable (Johnson, Turkheimer, Gottesman, & Bouchard, Reference Johnson, Turkheimer, Gottesman and Bouchard2009); thus, such a trait cannot be considered an endophenotype.
The problem then appears to be identifying endophenotypes. The field has reached something of a consensus in assigning general requirements for putative endophenotypes (Crosbie, Perusse, Barr, & Schachar, Reference Crosbie, Perusse, Barr and Schachar2008; de Geus, Wright, Martin, & Boomsma, Reference de Geus, Wright, Martin and Boomsma2001; Glahn et al., Reference Glahn, Curran, Winkler, Carless, Kent and Charlesworth2012; Gottesman & Gould, Reference Gottesman and Gould2003; Smit et al., Reference Smit, Boersma, van Beijsterveldt, Posthuma, Boomsma and Stam2010). Namely, endophenotypes (a) are lower-level processes (i.e., as basic a characteristic of a particular process as possible), (b) demonstrate reliable within-age individual differences, (c) show an empirical association with performance on the targeted task (e.g., reading comprehension) that is also theoretically meaningful, (d) are heritable, and (e) have a strong genetic correlation with the targeted task. However, despite the widespread adoption of the endophenotype approach at the conceptual level (Ritsner, Reference Ritsner2009), the details of its implementation and specific recipes on how to pick an endophenotype among many phenotypes are still being discussed (Flint & Munafo, Reference Flint and Munafo2007; Glahn et al., Reference Glahn, Curran, Winkler, Carless, Kent and Charlesworth2012; Kendler & Neale, Reference Kendler and Neale2010; Meyer-Lindenberg, Reference Meyer-Lindenberg2010).
Reading comprehension is a complex, heritable trait that exhibits significant variability and relies on multiple cognitive processes. Deficits in reading comprehension are present in many developmental disorders (Ricketts, Reference Ricketts2011; van den Bos, Nakken, Nicolay, & van Houten, Reference van den Bos, Nakken, Nicolay and van Houten2007; Verhoeven & Vermeer, Reference Verhoeven and Vermeer2006), although their etiology might be variable. In contrast, LD is a prototypically simple (or at least simpler, compared to comprehension) trait requiring only lexical access. Yet, LD has also been investigated as a source of group differences between individuals with and without developmental disorders (de Jong et al., Reference de Jong, Van De Voorde, Roeyers, Raymaekers, Oosterlaan and Sergeant2009; Grossman, Bemis, Skwerer, & Tager-Flusberg, Reference Grossman, Bemis, Skwerer and Tager-Flusberg2010; Rutherford, Reference Rutherford2006; Stewart & Ota, Reference Stewart and Ota2008). In this article, we investigate whether LD is a suitable endophenotype for reading comprehension and test this hypothesis by determining to what extent LD and reading comprehension appear to have common genetic etiology. Although this investigation is carried out using an unselected sample of children and their families, the implications of this work are important for considering LD an endophenotype for comprehension difficulties in a variety of developmental disorders.
Study Objectives
Capitalizing on the literature linking reading comprehension and LD, we used a genetically informative design to evaluate LD as an endophenotype for comprehension. First, phenotypic correlations between comprehension and LD were obtained, with and without age and gender as covariates. Second, heritability coefficients were estimated for both comprehension and LD. Third, an investigation of the probable patterns of familial transmission of comprehension and LD indicators was carried out; that is, we estimated the number of major genes contributing to reading comprehension and LD and the effect sizes of these genes.
As indicated above, the utilization of the concept of endophenotypes sets up specific requirements. Thus, we investigated whether LD met the requirements to serve as an endophenotype for comprehension. Specifically, we hypothesized that indicators of LD demonstrate a wide range of individual differences, which, in turn, predict individual differences in reading comprehension. Moreover, we predicted that both LD and reading comprehension are heritable and that the heritability of LD is greater than that of reading comprehension. Finally, we hypothesized that LD and reading comprehension “share” genes, and that LD is influenced by fewer genes overall than reading comprehension.
Methods
Participants
The sample consisted of children attending Grades 1–7 in public schools in a middle-sized city in Russia. The sample constituted a normative, community-based sample of reading skills in the general population of Russian speakers. It was ascertained through children whose families were invited to participate, and consenting families were assessed. Altogether, the sample included 502 children aged 7–13 years (mean = 9.6, SD = 1.2), consisting of 243 (48%) boys and 259 (52%) girls, clustered in 488 families (14 families had 2 children eligible to participate in the study, the remaining families had only 1 eligible child). In these families, at least 1 parent or adult caregiver was assessed. Altogether, we worked with 483 mothers (aged 24–52, mean = 33.9, SD = 5.2) and 345 fathers (aged 22–61, mean = 35.7, SD = 5.6). We also assessed 3 grandmothers (aged 53–65, mean = 62.2, SD = 7.7) and 6 grandfathers (aged 53–58, mean = 58.7, SD = 7.7). Overall, there were 350 complete families (with both parents and at least 1 child assessed) and 138 incomplete families (with at least 1 adult relative and 1 child assessed). Of the incomplete families, 5 families had fathers but not mothers, 132 families had mothers but not fathers, and 1 family had grandparents but not parents. Given that the statistical software utilized here are suitable for all kinds of family constellations and pedigree structures and can take into account all types of relatives, all 488 families were included in the analyses. Thus, the total number of consenting participants in this sample was 1,339.
Materials
Comprehension
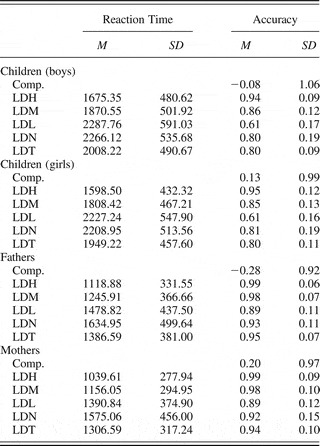
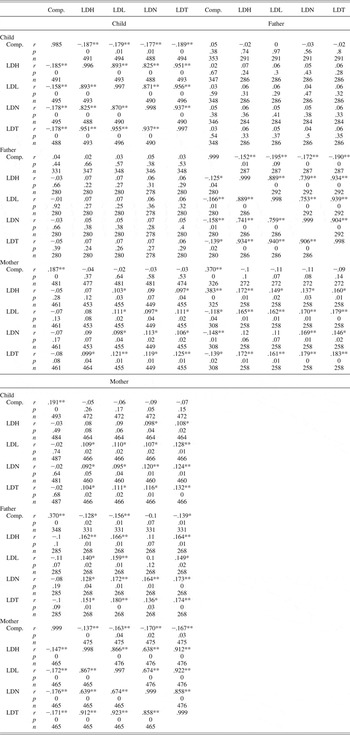
Comprehension was assessed with overlapping sets of 11 connected text paragraphs with 43 comprehension questions (multiple-choice and open-ended, factual and inferential), varying in difficulty for children, adolescents, and adults (Grigorenko et al., Reference Grigorenko, DeYoung, Getchell, Haeffel, af Klinteberg and Koposov2007). A selected subset of paragraphs overlapped in adjacent age-appropriate sets, so that all responses could be scaled using the same ability scale (Dorans, Pommerich, & Holland, Reference Dorans, Pommerich and Holland2007; Loyd & Hoover, Reference Loyd and Hoover1980). Participants read a series of age-appropriate paragraphs and were asked questions probing content. We counted the number of correct responses and then obtained ability scores using the item response theory methodology (Bond & Fox, Reference Bond and Fox2001; Rasch, Reference Rasch1960; Smith & Smith, Reference Smith and Smith2005). All materials were presented in Russian. The descriptive statistics of these scores are presented in Table 1. To control for possible age and gender effects, we used these two indicators as covariates. Table 2 presents correlations for all variables, both unadjusted and adjusted for age and gender.
Descriptive statistics for comprehension and lexical decision for children and adults

Note: Comp., comprehension, LDH, lexical decision high frequency; LDM, lexical decision medium frequency; LDL, lexical decision low frequency; LDN, lexical decision nonwords; LDT, lexical decision total mean reaction time reflects correct responses for word and nonword stimuli.
Family correlations (Pearson r) for lexical decision and reading comprehension measures
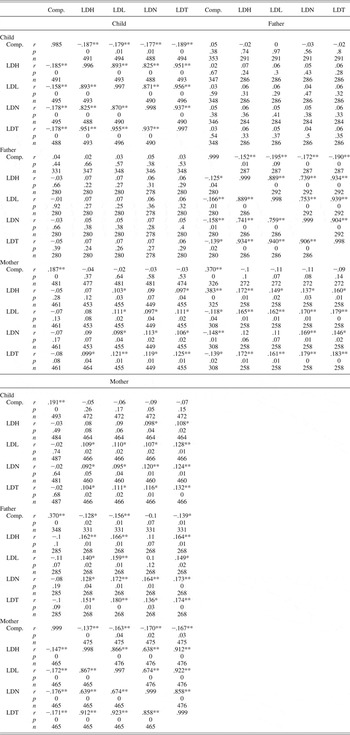
Note: n, number of data points for a particular analysis; Comp., comprehension; LDH, lexical decision high frequency; LDM, lexical decision medium frequency; LDL, lexical decision low frequency; LDN, lexical decision nonwords; LDT, lexical decision total. Correlations are shown for both unadjusted (below the diagonal) and age- and gender-adjusted (above the diagonal) variables.
*p < .05. **p < .01, indicates significant correlation.
LD
Visual LD is the dominant paradigm used for studying visual word recognition because it is both simple and flexible. A participant is presented with a string of letters and the participant must decide whether or not the string is a real word as quickly as possible. Response times in LD tasks reflect characteristics of both the stimuli and the test taker. Characteristics of the stimuli, notably frequency or the wordlikeness of nonwords influence response times, as do the vocabulary and reading skill of the test taker.
In this study, the stimuli were single letter strings presented on a computer screen using E-Prime experiment presentation software from Pychology Software Tools. All stimuli were presented in Russian. Participants were seated facing a computer screen with a computer keyboard in front of them. Each participant completed 90 trials. Each session contained 30 nonwords and 60 words. The words varied in length (two and three syllables); there were 15 nonwords and 30 words of each length. The nonwords were generated so that all letter/sound combinations were permissible in Russian. The words were further divided by frequency (high, medium, and low) and regularity (regular and irregular), using conventional Russian frequency dictionaries. Thus, there were 10 words for each of the six frequency-by-regularity combinations. Each participant saw each word only once. The order of the stimuli was random for each participant.
Participants were asked to press the “z” key for a word response and the “/” key for a nonword response. The task ended after the participant reached the end of the word list. Response times were excluded from the experiment if they exceeded 4 s or were shorter than 400 ms (Ratcliff, Reference Ratcliff1993). The relatively long cutoff was chosen for two reasons: (a) because this was a normative sample, and our goal was to understand the etiology of LD response time, we only excluded the longest 5% of response times across all participants; and (b) there is some evidence that the long tail of response times may be psychologically informative (Schmiedek, Oberauer, Wilhelm, Suss, & Wittmann, Reference Schmiedek, Oberauer, Wilhelm, Suss and Wittmann2007), particularly regarding individual differences (Gilden & Hancock, Reference Gilden and Hancock2007; Gilden, Thornton, & Mallon, Reference Gilden, Thornton and Mallon1995).
Analyses of the data revealed no effect of regularity of the spelling to sound mapping on response time, which was not unexpected, because regularity effects have been shown to be transient and dependent on experimental manipulations (Gernsbacher, Reference Gernsbacher1984). Note that, although errors were recorded, given the substantial range of ages in our sample (7–65) and corresponding age biases in the distribution of accuracy (following recommendations in the literature; Coltheart, Rastle, Perry, Langdon, & Ziegler, Reference Coltheart, Rastle, Perry, Langdon and Ziegler2001), accuracy indicators were not utilized in these analyses. As a result, only five indicators were generated for the LD task: average response time for words of different frequencies (high, medium, and low), average response time for nonwords, and an average response time across all stimuli. Similar to the comprehension indicator, Table 1 presents descriptive statistics for unadjusted variables and Table 2 contains correlations for both unadjusted (below the diagonal) and age- and gender-adjusted (above the diagonal) variables.
Resulting phenotypes
Our preliminary analyses of the data resulted in six indicators: comprehension and response times for LD for high (LDH), medium (LDM), and low-frequency words (LDL); nonwords (LDN); and all stimuli (LDT). These indicators were used in the analyses below.
Statistical analyses
The goal of this study was to evaluate the suitability of LD indicators as endophenotypes for reading comprehension. First, phenotypic correlations among the indicators of comprehension and LD were obtained, with and without covarying age but without gender. Second, heritability coefficients were estimated for indicators of comprehension and the LD task; genetic correlations among these variables were also estimated. Third, an investigation of the probable patterns of familial transmission of comprehension and LD indicators was conducted. These segregation analyses allowed us to quantify the number of genes involved in the transmission of the trait of interest across generations, and the magnitudes of the effects of these genes.
Heritability estimates
Heritability estimates were obtained for each phenotype using two software packages: SOLAR (Almasy & Blangero, Reference Almasy and Blangero1998) and LOKI (Heath, Reference Heath1997; Heath, Snow, Thompson, Tseng, & Wijsman, Reference Heath, Snow, Thompson, Tseng and Wijsman1997).Footnote 1 SOLAR reports what is called “narrow-sense” heritability, which is the proportion of phenotypic (i.e., trait) variance that is attributable to additive genetic variance alone. LOKI reports what is called “broad-sense” heritability, which is the proportion of phenotypic variance that is attributable to both additive and dominant genetic variance.Footnote 2 Both LOKI and SOLAR allow the estimation of heritability based on family data of the kind we collected in this study (i.e., child–parent and other relative data from nuclear and small extended families). It is thought that these estimates represent the upper bounds for heritability estimates because it is possible that they are inflated by the contributions of family shared environment. Nevertheless, both pieces of software are widely used in genetic studies of complex disorders with family data, and the corresponding estimates of heritability are considered informative.
Segregation analysis
In addition to estimating the overall magnitude of genetic influences using heritability estimates, we were also interested in investigating modes of genetic transmission that might explain the familial aggregation of comprehension and LD indicators. The methodology for these analyses was adopted from published work (Hsu, Wijsman, Berninger, & Thomson, Reference Hsu, Wijsman, Berninger and Thomson2002; Wijsman et al., Reference Wijsman, Peterson, Leutenegger, Thomson, Goddard and Hsu2000). Specifically, we used the oligogenic segregation analysis Bayesian approach through the Markov chain Monte Carlo (MCMC) algorithm implemented in the LOKI software (Daw, Heath, & Wijsman, Reference Daw, Heath and Wijsman1999).
In general, segregation analyses permit an investigation of the vertical familial transmission of the phenotype of interest; oligogenic segregation analyses allow for the modeling of such patterns of familial transmission, including both genetic and environmental factors. In this approach, it is assumed that the phenotype is related to an additiveFootnote 3 combination of the effects of the environmental covariates and genetic influences modeled through quantitative trait loci (QTL). The phenotypes and covariates are measured, whereas the parameters, including covariate effects, the number of QTL, and their specific effects, are estimated. Specifically, LOKI uses reversible jump MCMC techniques to incorporate moves that change the numbers of QTL and the parameters in the model. Each iteration contributes to the estimates of posterior probabilities. Thus, the estimation involves a stochastic element requiring many iterations, so that the probabilities of the competing models generated during the MCMC iterations can be estimated and compared. For our purposes, we were most interested in the estimates of how many QTLs contributed to each trait, and how much genetic variance each QTL contributed.
Despite the complexity of how LOKI goes about it, what LOKI does is rather simple. Given a data set of families and phenotypic data, LOKI estimates the number of genes and the effect sizes of these genes. The program starts out by proposing a putative QTL of a given effect size, estimates the probability of the data given the current QTL parameters and proposed model, and uses this as part of the decision as to whether or not to accept the proposed model parameters. The first proposal is usually not very good, so the next proposal might add another QTL, change the effect of the putative QTL, or both. This process of proposal, probability calculation, and revised proposal constitutes an iteration, and LOKI runs tens of thousands of iterations to estimate the posterior density of the underlying genetic model.
In these analyses, we used 25,000 iterations; each iteration contributed to the estimates of posterior probabilities. Test runs between 1,000 and 2 million iterations were investigated prior to these analyses and 25,000 iterations were found to be more than sufficient for a successful mixture and “burn-in” of a Markov Chain (Wijsman & Yu, Reference Wijsman and Yu2004). Bayesian statistical approaches require the specification of a prior distribution for each of the estimated parameters. Although there is an option in which one specifies prior distributions for virtually all of the model parameters in LOKI, with a sufficiently informative data set these priors have little impact in practice on the posterior distribution. Specification of parameters in the prior distributions required for Bayesian analyses was done following previously developed procedures (Wijsman et al., Reference Wijsman, Peterson, Leutenegger, Thomson, Goddard and Hsu2000). All of the analyses presented here used the default prior specifications for number of genes, trait mean, and variance as specified in the LOKI documentation.
As Wijsman and Yu (Reference Wijsman and Yu2004) previously demonstrated, the results are insensitive to the choices of these prior parameters. However, there is one parameter that can have a considerable effect. This parameter, tau beta, determines the effect size of the genes influencing the trait of interest, or the amount of genetic variance that the sampler will posit for putative genes. In other words, when LOKI is proposing to add a new gene to the model (whether it is the first gene or any new additional gene), the effect size of the proposed gene is set by the tau beta parameter. Misspecification of tau beta may result in misspecification of the model. Thus, finding a range of tau beta(s) in which the results are robust and consistent is important. The preferred approach (Wijsman & Yu, Reference Wijsman and Yu2004) is to run multiple tau beta(s) and compare the runs while gradually increasing the prior distribution of tau beta until the number of genes and estimated heritability plateau and begin to drop off. In addition, Wijsman and Yu advocate a cutoff for genes with an effect size less than 5%–10% of the total genetic variance. Their justification is that for genes with very small effect sizes (i.e., 1% of the total genetic variance), the related estimates are unlikely to be reliable. We used, therefore, an effect size cutoff of 5%.Footnote 4 Thus, by running multiple tau beta(s), the robustness and stability of the obtained solution/model of the data can be evaluated. A set of posterior parameters that remains fairly stable across multiple iterations and multiple tau beta(s) provides further support for the stability of the solution in the face of multiple priors.
Power analysis
To investigate the power of other samples to identify and distinguish the presence of shared and nonshared genetic contributions to complex traits, a simulation study was conducted. As per the results, two traits of moderate broad-sense heritability (~50%), which is a common estimate in the field (Grigorenko, Reference Grigorenko2004), were simulated using the structure of the pedigrees from this sample. Two scenarios were investigated. In the first scenario, two traits were controlled, in the presence of a polygenic component, by four genes each (i.e., each gene contributed no more than 12.5% of the genetic variance, linearly and interactively), two of which overlapped and two of which did not. In the second scenario, there are no overlaps between the four genes controlling each of the two traits. We simulated six data sets (n = 31, 162, 330, 497, 660, and 995 families) across a range of possible contributing genes (zero to four) and a range of tau beta parameters. The analyses delineated above (i.e., the estimation of the number of genes involved in the trait) were completed 25,000 times for each combination of parameters and for each model. We established that for the univariate model, the smallest sample size (n = 31) underestimates the number of genes involved in the trait, but the modest sample size of 162 families was sufficient and as effective as the sample size of 1,000 families. For the covariate models, a range of observations were made. The most informative of these in the context of our work were the following: (a) with the number of families greater than 30 (and fewer then 162), the models with zero and three overlapping genes are easily distinguishable; (b) to distinguish the “intermediate” models (i.e., one and two overlapping models) from each other or from the no-overlap (zero genes in common) and substantially overlapping (three genes in common) models the sample size of 330+ families is adequate (the stability across a range of tau betas improves with greater sample size).
Results
The data presented in Table 1 adhere to well-established patterns in the literature (Cirrin, Reference Cirrin1984; Morrison & Ellis, Reference Morrison and Ellis1995). Specifically, children's response times are slower than those of adults. However, the age effect is not linear. The correlations with age and the selected phenotypes for the entire sample are as follows: comprehension, –.031 (p = .262); LDH, –.568; LDM, –.592; LDL, –.619; LDN, –.507; and LDT, –.586 (all ps = .000). However, for children it is comprehension, –.204 (p = .000); LDH, –.156 (p = .001); LDM, –.135 (p = .003); LDL, –.109 (p = .015); LDN, –.143 (p = .002); and LDT, –.134 (p = .003); for adults it is comprehension, –.086 (p = .066); LDH, –.026 (p = .479); LDM, –.034 (p = .364); LDL, –.055 (p = .135); LDN, –.013 (p = .733); and LDT, –.039 (p = .298). For the LD task, adult females were quicker than males (paired t test ps = .001, .000, .005, .117, and .003, for LDH, LDM, LDL, LDN, and LDT, respectively), but the boys did as well as the girls (no ps < .05). The accuracy rates were approximately the same across both genders. Comprehension was also stronger in females (ps = .000 and .021 for females and girls, respectively). The table also shows pronounced word frequency effects. Specifically, it takes longer to respond to low frequency words; however, responses to nonwords were comparable to responses to lower-frequency words. Adult responses also increased, with the nonwords taking the longest time to process. It is also worth noting the pattern of accuracy indicators for the LD task. There were virtually no errors in decision accuracy for high-frequency words for both children and adults. Children's accuracy correlated with word frequency, with the lowest accuracy being observed for low-frequency words (61%). The adult accuracy levels, however, were high and demonstrated little variability, with the lowest level at 89% for low-frequency words. Given such limited variability in adult accuracy on the LD measures, and in accordance with the literature (Coltheart et al., Reference Coltheart, Rastle, Perry, Langdon and Ziegler2001; Seidenberg, Peersen, MacDonald, & Plaut, Reference Seidenberg, Peersen, MacDonald and Plaut1996), the subsequent analyses were carried out only on time, not accuracy, measures.
Correlational analyses
Table 2 presents correlations among the variables in this study, both unadjusted and adjusted for age and gender. A number of observations are of interest here. First, the pattern of correlations among the unadjusted and adjusted variables is very similar, indicating the stability of the relationships among variables. Second, for all three groups of participants (children, fathers, and mothers), there are robust significant negative correlations between indicators of LD reaction time and comprehension scores. LD latencies become shorter as comprehension increases, and the results are similar to those presented in the literature on LD. Third, familial correlations are of interest. For comprehension, the correlation between the performance of fathers and their children is not significant, but it is significant for mother–child pairs. None of the LD indicators correlate significantly between fathers and children, but there is a positive, although not substantial, pattern of correlations between LD indicators of mothers and children. Note, however, that indicators of both comprehension and LD correlated consistently and substantially for pairs of mothers and fathers. Using SOLAR, genetic correlations between the comprehension and LD indicators were estimated. Of the five estimated correlations (i.e., comprehension-LDH, comprehension-LDM, comprehension-LDL, comprehension-LDN, and comprehension-LDT), none were significantly different from 0.
Heritability estimates
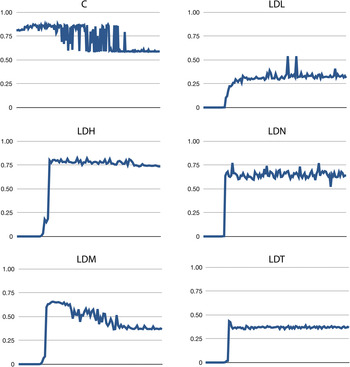
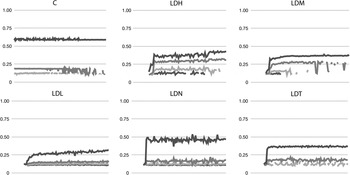
As indicated above, both narrow- and broad-sense heritability coefficients were estimated. (Broad-sense heritability estimates are depicted in Figure 1.) As anticipated, narrow-sense heritability estimates correspond to the magnitude of child–father and child–mother correlations shown in Table 2. These estimates are fairly low and range from 0.12 for LDH to 0.21 for comprehension, but they all are statistically different from 0. The broad-sense heritability estimates are substantially higher. Their values range across multiple tau(s), but they stabilize so that they range from 0.28 (for LDL) to 0.75 (for LDH). These coefficients are higher than what is implied by the correlations shown in Table 2; these heritability estimates presumably reflect dominant and overdominant effects of genes controlling these traits for each other. The greater values of broad-sense heritability estimates indicate the presence of substantial nonlinear effects (i.e., dominance and overdominance).
Broad-sense heritability estimates for comprehension and lexical decision. The x axis is not to scale and represents the increasing tau beta parameter. Each point is the mean heritability estimate for an analysis of 25,000 iterations. C, comprehension; LDL, lexical decision low frequency; LDH, lexical decision high frequency; LDN, lexical decision nonwords; LDM, lexical decision medium frequency; LDT, lexical decision total mean reaction time. [A color version of this figure can be viewed online at http://journals.cambridge.org/dpp]

Segregation analyses
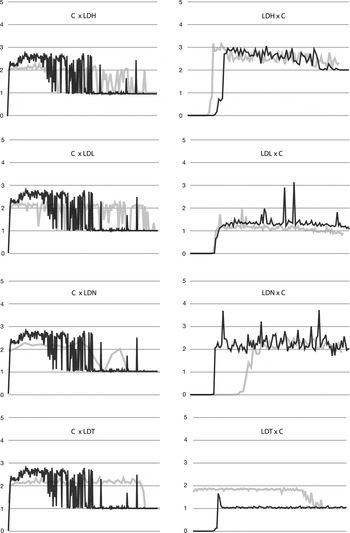
The segregation analysis methodology used here estimates the number and effect sizes of putative genes involved in the genetic control of a trait of interest. Two sets of analyses were conducted. In the first set of analyses, the number of genesFootnote 5 putatively controlling each of the investigated traits was evaluated. The results of these analyses are shown in Figure 2 in black. Thus, the left panel of Figure 2 shows that the number of genes that appear to be controlling the trait of comprehension is estimated at one to two. These estimates are obtained across multiple tau beta(s). The right panel of Figure 2 shows that the number of major genes controlling different chronometric indicators of the LD task is variable (in black). It appears that two to three major genes are involved in the genetic control of LDH, one to three major genes are involved in the genetic control of LDM, one to three major genes control LDL, two to four major genes control LDN, and one to two genes generate genetic variability in LDT. Interpreting the LD analyses as a whole, it could be said that the estimates vary between one and four genes but, on average, they converge on two to three genes.
Number of genes estimated to control each of the six traits, when traits are investigated independently and when a different correlated trait is covaried out. The left column is lexical decision reaction times covarying for comprehension, and the right is comprehension covarying for lexical decision times. Black represents the original and gray the covariate models. C, comprehension, LDH, lexical decision high frequency; LDL, lexical decision low frequency; LDN, lexical decision nonwords; LDT, lexical decision total mean reaction time.

The second set of analyses was done with the same six phenotypes, but now the analyses for the phenotype of interest were carried out with the second phenotype used as a covariate. By including a covariate phenotype, we can “subtract” those genes that are common to both traits, and only those that are unique to the first trait will remain; by running sets of analyses with and without covariates, we can estimate how many genes are shared between a pair of traits. For example, the left panel of Figure 2 shows the number of genes that control for comprehension when indicators of LD are covaried out (shown in gray). These analyses intend to investigate whether there are shared genes that exert their influence on both phenotypes (comprehension and LD). Specifically, if the same genes influence the phenotypes of comprehension and LD, then when comprehension is analyzed in the presence of LD, indicators the gray line will drop to 0, showing that only shared genes control comprehension and LD, and that there are no specific genes that contribute to the genetic variance of only one trait. As shown in gray, however, these analyses indicated that the indicators of both comprehension and LD do not appear to have any genes in common. When comprehension is controlled for LD (left panel) and LD is controlled for comprehension (right panel), the estimated number of genes contributing to the genetic variance of the trait of interest (either comprehension or LD) does not appear to change noticeably, suggesting that there are no shared major gene effects between reading comprehension and LD. Again, this observation is true for a range of tau beta(s), attesting to the robust nature of these findings. Second, there are instances (e.g., LDM and LDN) where the model estimates more genes in the covariate condition. This is to be expected in situations where there is a phenotypic, but not genetic correlation between the traits; the presence of such environmental effects inflates the variability in the trait to the extent that more genes are now required to explain this variability.
There are also two general methodological points to be made from these graphs. The first is the increasing number of genes and the slowly decreasing plateau as the tau beta increases. The peak is the optimal tau beta, and the slow decline indicates that the tau beta(s) are getting progressively too big for the sampler to accept. This is in line with the recommendations for specifying parameters in LOKI, and indicates that the range of tau beta(s) examined was sufficient for the data set (Wijsman & Yu, Reference Wijsman and Yu2004). The second observation is that although the overall relationship between the models with and without covariates is consistent across tau beta(s), any two runs with a particular tau will exhibit some randomness, with one being higher than the other. To ensure that the results were not the product of chance, it was necessary to compare the results across hundreds of tau beta(s) for a given model: any one pair of tau beta(s) might lead to inconsistent results. In the second set of analyses, we estimated the magnitudes of the effects of the genes involved in the control of each of the traits. The results of these analyses are shown in Figure 3. The y axis indicates the total genetic variance for the trait. Like the analyses presented earlier, these estimates were obtained across multiple tau beta(s) with each horizontal line representing a putative gene. These analyses capture the additive contribution of each of the genes detected by LOKI to the total genetic variance in the trait. Based on the details presented in Figure 3, it appears that there is a substantive-effect gene contribution to comprehension (with one or two other genes of minor effects), and there are small-effect (<0.20) and moderate-effect (0.25–0.50) gene contributions to LD response time.
The estimated magnitude of effects of the contributing genes (shown in different shades of grey) to the traits of interest. C, comprehension, LDH, lexical decision high frequency; LDM, lexical decision medium frequency; LDL, lexical decision low frequency; LDN, lexical decision nonwords; LDT, lexical decision total mean reaction time.

Discussion
In this study, using a genetically informative design, we investigated the phenotypic and genetic relatedness among reading comprehension scores and LD reaction time in an unselected sample of children and their families. A few aspects of our investigation warrant discussion.
Note that in these data there is a robust (i.e., significant and reliable), although not very strong (4%–5% of the variance), correlation between comprehension and LD reaction time. This correlation is present for both children and adults, for males and females, for words of various frequencies, and for nonwords. This finding is not unexpected and is theoretically linked to other work in the field (Perfetti, Reference Perfetti2007). To our knowledge, however, there is not a great deal of empirical data in the literature estimating shared variance between LD and reading comprehension with which these findings can be compared. Previously results indicated no substantial correlation between LD and comprehension in English, although there were associations between LD and presudoword/word processing, which in turn predicated comprehension (e.g. Katz et al., Reference Katz, Brancazio, Irwin, Katz, Magnuson and Whalen2012). It is also should be noted that there is a body of literature that has consistently failed to find relationships between tasks such as simple response time and reading ability (Stringer & Stanovich, Reference Stringer and Stanovich2000).
It is interesting that the profile of familial correlations indicates a rather tangential association between reading comprehension and LD in parents and children. Although weak, it is detectable for mother-child pairs; it is not statistically significant for father–child pairs. This finding needs to be substantiated further because it has been suggested in the literature that the psychological texture of LD can vary depending on the stage of reading acquisition (Gijsel, Van Bon, & Bosman, Reference Gijsel, Van Bon and Bosman2004). It is interesting, however, that reading comprehension and LD correlate between parents rather strongly, suggesting either the presence of assortative mating or convergence for these markers of reading and lexicality. These findings are perhaps of no surprise, given the literature on spousal similarity on a variety of cognitive characteristics (Mascie-Taylor, Reference Mascie-Taylor1989).
Nonetheless, although familial correlations might not be high, the estimated heritability coefficients are statistically significant for all phenotypes. The range of heritability estimates obtained for comprehension (0.20–0.60) is comparable to those in the literature (Pasisz & Schatschneider, Reference Pasisz and Schatschneider2010). To our knowledge, there are no published heritability coefficients for LD reaction time, but the range of the coefficients presented here is comparable to those presented for various chronometric indicators of cognitive tasks (Neubauer, Spinath, Riemann, Angleitner, & Borkenau, Reference Neubauer, Spinath, Riemann, Angleitner and Borkenau2000). It is also important to mention that, for all of the investigated indicators, the broad-sense heritability estimates appear to be higher than the narrow-sense heritability estimates, indicating the potential importance of the nonlinear effects characteristic of the genetic forces controlling these traits.
Moreover, there are three observations generated by the segregation analyses. First, the findings suggest that there are more genes (or QTLs or sources of genetic variation) involved in the control of LD than in the control of comprehension. Second, there is evidence for major gene effect(s) in comprehension, but not in LD making (where the effects of the genes appear to be moderate at best). Third, the results of the segregation analyses suggest that there is no shared genetic etiology between LD response times and reading comprehension ability.
LD does not appear to be “simpler,” at least in terms of its genetic texture, than reading comprehension, nor do the traits appear to share a genetic etiology. As indicated above, the literature sets a number of requirements for the endophenotype–phenotype relationship. LD shows reliability within/cross-age individual differences and is associated with the target trait, an association that is theoretically supported by the connection between lexical representation and reading comprehension. LD is also heritable. However, the genetic correlations between LD indicators and reading comprehension are not statistically significant, and there is no evidence for shared genetic variance in the results of the segregation analyses. The most surprising finding from this work is that, if anything, the genetic machinery behind LD indicators appears to be at least as complex as the machinery behind reading comprehension. These findings suggest that LD is perhaps not a suitable endophenotype for reading comprehension if one uses the conceptual criteria for “being an endophenotype” discussed above. These findings concur with results suggesting that response-time measures might also be unsuitable endophenotypes for IQ (van Leeuwen, van den Berg, Hoekstra, & Boomsma, Reference van Leeuwen, van den Berg, Hoekstra and Boomsma2007).
Yet, the lack of genetic connection between LD and reading comprehension is surprising. Although there have been few studies investigating the shared genetic contribution between comprehension and single-word reading skills, those studies that do exist found significant and robust shared variance between the constructs. How can we reconcile our findings with those in the field? Furthermore, given that both tasks inevitably make demands on word decoding, it is surprising that there is not at least one shared gene of major effect between LD and reading comprehension. How can we reconcile the differences with prior literature, namely, that there is shared genetic variance between reading comprehension and word decoding?
With respect to reconciling our differences with the finding of shared genetic variance between reading comprehension and word decoding (Betjemann et al., Reference Betjemann, Willcutt, Olson, Keenan, DeFries and Wadsworth2008), it is possible that there are simply too many differences between the studies. Betjemann et al.'s (2008) study sampled both typically developing and reading disabled twins. Their measures of reading comprehension were different from those used in our study, and their study used single-word reading accuracy, not LD reaction time. In addition, their study was conducted using the English language, whereas our study was conducted in Russian. The increased orthographic complexity of printed English makes word decoding more difficult (Ziegler & Goswami, Reference Ziegler and Goswami2006) and may skew the relationship between decoding and comprehension. Decoding may act as a “gatekeeper” to comprehension, and may artificially inflate its contribution to comprehension in less transparent languages such as English. Finally, the different samples also led us to use very different analytic approaches with very different outcome variables. In their analysis, Betjemann et al. (Reference Betjemann, Willcutt, Olson, Keenan, DeFries and Wadsworth2008) decomposed phenotypic variance into genetic and environmental effects using a twin design; the outcome demonstrated how much trait variance was attributable to genetic sources. Our study used a family design and, although we also estimated genetic variance, our approach was targeted to identify the number and effect sizes of the genes contributing to the traits. Furthermore, the twin design of Betjemann et al. assumes that, on average, dizygotic twins share 50% of their genes compared to 100% for monozygotic twins, but cannot account for dominance or epistasis, possibly inflating heritability estimates in comparison to our results (Eaves, Heath, Neale, Hewitt, & Martin, Reference Eaves, Heath, Neale, Hewitt and Martin1998).
A few points should also be made regarding LD as an endophenotype for reading comprehension in particular and the concept of endophenotypes in general. In our study, LD did not exhibit a shared genetic etiology with reading comprehension and did not have a simpler genetic texture than reading comprehension and therefore fails to qualify as an endophenotype. Given our considerable sample size, and the empirical support for a behavioral link between the two traits, this finding was surprising. What went wrong with the endophenotype approach?
Perhaps LD is too complex. Despite the significant overlap between LD and reading comprehension, LD has the added requirement of a speeded response and a decision stage. That the speed of the response is dependent on the processes involved in making the decision is critical, which may have more to do with strategic factors and decision criteria than word decoding. If a participant adopts a fast liberal response style or a slow, conservative one, the response time may be more reflective of these decision criteria than of lexical processing. These response styles or decision criteria might obscure the variance in LD as it relates to reading ability and instead reflect other traits that may be equally related to reading ability (e.g., working memory). There is definite evidence showing that characteristics of decision criteria can have a substantial effect on response times (Ratcliff & McKoon, Reference Ratcliff and McKoon2008; Roach, Edwards, & Hogben, Reference Roach, Edwards and Hogben2004; Spaniol, Madden, & Voss, Reference Spaniol, Madden and Voss2006; Voss, Rothermund, & Voss, Reference Voss, Rothermund and Voss2004), and it might be the case in our data that these other aspects of response time affect variability to such an extent that the impact of reading and lexical factors is lost. In this case, LD and reading comprehension are influenced by the same genes, but the LD task is much more sensitive to the effects of genes that influence attention and inhibition, in which case further investigation where these effects are estimated separately is warranted.
Another alternative explanation, mentioned above, is that the orthographic difficulty of English acts as a “gatekeeper” to comprehension, resulting in the high genetic correlations with comprehension and word decoding in twin studies, but not in our Russian speaking sample. However, we find it hard to believe that word decoding is so much easier in Russian that it shares no variance with reading comprehension.
Another possibility is that there is nothing wrong with the endophenotype approach, if we can successfully identify an endophenotype. The literature offers a number of approaches for identifying an endophenotype. One approach advocating the search for endophenotypes at the conceptual level casts a remarkably wide net over what can be considered an endophenotype and why (Cannon & Keller, Reference Cannon and Keller2005), nominating virtually any interindividual variability between gene and diagnosis. This liberal approach has two rather serious pitfalls. First, anything can potentially be considered an endophenotype, in which case perhaps we should just call them phenotypes again. Second, this pitfall is of greater concern: it is the tacit assumption that any complex neuropsychiatric disorder is decomposable into separate modules and functions, an assumption that may not reflect reality (Anderson, Reference Anderson2008, Reference Anderson2009). Another approach is data driven (Glahn et al., Reference Glahn, Curran, Winkler, Carless, Kent and Charlesworth2012) and is based on the statistical analyses of many phenotypes, resulting in an identification of few or one as an endophenotype. Both approaches (as well as other approaches) have their own proponents and the field has not accumulated enough data on either yet to impose a final judgment on the best strategy for identifying endophenotypes.
Throughout this article, we have assumed that reading comprehension is a hierarchical process, an outcome of subprocesses that combine additively or interactively. However, it might be that reading comprehension is simply not amenable to this sort of decomposition. Multiple factors can influence reading comprehension performance and perhaps reading comprehension is simply too complex to be decomposed in such a way. Vocabulary, attention, working memory, and phonological and orthographic skills all interact during a reading comprehension task. It is conceivable that in any reading comprehension task, in any individual, the limiting factor could differ. This interpretation still leaves the door open for an endophenotype approach, but coupled with the possible genetic complexity of the LD task, it is not immediately clear how to proceed.
Finally, given that LD and reading comprehension do share some neurobiological machinery, we see that there are three possible explanations, which are not mutually exclusive, for our finding of a lack of shared genetic variance. The first is that LD is a complex behavior that reflects more variance in motor and decision processes than in lexical access. This explanation is compatible with the endophenotype approach, provided that we can successfully fractionate and measure these component processes, perhaps using more sophisticated models of reaction times. The second possible explanation is that variability in reading comprehension is simply not amenable to the kind of decomposition that underlies the endophenotype approach. The failure of standardized measures of reading comprehension to converge suggests that there may be no reliably dissociable components of reading comprehension to begin with. We might be able to develop a reading assessment measure that shares significant variance with LD, but only after simplifying the measure so much that it no longer resembles what we would think of as reading comprehension. The third explanation is that it is possible that LD is an endophenotype for a specific (or a specific set of) developmental condition(s) (e.g., ADHD or reading disability) rather than another complex trait (e.g., reading comprehension) that itself might be an endophenotype for a specific (or a specific set of) developmental condition(s) (e.g., reading disability, autism, or intellectual disability).
These three explanations suggest three complementary courses of action. The first is the need to more carefully consider the mechanisms of our candidate endophenotypes, not simply their association with a complex trait. The second is the need to acknowledge the complexity of the complex trait, and decide whether it is decomposable into endophenotypes or better described as a collection of clinically significant “phenotypes.” The third is the need to utilize the endophenotype–phenotype relationship concept only in the context of the quest for the genetic bases of a developmental disorder, not another complex trait. These courses of action are yet to be explored.