Introduction
The developmental history of fossil taxa has been used extensively by paleobiologists to answer questions related to phylogeny, evolutionary processes, and ontogenetic timing. Trilobites in particular have a long history of study that documents the radical transformation that takes place from the protaspid to holaspid developmental period. Traditional studies of shape change during trilobite ontogeny (e.g., Whittington, Reference Whittington1957; Palmer, Reference Palmer1962; Chatterton and Speyer, Reference Chatterton, Speyer and Kaesler1997) have focused on the timing of appearance of facial sutures, timing of joint appearance in transitory pygidia, and simple length, width, height, and ratio measurements to quantify change. More recently, the geometric morphometric revolution (Rohlf and Marcus, Reference Rohlf and Marcus1993; Adams et al., Reference Adams, Rohlf and Slice2004; Zelditch et al., Reference Zelditch, Swiderski and Sheets2012a) has allowed paleobiologists to quantitatively study allometric shape change using homologous structures that directly measure shape, unlike traditional measurements, which only measure linear dimensions.
Trilobite ontogeny has historically been divided according to the tagmatization of the animal and the ongoing development of the thorax. The first developmental period is the protaspid (Beecher, Reference Beecher1895), which has no articulations and is roughly discoidal, bulbous, or partly enrolled. It has been speculated that earlier, morphologically distinct, less-mineralized larval forms may have existed, but whether the so-called phaselus larvae are indeed those of trilobites remains somewhat contentious and uncertain (Fortey and Morris, Reference Fortey and Morris1978; Hughes et al., Reference Hughes, Minelli and Fusco2006). The transition from the protaspid to the meraspid (Raw, Reference Raw1925) period is marked by the separation of the cephalon from the trunk and the development of an articulation between the two tagmata (Whittington, Reference Whittington1957). Further molts produce a thorax of freely articulating segments (in contrast to the fused segments of the pygidium). With successive molts, segments are released from the anterior of the pygidium to extend the thorax posteriorly (e.g., Hughes et al., Reference Hughes, Minelli and Fusco2006, fig. 2; Hughes, Reference Hughes2007, fig. 3). The completion of the thorax defines the transition from the meraspid to the holaspid period, and as holaspids, trilobites continue to grow in size but without the addition of further segments to the thorax. This pattern of development of thoracic expansion during early development with a cessation during maturation is paralleled by the generation of entirely new segments at the posterior of the pygidium. New segment production typically continues into the meraspid period and shuts down during maturation (though not necessarily contemporaneously with the completion of the thorax), a growth pattern known as hemianamorphy (Hughes et al., Reference Hughes, Minelli and Fusco2006).
An event related to and commonly contemporaneous with the meraspid-holaspid boundary is the transition from anamorphic to epimorphic growth (Hughes, Reference Hughes2007). Trilobites do not enter the meraspid period with their full adult complement of trunk (thoracic and pygydial) segments already present. Rather, new segments are produced at the posterior of the pygidium, with one or more added between instars, a pattern known as anamorphic growth (Hughes, Reference Hughes2007). Typically, this gives way to epimorphic growth (in which no new segments are produced) later in ontogeny. This can coincide with the meraspid-holaspid transition, but it is not uncommon for either to precede the other (as in hypoprotomeric development, Hughes et al., Reference Hughes, Minelli and Fusco2006). Study of this transition is complicated by the fusion of pygidial segments; pleural and interpleural furrows may be too indistinct to be resolved at the posterior of the pygidium, especially in effaced taxa, and even axial ring furrows may be difficult to identify if preservation is poor.
This system of ontogenetic classification, in which the meraspid phase begins with the first articulation between the cephalon and trunk, and ends with the last, remains widely used in trilobite paleobiology. However, intraspecific variation in the terminal number of thoracic segments can make distinguishing meraspids and holaspids problematic. Some studies (Robison, Reference Robison1967, Bathyuriscus fimbriatus Robison, Reference Robison1964; Hughes and Chapman, Reference Hughes and Chapman1995, Elrathia kingie Meek, Reference Meek1870, Aulacopleura koninckii Barrande, Reference Barrande1846; Clarkson and Ahlberg, Reference Clarkson and Ahlberg2002, Ctenopyge ceciliae Clarkson and Ahlberg, Reference Clarkson and Ahlberg2002) find a strong correlation between the size of holaspids and their thoracic segment count, raising the possibility of environmental influences on the terminal number of thoracic segments, although Webster (Reference Webster2019) noted that it is not a testable hypothesis for fossil taxa because genetic variation among individuals cannot be controlled for. Hughes and Chapman (Reference Hughes and Chapman1995) found that the Silurian proetid trilobite A. koninckii had a strong positive correlation between the sagittal length of the glabella and the number of thoracic segments present; while the slope of this relationship decreased dramatically at a breakpoint associated with the meraspid-holaspid transition, a statistically significant positive correlation remained even among holaspids. In other taxa, the onset of the epimorphic phase may actually precede the start of the holaspid phase, as in Dimeropyge speyeri Chatterton, Reference Chatterton1994, Stenoblepharum astinii Edgecombe et al., Reference Edgecombe, Chatterton, Vaccari and Waisfeld1997, and Ctenopyge angusta Westergård, Reference Westergård1922 (Chatterton et al., Reference Chatterton, Edgecombe, Speyer, Hunt and Fortey1994; Edgecombe et al., Reference Edgecombe, Chatterton, Vaccari and Waisfeld1997; Clarkson et al., Reference Clarkson, Ahlgren and Taylor2003). These patterns may be attributable to incomplete recovery of instars, or intraspecific variation in generation schedules, as suggested by Hughes et al. (Reference Hughes, Minelli and Fusco2006). At a minimum, these ambiguities support the need for further investigation of the meraspid-holaspid transition and how attainment of a mature number of thoracic segments corresponds to other types of morphological change during ontogeny. Specifically, is there a corresponding change in allometry and the rate of morphological change (see Kim et al., Reference Kim, Sheets, Haney and Mitchell2002; Sheets et al., Reference Sheets, Kim, Mitchell and Elewa2004) during this transition, what is the structure of those changes, and is it completely independent of the attainment of the mature number of thoracic segments? We investigate this question on the Ordovician trilobite Calyptaulax strasburgensis (Ulrich and Delo, Reference Ulrich and Delo1940), while also documenting the nature of the ontogenetic change associated with the meraspid-holaspid transition, and relate those characteristics to other phacopids.
Notes on the use of pygidia in landmark based methods
Landmark-based morphometric methods have been widely used to answer questions related to trilobite phylogeny and ontogeny in recent history, and advances in computing power and the development of statistical software packages tailored to morphometrics have eased the quantification of shape change across an ontogenetic series. Since trilobite growth and development remains poorly understood due to the rarity of soft-tissue preservation and the total absence of extant representatives, such approaches have become the preferred tools for investigating questions of ontogeny.
Both ontogenetic and evolutionary studies frequently focus exclusively on the cephala of trilobites because of the easily identifiable homologous structures associated with the cranidial furrows and facial suture. Many thoracic segments may be present in an individual and vary significantly in shape depending on position within the thorax, but are difficult to identify in a disarticulated state. Similarly, hypostomes and rostral plates make poor subjects of study for these purposes; the relative rarity of their preservation is compounded by their frequent lack of diagnostic characteristics, which can preclude species-level taxonomic assignments.
Ontogenetic studies of the pygidium are less common because they suffer from one key limitation of homology. Because the thorax is developed during the meraspid growth period by the release of segments from the anterior of the pygidium during molts, pygidial segments occupying the same position in successive instars may not actually represent the same segment. When the first pygidial segment is released into the thorax during ecdysis, the second and third segments (for example) in the preceding instar become the first and second segments of the pygidium in the following instar; thus, any morphometric approach comparing the two instars could potentially map landmarks on a given segment onto a different segment occupying the same position in a later point in development. While the positions of a given landmark across specimens of different sizes are certainly analogous, it is questionable whether they are truly homologous. The segment itself is physiologically a different one, but the “new” first pygidial segment has the inherited position of the “old” first pygidial segment. Since the anterior margin of the pygidium must fit precisely to the last segment of the thorax, the articulating facet of the pygidium and related structures tend to be well conserved. The question as to whether this relationship satisfies the homological requirements for landmark-based morphometrics is subject to debate and interpretation. Given the questions of rigor arising from this issue, it is often more easily justified to simply focus only on the cephalon (which does not gain or lose segments during meraspid or holaspid development) and avoid use of pygidial landmarks altogether.
Simpson et al. (Reference Simpson, Hughes, Kopaska-Merkel and Ludvigsen2005), in a landmark-based morphometric study of ontogenetic shape change in individual trunk segments of the newly described trilobite Hintzeia plicamarginis Simpson et al., Reference Simpson, Hughes, Kopaska-Merkel and Ludvigsen2005, found that difference in shape is greater between homologous than between homonymous segments in successive instars. That is, two pygidial segments occupying the same position relative to the anterior margin of the pygidium will be more similar in shape than the same segment occupying two different positions at different points in development. Given this observation in H. plicamarginis and the general similarity in form between pygidial and thoracic segments in Calyptaulax holaspids, it is reasonable to infer that this pattern holds true in Calyptaulax as well, although the disarticulated nature of the material used here makes explicit verification impossible.
Geologic and stratigraphic setting
The Middle Ordovician sediments of the Taconic Foreland Basin were heavily influenced by tectonic activity during their deposition (Read, Reference Read1980; Brett et al., Reference Brett, Goodman and LoDuca1990; Ettensohn, Reference Ettensohn and Miall2008). The evolution of the basin system was marked by tectonically driven subsidence, producing significant accommodation space and culminating in the gradual drowning of the carbonate platform as the Taconic forebulge (McLaughlin and Brett, Reference McLaughlin and Brett2007) drew closer and closer to the plate margin (Mitchell et al., Reference Mitchell, Adhya, Bergstrom, Joy and Delano2004). The shutdown of the warm-water carbonate factory is thought to have been caused primarily by some combination of increased siliciclastic input from the mainland (the result of tectonic uplift) and encroachment of anoxic deep-basin waters, but the cooler temperatures resulting from the onset of the Late Ordovician glaciation may have played a role as well (Read, Reference Read1982; Holland and Patzkowsky, Reference Holland, Patzkowsky, Witzke, Ludvigson and Day1996; Carlucci and Westrop, Reference Carlucci and Westrop2012).
Samples for this study were taken from the Edinburg Formation (Cooper and Cooper, Reference Cooper and Cooper1946, roughly equivalent to the M3 depositional sequence of Holland and Patzkowsky, Reference Holland, Patzkowsky, Witzke, Ludvigson and Day1996; see Mitchell et al., Reference Mitchell, Adhya, Bergstrom, Joy and Delano2004, fig. 7). The Edinburg Formation (Fig. 1) was deposited during the third of six phases of Taconic basin evolution (Read, Reference Read1980), a period of continued significant down-warping and accommodation, but prior to major progradation of deep-ramp facies into more basinal environments. The Edinburg can be divided sedimentologically into an upslope facies group typified by the cobbly limestones of the Lantz Mills facies (Cooper and Cooper, Reference Cooper and Cooper1946), and a basinal deposit represented by the interbedded argillaceous limestones and shales of the Liberty Hall facies (Campbell, Reference Campbell1905). Basinal sediments are significantly thicker than slope sediments due to increased rates of accommodation during tectonic down-warping, and tend to be darker as a result of higher clay and organic content. The Liberty Hall facies grades in places into the similar Botetourt Member of the Edinburg (Cooper and Cooper, Reference Cooper and Cooper1946), nodular deep-water wacke-, pack-, and grainstone interbedded with indurated shales. Liberty Hall sediments are also punctuated irregularly by occurrences of “mud mound” reefal structures composed of fine-grained mudstones and wackestones, part of the Effna Limestone (Carlucci and Westrop, Reference Carlucci and Westrop2012).
Strasburg Junction locality map and stratigraphic setting: (1) stratigraphic column through the Edinburg Formation at Strasburg Junction; arrows denote sample horizons of silicified material; ms = mudstone, ws = wackstone, ps = packstone, gs = grainstone; (2) simplified stratigraphic chart, showing Mohawkian (Sandbian) units of northern Virginia, in relation to the depositional sequences of Holland and Patzkowsky (Reference Holland, Patzkowsky, Witzke, Ludvigson and Day1996), data from Mitchell et al. (Reference Mitchell, Adhya, Bergstrom, Joy and Delano2004, fig. 7); (3) road and locality map for Strasburg Junction. Dotted lines are railroad tracks, thin lines are roads, and the thick line is the Shenandoah River. Star denotes location of section in Fig. 1.1. Latitude 38°59′48.03″N, Longitude 78°22′40.58″W.

Silicification within the Edinburg Formation is widespread but highly variable, and its exact extent and the mechanics of its occurrence remain poorly understood. Among the Ordovician limestones of the Shenandoah Valley, silicification tends to be restricted to individual horizons with limited lateral continuity among different exposures in the same locality, with very little known of patterns of silicification in the subsurface (Whittington and Evitt, Reference Whittington and Evitt1954).
Within horizons bearing silicified material, several trends emerge. Silicified fossils are preserved as “irregular patches,” with the prevalence and quality of silicification varying drastically across even relatively short lateral distances (meter-scale). Even within a single exposure, the relative abundances of taxa may vary depending on which sclerite is considered. Whittington and Evitt (Reference Whittington and Evitt1954) give as an example a locality in which Ceraurinella and Ceratocephala cranidia are both common, but where the smaller sclerites (hypostomes and thoracic segments) only of Ceraurinella remain common, while the corresponding elements of Ceratocephala are uncommon. Additionally, smaller individuals are generally more abundant; which is caused at least in part by the larger number of subadult exuviae produced, due to a purported greater frequency of ecdysis as subadults and to successively lower survivorship at later growth periods, but may also reflect mechanical size sorting and transport damage to larger, more fragile sclerites (particularly in light of the above variations in abundance). These indicators of abundance, taken together with the prevalence of disarticulation, suggest that skeletal material was transported by currents prior to burial, which accounts for the patchiness of fossil beds and size sorting.
Calyptaulax strasburgensis was originally recorded from the lowest few meters of the Edinburg Formation, in the shaley argillaceous wackestones of the Liberty Hall facies (Fig. 1.1) in Shenandoah County (Fig. 1.3). It is known also from the more nodular limestones of the Botetourt Member and from shales assigned to the Athens facies (similar to the Liberty Hall), also within the Edinburg, at exposures farther to the southwest (Cooper, Reference Cooper1953). All material in this study, however, was obtained from Edinburg exposures near the original reported locale for C. strasburgensis.
Materials and methods
Sample processing
Silicified material was collected from three levels across a single site at Strasburg Junction (Strasburg, Virginia, Fig. 1.1, 1.3) in the Edinburg Formation (Figure 1.2). Hand samples from meter levels 22, 26, and 34.6 of the Strasburg Junction railcut exposure (SJ) went through multiple cycles of submersion in a 3% hydrochloric acid bath, followed by sieving of disaggregated sediment, and finally suspension in an ultrasonic bath to liberate clay and mud.
Batches of cleaned sediment were searched for silicified fossil material using a binocular microscope. The remaining sediment consisted of fine siliceous sand with a high proportion of fossil remains. Silicification appeared to be thorough and complete; no dissolution features were apparent in specimens. In addition to Calyptaulax strasburgensis, recovered trilobite specimens were identified as Lonchodomas, Remopleurides, Trinodus, and Ceraurus, along with a great deal of extremely fragmented Isotelus material. Non-trilobite fossils mostly consisted of dendroid and fenestrate bryozoans, although some small gastropods were recovered as well.
Following the taxonomy of Cooper (Reference Cooper1953, see Systematic paleontology below), cranidia and pygidia recognizable as C. strasburgensis were retrieved for sample selection and imaging.
Sample selection, imaging, and landmark digitization
More than 100 cranidia and 100 pygidia were evaluated for completeness with a stereo microscope. Of these, a subset of 52 cranidia and 48 pygidia that were sufficiently complete for landmark identification were used for the morphometric analyses. The morphometric subset of C. strasburgensis spans a sagittal length of 1.05–7.20 mm for cranidia, and 1.18–7.37 mm for pygidia (see Figure 2 for a visual representation of the differences in size). Although there are no clear spinose reference segments that allow for easy differentiation of unreleased thoracic segments from pygidial ones during the meraspid phase, and identifying the number of future thoracic segments is somewhat difficult in C. strasburgensis, the size distribution of our dataset is consistent with a range of middle meraspid to early holaspid of other published phacopid ontogenies (e.g., Crônier et al., Reference Crônier, Auffray and Courville2005; Crônier, Reference Crônier2007). A cranidial growth series shows a conventional pattern of development with a discontinuous isometric distribution (Fig. 2.3). The dimensions of larval arthropods commonly increase by a constant growth factor between successive instars in what is known as Dyar's Law (Dyar, Reference Dyar1890; Klingenberg and Zimmermann, Reference Klingenberg and Zimmermann1992). Often used as a null hypothesis for studies of arthropod ontogeny, this rule has been upheld as broadly accurate for trilobites (Palmer, Reference Palmer1957; Chatterton and Speyer, Reference Chatterton, Speyer and Kaesler1997; Fusco et al., Reference Fusco, Hughes, Webster and Minelli2003; Hughes et al., Reference Hughes, Minelli and Fusco2006; Webster, Reference Webster2015). Under Dyar's Law (Eq. 1):
 $$ {\rm Y}_{\rm N + 1} = {\rm Y}_{\rm N} \cdot {\rm k} $$
where YN is a dimension of the Nth instar and k is the growth factor, known as Dyar's coefficient. Linear regression of log-cranidium length against apparent instar yielded an average (instars 1–8) k of 1.253 (r2 = 0.9198), while the regression of log-pygidium length against apparent instar produced a slightly larger average (instars 1–8) k of 1.317 (r2 = 0.9808); both are consistent with the range of published values in trilobites (Fusco et al., Reference Fusco, Hughes, Webster and Minelli2003, Reference Fusco, Garland, Hunt and Hughes2012; Feist et al., Reference Feist, McNamara, Crônier and Lerosey-Aubril2009). To test for the existence of the instars we used a Finite Mixture Model (Hunt and Chapman, Reference Hunt and Chapman2001; Webster, Reference Webster2015), which evaluates the natural clustering using the “mixture analysis” function of Past v3.21 (Hammer et al., Reference Hammer, Harper and Ryan2001). The mixture analysis was performed on specimen scores along the first principal component of the log-transformed bivariate plot data, which represents the ontogenetic axis (see Hunt and Chapman, Reference Hunt and Chapman2001). PAST uses the EM algorithm (Dempster et al., Reference Dempster, Laird and Rubin1977), replicated 20 times, each time with new, random starting positions for the means. We ran the analysis ten times, each with 20 replicates. Goodness of fit for one through eight normal distributions was evaluated with Akaike Information Criterion (AIC; Akaike Reference Akaike1974). For the cranidial data, the best performing models were seven (AIC -62.65, log-likelihood 51.33) or eight (AIC -57.26, log-likelihood 52.87) normal distributions, with the “best” model somewhat variable between the two, depending on the replicate. In general, the assignments from the mixture coding models fit the instars identified from their natural clustering with two exceptions. First, the seven normal distributions model collapsed instars 3 and 4 together, and both models suggest instars 6 and 7 are assigned to distributions differently than their natural clustering suggests (stars denote uncertainty on Fig. 2.3). Pygidial data (not shown) also had an eight normal distribution model as the best fit.
Conceptual ontogeny of C. strasburgensis: (1) five cranidia illustrating a generalized ontogenetic series of C. strasburgensis; this demonstrates the degree of variation in both size and shape across the developmental interval studied; (2) five pygidia illustrating a generalized ontogenetic series of C. strasburgensis; (3) scatter plot of cranidial length versus width with eight individualized ontogenetic instars showing a discontinuous distribution. Linear regression of log-cranidium length against apparent instar yielded a k of 1.253 (r2 = 0.9198). Stars denote uncertainty in instar boundaries as evaluated by finite mixture models (see text for explanation).

Mounted material was photographed at focal length intervals of ~0.1 mm using a Canon EOS 5D Mark II camera equipped with a 60 mm macro lens. Great care was taken to standardize orientation in both longitudinal and transverse planes, with the dorsal surface of the palpebral lobes positioned horizontally below the camera, normal to both the anteroposterior and mediolateral axes, following Shaw (Reference Shaw1957). Images were then focus stacked using Helicon Focus 5.3 x64 (Kozub et al., Reference Kozub, Khmelik, Shapoval, Chentsov, Yatsenko, Litovchenko and Starykh2008), and a depth map rendered for each image to confirm proper orientation. References to length are in the sagittal direction, and width in transverse, unless otherwise noted. The palpebral lobe (or eye if preserved) was oriented horizontally for the standard lateral view.
Landmark digitization was performed using the software tpsDig 2.17 (Rohlf, Reference Rohlf2013). For the sake of consistency, the right side (from the perspective of the trilobite) of each specimen was digitized when possible; specimens with damaged or incomplete right sides were plotted using the left side, and the image and points then reflected horizontally across the image centerline by multiplying the x coordinates of every landmark by −1, following Zelditch et al. (Reference Zelditch, Swiderski and Sheets2012b).
Landmark selection
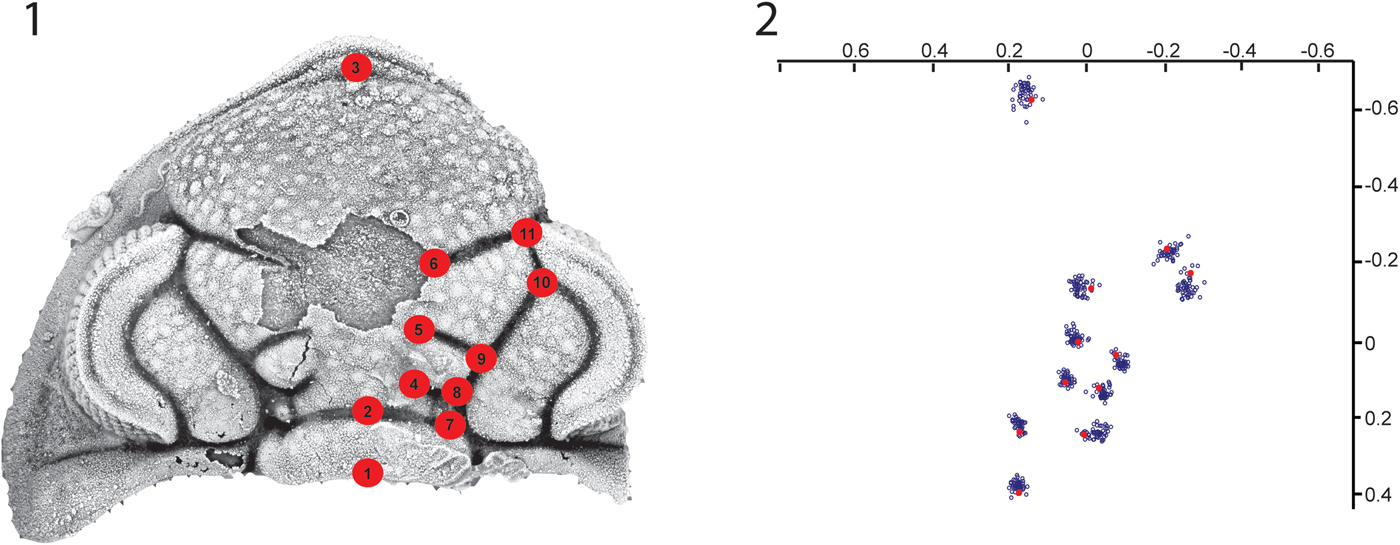
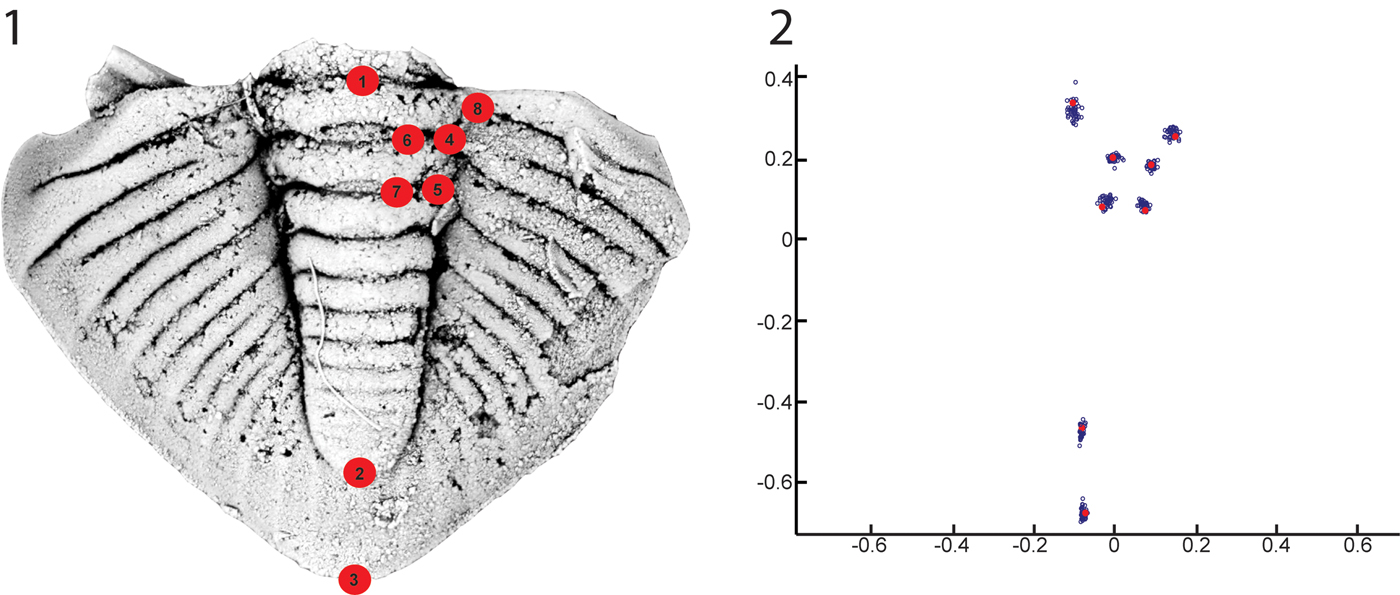
Eleven cranidial landmarks (Table 1, Fig. 3) and eight pygidial landmarks (Table 2, Fig. 4) were selected to ensure precision of location, maximization of areal coverage, and biological homology across specimens. Intersections of furrows (Type 1 landmarks, Bookstein, Reference Bookstein1991) were chosen preferentially over inflections in or terminations of single furrows, ensuring that digitization markers could be reliably placed at the proper locations by visual inspection alone. Landmarks were chosen to be broadly distributed, capturing as much of the sclerite shape as feasible. Pygidial landmarks were purposely kept near the axis because the abaxial furrow terminations were determined to be unreliable, particularly because of abrasion on the lateral margins of the specimens.
Cranidial landmarks: (1) cephalon of Calyptaulax showing location of landmarks; (2) Procrustes superimposition of cranidial landmarks showing variation in relative position. Blue circles (open) represent individual specimens, red circles (closed) represent sample mean of reference form (five smallest).

Pygidial landmarks: (1) pygidium of Calyptaulax showing location of landmarks; (2) Procrustes superimposition of pygidial landmarks showing variation in relative position. Blue circles (open) represent individual specimens, red circles (closed) represent sample mean of the reference form (five smallest).

Morphological criteria for cranidial landmarks.

Morphological criteria for pygidial landmarks.

Type I landmarks (locally defined, fully bounded) were preferentially selected in order to ensure homology across specimens and reliability of placement during digitization. However, some Type II landmarks (Bookstein, Reference Bookstein1991, locally defined, partially bounded) were also used to improve coverage of underrepresented areas of interest. Three Type II pygidial landmarks (P1, P2, and P3; Table 2) were assigned to intersections of the sagittal plane with furrows or sclerite margins, and three Type II cranidial landmarks (C4, C5, and C6; Table 1) were assigned to the adaxial termini of glabellar furrows. Additionally, one Type II pygidial landmark was assigned to an interpleural furrow terminus to improve coverage of the pygidial pleural lobes, but it was excluded from the final analysis due to issues in properly identifying its location during the digitization process.
Morphometric and quantitative methods
Data (publicly archived on DRYAD, 10.5061/dryad.mb70hg0) were subjected to statistical analysis in order to assess shape change over ontogeny using methods partially adapted from Bookstein (Reference Bookstein1991), Sheets (Reference Sheets2010), Webster (Reference Webster2011), and Zelditch et al. (Reference Zelditch, Swiderski and Sheets2012b). Using the software CoordGen (Sheets, Reference Sheets2011a), the cranidial and pygidial landmark configurations were subjected to Procrustes superimposition, resizing and rotating each configuration to align it to a reference form for the data set (Figs. 3.2, 4.2). The average of the five smallest specimens in each set was used as a reference for that set, with the centerline defined along the sagittal plane. By mathematically removing the influence of size, position, and rotation, the configurations are converted to “shape space.”
The superimposed configurations are the basis for more in-depth analytical techniques. Two key metrics are centroid size and partial Procrustes distance (Zelditch et al., Reference Zelditch, Swiderski and Sheets2012a). The former, a measure of a specimen's size, is the root-sum-square of the distances from the geometric centroid of each configuration (which is itself derived by taking the mean coordinate location of all the landmarks) to each landmark in turn. The partial Procrustes distance is the root-sum-square of the distances from each landmark to the corresponding landmark location on the reference form after they have been put in partial Procrustes superimposition. While centroid size measures the size of a given specimen and thus serves as a proxy for the developmental period of the individual at the time of ecdysis or death, partial Procrustes distance measures how strongly the specimen varies from the reference form and thus acts as a rough indicator of how much shape change has occurred in that individual at that developmental period. By plotting partial Procrustes distance against centroid size, an operation performed in CoordGen, we characterized the ontogenetic trajectory of the organism; this displays the pace of generalized shape change over the course of development, allowing for analysis of variation in the rate of shape change relative to size through ontogeny and the identification of transitions in growth pattern.
Previous studies (Kim et al., Reference Kim, Sheets, Haney and Mitchell2002) have suggested the existence of a breakpoint in the above ontogenetic trend (partial Procrustes distance as a function of centroid size) in trilobites, corresponding to a distinct change in allometry. In order to investigate this, the plots of partial Procrustes distance against the natural logarithm of centroid size (one representing the cranidia and one representing the pygidia) were subjected to breakpoint analysis (i.e., segmented regression, see Wagner et al., Reference Wagner, Soumerai, Zhang and Rose-Degnan2002 for more details on regression coefficient and breakpoint calculation) using the SegReg software (Oosterbaan et al., Reference Oosterbann, Sharma, Singh and Rao1990; Oosterbaan, 2001). This utility detects and assigns breakpoints between linear trends that piecewise describe a scatter plot distribution, following a least-squares method, where two regression lines are made to fit the data set as closely as possible while minimizing the sum of squares of the differences between observed and calculated values of the dependent variable. The breakpoint is found numerically by taking a series of tentative breakpoints and performing a linear regression on either side. The breakpoint with the largest coefficient of determination is selected as the true breakpoint. Two regression equations (left and right of the breakpoint) are used to determine a 95% confidence interval and test for significance in the breakpoint interval (Oosterbaan, 2001). If the 95% confidence area around the breakpoint remains within the data range, the break-point is significant, and the two regression lines provide an additional explanation of variance relative to a standard linear regression (Oosterbaan, 2001). Follow-up analyses were done using the “segmented” algorithm of the “segmented” package (Muggeo, Reference Muggeo2008), which fits regression models with a segmented relationship between a response and exploratory variable, providing break-point estimates.
Because specimens were derived from three separate fossiliferous beds at different levels within the outcrop, there is the potential for evolutionary (rather than ontogenetic) change in shape to skew the results of this analysis; populations at different points in time might differ in shape and undergo different growth trajectories, confounding any ontogenetic trends. To determine whether this is the case, specimens were grouped according to meter level and their shape compared. Cranidia were divided into three subgroups according to their meter level of origin (22, 26, or 34.6) and each subgroup subjected to Procrustes superimposition in CoordGen (Sheets, Reference Sheets2011a) using the reference form derived from the whole-sample analysis; the same procedure was performed on the pygidia as well. Using the software TwoGroup (Sheets, Reference Sheets2010), meter-level groups of Procrustes-superimposed specimen representations were pairwise subjected to Goodall's (Goodall, Reference Goodall1991) bootstrapped F-test (10000 replicates) to determine whether the mean cranidial shape between any two meter levels was statistically significant. This method uses Procrustes distance between sample means as the test statistic (Webster and Sheets, Reference Webster and Sheets2010; Webster, Reference Webster2011), with the observed F-value compared to the range of F-values obtained by randomly assigning specimens to samples during the bootstrap process. Meter-level homogeneity was tested for both cranidia and pygidia and on non- and size-standardized data. Each sample (22, 26, 34.6) was size-standardized using the Standard6 software (Sheets, Reference Sheets2001), which conducts a linear regression of shape variables against lnCS. Residuals from the regression are associated with each specimen to aid in predicting the shape of that specimen at the appropriate size plus its original residuals. Shape variation is then determined entirely by the residuals, which removes the variation attributable to allometry.
Because the inferred ontogenetic trend in allometry is non-linear (see Results), size-standardization over the entire population is not optimal. Instead, homogeneity was tested as two concatenated linear trends, allowing sub-populations restricted to one side of the transition point to be size-standardized. Morphological differences in closely related trilobite taxa frequently arise through heterochrony (McNamara, Reference McNamara1986), which raises the possibility that disparities between meter-level populations are more pronounced among more mature individuals.
Ontogenetic shape change in the cranidia and pygidia was analyzed by calculating partial Procrustes distance away from a consensus reference form of the five smallest specimens in Regress7a (Sheets, Reference Sheets2011c), and then plotting that against cranidial or pygidial centroid size to evaluate if there was a positive relationship between shape change with size (an “ontogenetic trajectory”). Based on the calculated breakpoints within the ontogenetic trajectory, the cranidial and pygidial data sets (consisting of superimposed landmark configurations) were partitioned into pre- and post-breakpoint subsets according to centroid size and tested for allometry using Goodall's bootstrapped F-test. The proportion of shape change attributed to allometry was evaluated in Regress7a (Sheets, Reference Sheets2011c) by calculating partial warp scores away from the reference form, and then regressing those in a multivariate regression against log centroid size (lnCS) (methodology following Webster and Sheets, Reference Webster and Sheets2010 and Webster, Reference Webster2011). Total shape variance of C. strasburgensis was calculated as the summed squared partial Procrustes distance away from its mean shape, and partial warp scores were calculated away from the reference form. Those scores were regressed against lnCS (log centroid size) to produce a vector of regression coefficients over the sampled ontogeny of C. strasburgensis. The summed squared residuals represent the portion of the shape deviation not attributable to allometry, and the significance of this effect is determined by non-parametric bootstrap resampling (10,000 replicates). A thin plate spline was calculated in Regress7a to visually show deformation and shape change calculated by the regression of shape variables against lnCS.
Finally, to further investigate the nature of the ontogenetic shape change in C. strasburgensis, we conducted a relative warp analysis (Rohlf, Reference Rohlf, Marcus, Bello and García-Valdecasas1993) and associated thin plate spline deformation grids using the software PCAGen (Sheets, Reference Sheets2011b). A relative warp analysis is a Principal Components Analysis (PCA) of partial warp scores. A PCA uses an orthogonal transformation to convert data points into a set of values of linearly uncorrelated variables (“Principal components”) that are referred to as relative warps (RWs) when the transformation is done on warp scores. RWs are mathematically independent axes of shape variation (Webster, Reference Webster2011) and can be used to describe the percentage of variance attributable to morphological change in the cranidia or pygidia. Each RW contributes a portion of total variance attributable to change from the reference form, and can be visualized as a thin plate spline deformation grid.
Repository and institutional abbreviation
All material is housed at the Sam Noble Oklahoma Museum of Natural History (repository abbreviation: OU).
Systematic paleontology
Order Phacopida Salter, Reference Salter1864
Suborder Phacopina Struve, Reference Struve and Moore1959
Family Pterygometopidae Reed, Reference Reed1905
Genus Calyptaulax Cooper, Reference Cooper1930
Type species
Calyptaulax glabella Cooper, p. 388, pl. 5, figs. 9–11.
Calyptaulax strasburgensis (Ulrich and Delo, Reference Ulrich and Delo1940)
Figures 10–12
- Reference Ulrich and Delo1940
Calliops strasburgensis Ulrich and Delo, p. 99, pl. 12, figs. 8–10.
- Reference Butts1941
Pterygometopus sp. Butts, pl. 82, figs. 9–13.
- Reference Cooper1953
Calliops strasburgensis Cooper, p. 64, pl. 17, figs. 1–15.
- non Reference Shaw1974
Calyptaulax annulata Shaw, p. 38, pl. 10, figs. 14, 15, 18–25.
- Reference Amati2004
Calyptaulax cf. C. strasburgensis Amati, p. 514, pl. 13, figs. 1–7.
- Reference Carlucci and Westrop2012
Calyptaulax cf. C. strasburgensis Carlucci and Westrop, p. 30, figs. 9E, I.
Holotype
Designated by Ulrich and Delo (Reference Ulrich and Delo1940, USNM 78982), but incorrectly figured as a cotype (Ulrich and Delo, Reference Ulrich and Delo1940, pl. 12, fig. 8). Paratypes all labeled as USNM 78982.
Occurrence
Lower Edinburg Formation from Strasburg Junction (SJ), Shenandoah County, Virginia (this study and Cooper, Reference Cooper1953), Botetourt Limestone Member near Harrisonburg, VA (Cooper, Reference Cooper1953), Athens Shale locality, 5 miles northwest of Roanoke (Butts, Reference Butts1941), and the Liberty Hall facies and Botetourt Limestone Member of the Edinburgh in Southwest Virginia at Porterfield Quarry, near Saltville, VA (Carlucci and Westrop, Reference Carlucci and Westrop2012).
Description
Cephalon subtriangular in outline; cranidium is subtrifoliate. Maximum lateral width of the cranidium (interocular width) 1.23–1.45 times the sagittal length. Facial sutures proparian, anterior branches convex abaxially, posterior branches are quite short (exsag.) and approximately linear. Cephalon with no spines.
Occipital ring (LO) rectangular in outline and slightly convex anteriorly; accounting for 36.6–42.4% max cranidial width (tr.) and 14.3–16.1% of cranidial length (sag.). Occipital tubercle visible in some meraspid specimens, but not apparent in any of the holaspids. Glabella amphoriform in outline, with three lobes forming an approximately subrectangular posterior portion surmounted by a bulbous anterior lobe (LA). L1 narrow (exsag.) and triangular in shape; S1 deflected (11.3–29.6°) slightly antero-adaxially relative to transverse axis, deepest (exsag.) along its boundary with the axial furrow. Lateral portion of L1 isolated by a shallow, indistinct furrow extending between SO and S1. L2 subrectangular in shape. S2 slightly longer than S1, strongly angled (20.1–32.8°) antero-adaxially from transverse, giving S2 a broader outline. L3 larger (exsag.) than L1 and L2, subtrapezoidal in outline. S3 longer than S1 and S2, angled as a postero-adaxial deflection of 13.3–25.60° from transverse. S1, S2, and S3 deep and strongly defined, curvature somewhat indistinct.
LA broadest (tr.) just anterior its intersection with the axial furrow and S3 representing the broadest (tr.) point of the glabella, glabella narrowest near intersection of the S1 with axial furrows.
Preglabellar field narrow (sag., 2.7–5.1% of total cranidial length) and poorly defined, with only a slight change in convexity demarcating anterior boundary of the glabella. Preglabellar field present only at the extreme anterior of the cranidium; most of LA bounded closely by the facial sutures, which meet at an angle of 118–137.6° at the cranidial anterior margin. Anterior of the cephalon (inclusive of librigenae) slightly upturned, with a well-developed doublure along the margin. Vincular furrow obsolete anteriorly, well defined posteriorly, grading into deep (dorsoventrally) vincular notches. Eyes schizochroal, large (2.47–3.72 mm exsagittal length) and well developed, crescentiform outline in dorsal view.
Cephalic axial furrows sigmoidal, parallel to the sagittal plane at posterior margin, curve slightly adaxially just anterior of LO, curve strongly abaxially along much of the glabella, curve slightly adaxially at their anterior termini. Inflection points in curvature of axial furrows located approximately at intersection with S1 and intersection with the palpebral furrow; between these points, axial furrow nearly linear, angled 31.5–39.7° antero-abaxially (exsag.). Palpebral area fabiform to sigmoid, inflated, bounded by the palpebral, axial, and occipital furrows, with concavity in outline along their border (delineated by palpebral furrow) with posterior aspect of eye.
Genal angles rounded, 56.2–65.3° in arc width. Posterior margin of cephalon concave posteriorly with a pronounced inflection point approximately even (tr.) with posterior aspect of eye, resulting in the genal angles projecting significantly posterior of LO. Librigenae with noticeably raised or thickened margin, especially in posterior aspect, deflected antero-abaxially where preserved.
Cephalic tubercles of several sizes dense on glabella, SO, palpebral areas, low elevation from surface, resulting in a granulose texture. Several smaller, more prominent granules present in some specimens along adaxial posterior aspect of occipital ring, forming a narrow (sag.) band along the posterior margin. Librigenae (exclusive of the lens surfaces of the eye) smoother in texture, with small granules along posterolateral margins. Librigenal field pitted.
Hypostome outline alate, median body convex but not bulbous, amygdaloid in shape, margin broad, border furrow deep and incised posteriorly, shallow and indistinct anteriorly, maculae oval in outline and strongly indented on ventral surface, oriented at ~20–30° towards anterior wing. Border narrow (~5% of total antero-posterior length) laterally, broad (~10% total length) posteriorly. Shoulders not strongly defined, breadth (tr.) ~70% of anterior wings. Anterior wings projecting strongly dorsally, account for nearly 50% of total dorso-ventral height; posterior wings small and indistinct. Prosopon granular, anterior wings more finely granular. No rostral plate known.
Thoracic segments consistent in shape; no macropleural segments observed. Segments highly arched, with approximately semicircular (in antero-posterior cross section) axial ring and slightly narrower (sag.) articulating half-ring. Abaxial aspect of axial ring deflected slightly anteriorly, adaxial portion bears a lateral row of small tubercles (similar to those on LO) along its posterior margin; dorsal surface otherwise fairly smooth. Pleurae are slightly wider (tr.) than axial ring. Pleural fulcrum at approximate midpoint of total lateral width; portion of pleura abaxial to the fulcrum is deflected strongly (~70°) ventrally and slightly (~30°) posteriorly, comprising ~70% of total (proximo-distal) pleural length. Anterior outline of pleura slightly concave. Pleural furrow runs from intersection of axial furrow with ring furrow postero-abaxially to the antero-posterior midpoint of the fulcrum, directly laterally along approximate (antero-posterior) midline of abaxial portion of the pleura, shallowing out near the distal margin. Axial, axial ring, and pleural furrows deep and sharply defined. Apodemes associated with axial furrows are relatively small and do not project significantly ventrally.
Pygidium subtriangular in outline, 10 axial segments apparent, of which seven are reliably clearly visible (remaining three being frequently indistinct), plus terminal axial piece. Maximum width (tr.) at approximately (antero-posterior) position of the abaxial terminus of first interpleural furrow, 1.32–1.53 times sagittal length of pygidium. Length (sag.) of pygidial axis accounting for 78–83% of sagittal length. Pygidium highly convex (dorso-ventrally) in lateral cross-section.
Pygidial anterior margin approximately linear medially. Antero-abaxial aspect angled postero-ventrally, with each facet spanning ~20% of total maximum pygidial width (tr.). First pleural furrow approximates directionality of the anterior aspect of pleural lobe, angled at 19.2–31.5° (tr.). Antero-lateral margin slightly convex abaxially and angled slightly antero-adaxially between point of greatest width (tr.) and antero-abaxial terminus of articulating facet. Postero-lateral margins similarly very slightly convex abaxially, meeting posteriorly at a rounded angle of ~105°.
Axial segments taper steadily from greater width (tr.) towards anterior to narrower towards posterior, most noticeably in first four axial rings. Fourth axial ring 57–67% of width (tr.) of the first ring. Posteriorly located axial rings comparatively longer proportional to their width. Length (sag.) to width (tr.) ratio 0.18–0.23 in the first axial ring, fourth axial ring 0.21–0.26.
Axial furrows and first six axial ring furrows deeply incised and clearly bounded; successive axial ring furrows fainter and shallower. Axial ring furrows slightly concave posteriorly, with two cuspate posteriorly directed inflection points; furrows shallower and less clearly defined between inflection points. Pleural furrows adaxial termini intersect axial furrows, while abaxial termini tend to be indistinct, shallowing into obsolescence near the pygidial margin. Interpleural furrows similarly shallow out at their abaxial termini near margin, but adaxially abruptly end without intersecting axial furrows. Postero-lateral margin is relatively broad and smooth.
Materials
Dimensions and characteristics of the cranidium are based on 10 apparent (based on ranges of other published phacopid ontogenies, e.g., Crônier et al., Reference Crônier, Auffray and Courville2005; Crônier, Reference Crônier2007) holaspid specimens used in this analysis, 4.83–7.20 mm in sagittal length. Interpalpebral width 5.14–7.88 mm. Descriptions of the thorax are based on three isolated segments. Because all material in this study was disarticulated, the number of segments in the mature thorax cannot be measured. Measurements of pygidial dimensions are based on nine apparent holaspid specimens, 5.16–7.37 mm in sagittal length. Figured material includes four cranidia (OU 238019–238022, Fig. 10), three thoracic segments (OU 238025–238027, Fig. 11), two hypostomes (OU 238023, 238024, Fig. 11), and four pygidia (OU 238028–238031, Fig. 12).
Remarks
The type material described by Ulrich and Delo (Reference Ulrich and Delo1940), and additional material from Butts (Reference Butts1941, pl. 82, figs. 9–13) and Cooper (Reference Cooper1953, pl. 17, figs. 1–15), all come from either the SJ locality or nearby beds in the Edinburg. The morphological features clearly belong to the same species, with other similar Edinburg species such as C. mesleri (Cooper, Reference Cooper1953) and C. loxorachis (Cooper, Reference Cooper1953) having considerably different (more rounded and inflated) cranidia, more tuberculate sculpture, and rounder genal angles. Calyptaulax strasburgensis is also easily distinguished by its highly undulose axial rings (see Fig. 12) and ventrally deflected pygidial pleura. Material from southwestern Virginia (Carlucci and Westrop, Reference Carlucci and Westrop2012, fig. 9E, I) in the Edinburg is also consistent with this morphology. Shaw (Reference Shaw1974) synonymized C. annulata (Raymond, Reference Raymond1905) from the Bromide Formation of Oklahoma (Carlucci et al., Reference Carlucci, Westrop, Brett and Burkhalter2014) with C. strasburgensis. However, the Oklahoma material is considerably different than the Virginia specimens (compare to Shaw, Reference Shaw1974, pl. 10, fig. 23 to Fig. 10). S2 is completely effaced laterally in the Oklahoma material and does not intersect the axial furrow. In addition, S3 of C. strasburgensis is straight, but has a clear inflection in Shaw's C. annulata material. Material from the Viola Springs Formation of Oklahoma (Amati, Reference Amati2004) seems identical to C. strasburgensis from Virginia.
Results
Ontogenetic trajectory
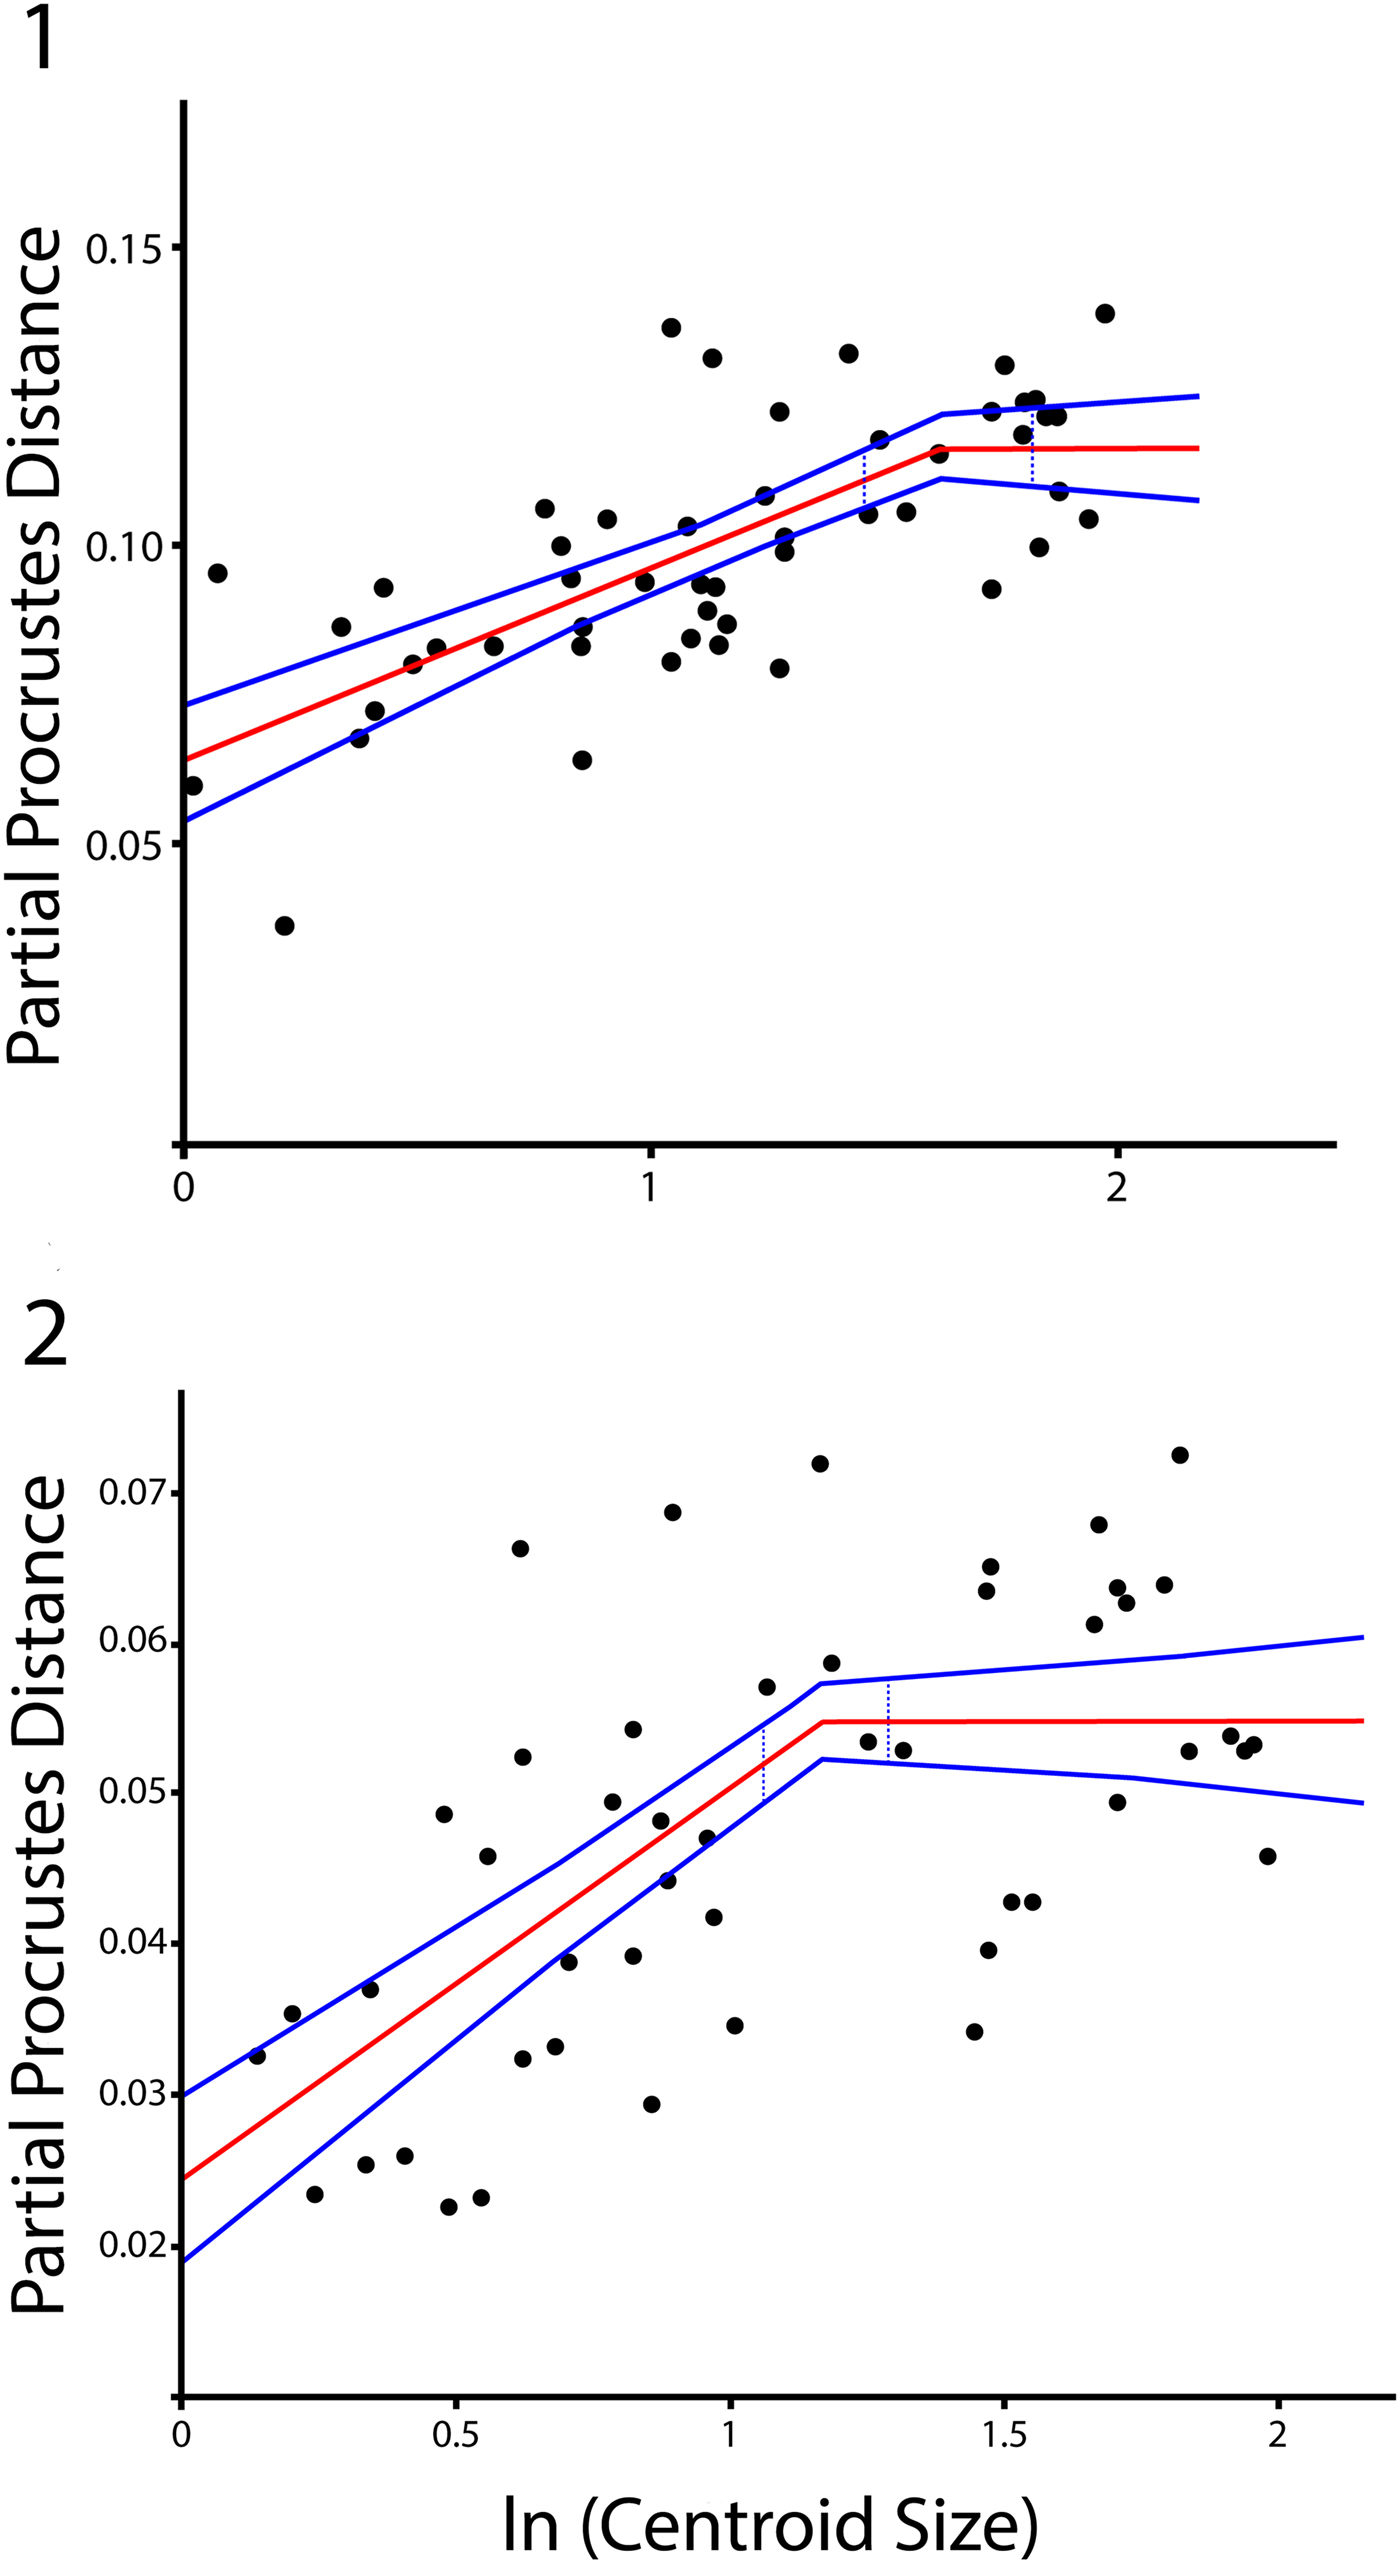
The ontogenetic trajectory of the morphology of C. strasburgensis (Fig. 5.1, 5.2) can be represented, in simplified form, by depicting the relationship between cranidial centroid size and total shape change relative to the reference form. Size or, similarly, age at time of death or ecdysis, is quantified by the measure of centroid size. Net shape change is represented using partial Procrustes distance as a proxy.
Ontogenetic trajectories and breakpoint analysis, showing relationship between partial Procrustes distance and centroid size (log scale). Solid middle line is the two line best fit derived from segmented regression. Outer lines are 95% confidence bounds on trends. Dotted blue lines are 95% confidence bounds on breakpoint location: (1) cranidial ontogenetic trajectory; (2) pygidial ontogenetic trajectory.

Since specimens used in this study were disarticulated, ontogenetic trajectories for cranidial and pygidial growth were characterized separately. Each was visualized by plotting partial Procrustes distance against the natural log of centroid size, producing a scatterplot illustrating the relationship between size and net shape change. For both cranidia and pygidia, a positive correlation was observed following a trend with positive slope at low centroid size and near-zero slope at high centroid size. This demonstrates that shape changed as size increased during the portion of ontogeny sampled here.
Breakpoint analysis
Breakpoint analysis (Table 3) of both the cranidial and pygidial data set found Type 4 relations (linear trend with positive slope at low values of the independent variable combined with a linear trend with 0 slope at values above the breakpoint) for partial Procrustes distance as functions of lnCS to be the best model fit. The cranidial trend (Fig. 5.1, Table 3) has a reported breakpoint at a centroid size of 5.10 (lnCS 1.63), and the pygidial trend (Fig. 5.2, Table 3) has a reported breakpoint at a centroid size of 3.22 (lnCS 1.17) relative to the respective reference forms. The confidence interval test (using regression coefficients, see Oosterban, Reference Oosterbaan2011 for methodology) based on the position of the breakpoint interval within the data range is significant at p <0.05 for both the cranidial and pygidial data set. The segmented regressions for cranidial and pygidial ontogenetic trajectories were also tested in R using the “segmented” package (Muggeo, Reference Muggeo2008), returning breakpoints at log-centroid sizes of 1.46 for pygidia (outside the 95% confidence interval of SegReg) and 1.82 for cranidia (within the 95% confidence interval of SegReg). These results are slightly divergent from the breakpoints identified by SegReg, but the overall trend is comparable. We attribute inconsistency in the identification of the pygidial breakpoint to limitations in areal coverage of the pygidial pleurae. While this study had originally assigned a landmark to the abaxial terminus of the first pleural furrow of the pygidium, difficulties in consistently locating this Type II landmark led to its exclusion from the final analysis. Since the remaining landmarks are restricted to the axis, shape change in the anterior of the pleural lobe is underrepresented in our analysis despite being qualitatively apparent, with the pleurae of larger pygidia having less postero-abaxially deflected anterior margins than those of smaller pygidia. This issue may be remedied in future work by applying outline-based methods to better capture shape variation in the pleurae. In this study, however, the trend of total shape change as a function of specimen size in the pygidia is less distinct and the breakpoint less consistently located than the corresponding trend in the cranidia, which is likely the result of this coverage limitation.
Results of segmented regression (“breakpoint analysis”) of y upon x with optimal breakpoint (Bp, in lnCS units). Left is the cranidial analysis and right is the pygidial. RC = regression coefficient, AvX = the average of the X values smaller or larger than Bp, AvY = the average of the Y values smaller or larger than Bp. X = the distance along the horizontal axis. SD = standard deviation, CD = the Coefficient of Determination.

Meter-level homogeneity
Pairwise comparisons (22 x 26, F-score 1.27, p > 0.05; 22 x 34.6, F-score 1.85, p > 0.05; 26 x 34.6, F-score 1.94, p > 0.05) of subgroup means found no significant difference in shape between cranidia from different meter levels, using Goodall's bootstrapped F-test. Similar tests performed on the mean shapes of pygidial (22 x 26, F-score 1.46, p > 0.05; 22 x 34.6, F-score 1.24, p > 0.05; 26 x 34.6, F-score 1.51, p > 0.05) meter level-based subgroups also failed to find any significant difference in shape between the three levels sampled.
Using size-standardized data, we sampled each portion of the ontogenetic trajectory (pre and post breakpoint) among samples, with trajectories calculated on a sample by sample basis, and then compared with Goodall's F-test. Due to the relatively few specimens with centroid size larger than the reported breakpoints (10 cranidia and 21 pygidia across all meter levels), investigation of apparently morphologically mature individuals is not feasible with this data set. No cranidia with centroid size smaller than the breakpoint were used from the 22 meter level. The 26 x 34.6 pairwise comparison of size-standardized pre-breakpoint cranidia did find a small but statistically significant difference in mean shape (p < 0.05, F-score 2.88). Among pre-breakpoint pygidia, the 22 x 26 (p > 0.05, F-score 1.26) and 22 x 34.6 (p > 0.05, F-score 0.75) comparisons showed no statistically significant differences. The 26 x 34.6 comparison for the pygidia, however, did return a small but significant difference (p < 0.05, F-score 1.92). While the small size of the 34.6 pre-breakpoint pygidial data set (N = 5) does call this result into question.
As noted by Webster (Reference Webster2011), comparison of mean shape is more meaningful when based on the variance attributable to allometry is removed by standardization. However, in this instance the presence of comparisons being significant is not interpreted to be taxonomically or morphologically meaningful. Due to the natural asymmetry in the data set (some levels having more or less cranidial and pygidial specimens, and some datasets having more or less pre or post breakpoint specimens) the significance is likely just an artifact of distribution differences from low sample size. However, the possibility remains that there are extremely subtle within-species morphological differences among the samples (e.g., Hopkins and Webster, Reference Hopkins and Webster2009). A detailed review of the alpha taxonomy (see Systematic Paleontology) across meter levels also suggests the specimens are all the same species based on a unique assemblage of discrete characters (presumably apomorphies and autapomorphies, following the phylogenetic species concept, although identifying the polarity of all the characters with a phylogenetic analysis of the entire genus is beyond the scope of the paper). The sample sizes are also far too small to speculate on the presence of within-species evolutionary change between the meter levels.
Multivariate regression
Growth became less strongly allometric after the breakpoint, with strong allometric growth restricted to the pre-breakpoint section of the ontogenetic trajectory (Table 4). Multivariate regression of superimposed pre-breakpoint (N = 40) cranidial landmark configurations against lnCS (Table 4) found total variance (summed squares of Procrustes distance from each landmark to the corresponding location on the reference form) equal to 0.1866, of which the residual portion was 0.144. The proportion of total variance explained by allometry is therefore 22.846%. Goodall's bootstrapped F-test (p < 0.01, F-score 11.548) showed a significant component of pre-breakpoint cranidial shape variance attributable to allometric growth. In post-break cranidia (N = 12), only 7.417% of variance was attributable to allometry, and the allometric component was not statistically significant (p = 0.563, F-score 0.801).
Results of multivariate regression against lnCS. SStotal = summed squares of Procrustes distance from each landmark to the corresponding location on the reference form. P-value is based on 10000 bootstraps.

The corresponding analysis applied to the pre-breakpoint (N = 27) pygidial dataset produced 0.0394 total variance and 0.0347 residual variance. Variance of pygidial shape is 12.001% explained by allometry; this result was also subjected to Goodall's bootstrapped F-test (p < 0.01, F-score 3.409), indicating a significant component of pygidial shape variance attributable to allometric growth (Table 4). In post-break pygidia (N = 21), allometry explained only 4.581% of total variance and was, as with post-break cranidia, not statistically significant (p = 0.483, F-score 0.912).
Thin plate splines and relative warp analysis
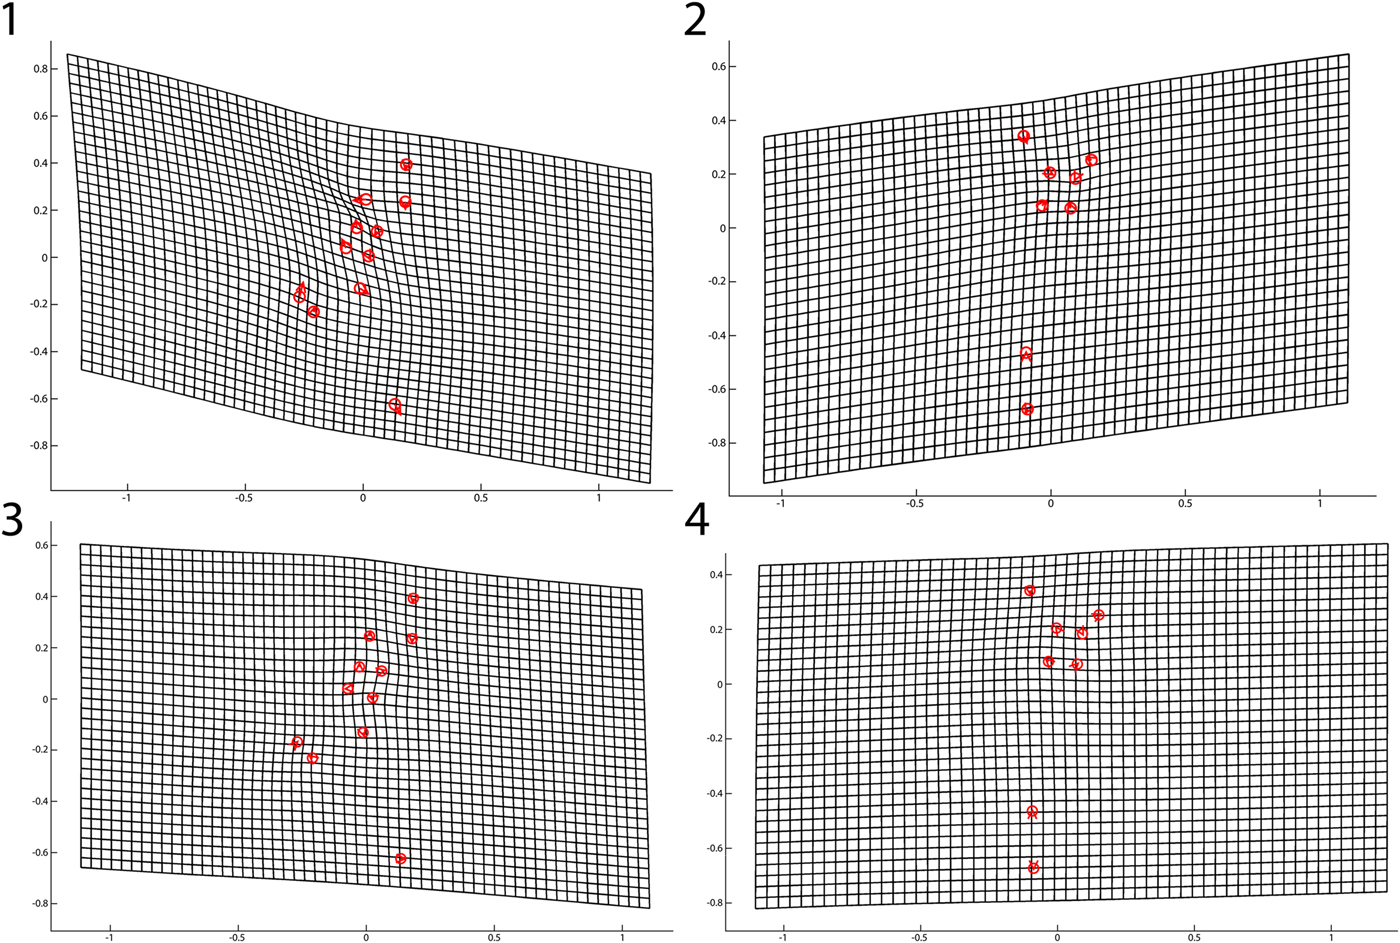
Thin plate spline diagrams were produced in order to illustrate overall trends in shape deformation compared to the reference form. Landmark representations of the cranidial and pygidial reference forms (the mean of the five smallest specimens in each set) were superimposed on standard grids. These representations were then altered along the net shape change vectors (of cranidial and pygidial shape change, respectively), and the grids deformed correspondingly.
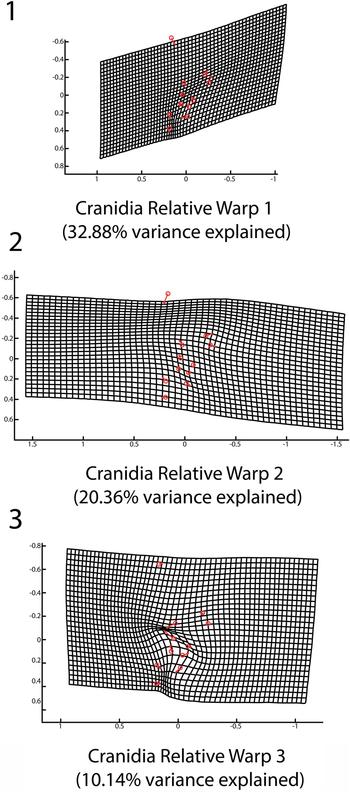
This process was repeated not only for net shape change derived from regressed shape variables from lnCS (Fig. 6.1, 6.2), but also for the first three relative warps derived from the RW analysis (Figs. 7–9). This allowed for the graphical representation of mathematically orthogonal components of allometry.
Thin plate spline deformations derived from the multivariate regression. The thin plate splines show how the shape of the reference form is deformed using the associated vector of ontogenetic shape change for that sclerite: (1) pre-breakpoint cranidial thin plate spline; (2) pre-breakpoint pygidial thin plate spline; (3) post-breakpoint cranidial thin plate spline; (4) post-breakpoint pygidial thin plate spline.

Relative warp bivariate plots. Relative warps are the product of PCA performed on warp scores derived from regression of shape change variables on lnCS: (1) cranidial RW1 versus RW2; (2) cranidial RW1 versus RW3; (3) pygidial RW1 versus RW2; (4) pygidial RW1 versus RW3.

Cranidial relative warp thin plate spline. Thin plate spline deformation grids are shown representing the shape change component associated with each cranidial relative warp: (1) RW1 (32.88% total variance explained); (2) RW2 (20.36% total variance explained); (3) RW3 (10.14% total variance explained).

Pygidial relative warp thin plate spline. Thin plate spline deformation grids are shown representing the shape change component associated with each pygidial relative warp: (1) RW1 (37.76% total variance explained); (2) RW2 (23.73% total variance explained); (3) RW3 (12.38% total variance explained).

Cranidia of Calyptaulax strasburgensis. (1–3) OU 238019, dorsal, anterior, and lateral views; (4–6) OU 238020, dorsal, anterior, and lateral views; (7–9) OU 238021 dorsal, anterior, and lateral views; (10–12) OU 238022, dorsal, anterior, and lateral views.

Hypostome and thoracic segments of Calyptaulax strasburgensis. (1, 2) OU 238023, dorsal and lateral views; (3, 4) OU 238024, dorsal and lateral views; (5–8) OU 238025, anterior, posterior, dorsal, and lateral views; (9, 10) OU 238026, dorsal and lateral views; (11, 12) OU238027, dorsal and lateral views. Figure 11.10 has been reflected as to be in the same orientation as 11.8 and 11.12.

Pygidia of Calyptaulax strasburgensis. (1–3) OU 238028, dorsal, posterior, and lateral views; (4–6) OU 238029, dorsal, posterior, and lateral views; (7–9) OU 238030, dorsal, posterior, and lateral views; (10–12) OU 238031, dorsal, posterior, and lateral views.

The thin plate spline derived from net shape change regressed on lnCS for the cranidia (Fig. 6.1) shows a posterior warping of the abaxial portion of the cranidia, exsagittal compression of L1, a lateral expansion of the glabella, and an associated postero-lateral deflection of the anterior portion of the palpebral lobe. The corresponding thin plate spline describing net shape change for the pygidia (Fig. 6.2) demonstrates anterior migration of the anterior pleural margin and sagittal compression and lateral expansion of the first axial ring. Relative to the reference forms, increases in centroid size were associated higher magnitude deformation within pre-break data sets (Fig. 6.1, 6.2) than within the post-break sets (Fig. 6.3, 6.4), whose allometric component was not statistically significant.
In the analysis of the cranidia, the first RW (Figs. 7.1, 7.2, 8.1) explained 32.881% of the total variance and relates to a lateral narrowing of the occipital ring and of the three posterior glabellar lobes, as landmarks C7, C8, and C9 migrated adaxially relative to the reference form. This warp component also demonstrated a shortening (sag.) and broadening (antero-lateral) of the anterior lobe of the glabella, as C3 migrated posteriorly and C10 and C11 migrated antero-abaxially. The second RW, accounting for 20.361% of the total variance (Figs. 7.1, 8.2), reinforced this shortening with a similar posterior displacement of C3, but was marked most strongly by an expansion and adaxial displacement of the third glabellar lobe. The third RW (Figs. 7.2, 8.3) explained 10.143% of the total variance. Relative to the reference form, it indicated an expansion of the first glabellar lobe (posterior displacement of C2 and C7, anterior displacement of C4 and C8) and a corresponding antero-adaxial displacement of the second glabellar lobe and compression of the adaxial aspect of the third glabellar lobe. All further relative warps explained <10% of the total variance and were not considered.
The first pygidial RW (Figs.7.3, 7.4, 9.1) explains 37.775% of the total variance, and shows a posterior displacement of P1 and a slight anterior displacement of P8, relative to the reference form, indicating an anterior migration of the pygidial pleural lobe and anterior margin. The second RW (Figs. 7.3, 9.2), which explained 23.726% of total variance, relates to a posterior displacement of P2 and an anterior migration of P3, indicating a relative narrowing (sag.) of the pygidial margin at the posterior aspect of the pygidium. The third RW (Figs. 7.4, 9.3) explained 12.380% of total variance and demonstrated a modest expansion of the second axial ring (antero-abaxial displacement of P4) and a slight expansion of the pygidial margin (anterior displacement of P2). As with the cranidial analysis, no other relative warps explained 10% or more of total variance.
Discussion
Allometric shape change in the cranidium
Over the course of ontogeny, juveniles of Calyptaulax strasburgensis underwent progressive change in cranidial shape followed by a decrease in the rate of change. Plots of the ontogenetic trajectory show a positive correlation between partial Procrustes distance (a metric of total shape change relative to the reference form) and the natural logarithm of centroid size (a proxy for individual size and therefore individual age) that displays an apparent “leveling out” effect (decreased slope) at higher centroid size values. This is consistent with observations from studies applied to the ontogeny of other trilobites (e.g., Kim et al., Reference Kim, Sheets, Haney and Mitchell2002; Crônier et al., Reference Crônier, Auffray and Courville2005; Delabroye and Crônier, Reference Delabroye and Crônier2008; Hopkins and Webster, Reference Hopkins and Webster2009). Most notably, Crônier et al. (Reference Crônier, Auffray and Courville2005) and Crônier (Reference Crônier2007, Reference Crônier2013) have demonstrated that in Devonian phacopids, allometric change is mostly restricted to the protaspid and meraspid periods even more so than in other trilobite groups. Our work supports those data, and further suggests that this developmental pattern was already present in phacopids as early as the Upper Ordovician.
Qualitatively, thin plate spline deformation grids produced from the regression (Fig. 6) show an overall trend towards an allometric broadening (tr.) and expansion of the glabella over the course of the studied span of the organism's life history. This enlargement of the glabella, and associated postero-abaxial displacement of the palpebral lobes, has been documented in other ontogenies, including in most phacopids, such as Nephranops (Crônier, Reference Crônier2007) and Phacops (Chatterton, Reference Chatterton1971), and may have reflected changes in the feeding habits of Calyptaulax. A larger glabella relative to overall organism size may have allowed for the handling of larger prey items or a shift in the types of food sources consumed, broadening the predatory niche of mature individuals. Quantitative biofacies studies (Carlucci and Westrop, Reference Carlucci and Westrop2012, Reference Carlucci and Westrop2015) have consistently shown that Calyptaulax is one of the most cosmopolitan Ordovician trilobite genera, suggesting that enlargement of the glabella could coincide with an expansion of predatory niche and habitat with maturity. Fortey and Owens (Reference Forty and Owens1999) also suggested that the swollen glabella of phacopids and impendent hypostomal condition suggested advanced predatory habits, with the enlarged stomach modified as a type of gastric mill. However, due to the lack of paleoecological data relating Calyptaulax to its prey (and the likely low preservation potential of the soft-bodied prey items on which it is thought to have fed), this proposed explanation must remain speculative. Chatterton and Speyer (Reference Chatterton, Speyer and Kaesler1997) also noted that the onset of sexual maturity could be apparent from an inflection of a growth curve and a corresponding change in allometry, which suggests major changes in reproductive strategy at this particular “event” during ontogeny. This is presumed to take place in the holaspid period at a much larger size, though independent evidence of sexual maturity in Calyptaulax (and indeed most trilobites) is lacking.
Allometric shape change in the pygidium
The ontogenetic trend of shape change in the pygidium follows a similar pattern to that of the cranidia. Partial Procrustes distance for a given specimen (relative to the reference form) increases steadily and approximately linearly with lnCS of the specimen for specimens with centroid size below the breakpoint, with a nearly flat slope for specimens with centroid size beyond the breakpoint.
While shape change in the pygidium (Fig. 9) is not as qualitatively dramatic as shape change in the cranidium over the interval studied, the percentage of variance attributed to allometry is statistically significant, and some patterns do emerge. Thin plate spline deformations show a posterior migration of the medial portion of the pygidial axis coupled with a relative anterior movement of the lateral portion of the axis, suggesting a change in the curvature of the anterior margin of the pygidium; larger specimens would have a less strongly convex anterior margin, possibly associated with allometric scaling of the articulating facet of the pygidium relative to overall pygidial size. However, due to missing coverage of the pleurae, this apparent change in shape remains tentative.
Landmark-based morphometric studies of trilobite ontogeny do suffer from questions of homology when the anterior aspect of the pygidium is included. As explained previously, the second pygidial segment in one meraspid instar is physiologically the same segment as the first pygidial segment in the successive instar due to the release of segments from the pygidium into the thorax. Due in part to this issue, previous work of this nature has typically been restricted to cranidial data. However, the influence of the articulation with the thorax remains a strong control on shape at the anterior of the pygidium, one that (thanks to the relative morphological uniformity of the segments of the thorax) remains essentially constant throughout development, implying that the segmental shape associated with a given position within the pygidium, if not the specific segment associated with that position, is potentially inherited across instars. However, complete evaluation of this idea would require articulated specimens.
Implications and the nature of allometric shape change during ontogeny
The existence of apparent inflections in the ontogenetic trajectories of both cranidia and pygidia suggests that Calyptaulax strasburgensis likely underwent a distinct change in its growth form as a meraspid (based on the size range of previously published phacopid ontogenies), with less change as an adult. While we cannot directly pinpoint the exact instar (Fig. 2) that corresponds to the completion of the thorax, a pertinent question for future research is whether the overall trends of the ontogenetic trajectories are consistent with a proposed physiological change in growth contemporaneous with the completion of the thorax. Or alternatively, is the “final shape” during ontogeny independent of the completion of the thorax, variable across taxonomic groups, or dependent on other developmental or environmental conditions? In order to encourage more discussion on the timing of these changes in allometry, we propose a new term, holeidos (“complete form” from the Greek).
We define holeidos as: a point during late meraspid or early holaspid ontogeny in a trilobite population at which the rate of shape change in the cranidium and pygidium between successive molts decreases. Therefore it specifically references the rate of shape change at the breakpoint, although some species might retain weak allometric growth beyond that point, while many (as with C. strasburgensis) reach their “complete form” and are indistinguishable from isometry. This concept may not be applicable to all trilobites. Some taxa may undergo continuous shape change throughout meraspid and holaspid development without any single point of inflection along the ontogenetic trajectory. It is also plausible for individuals within a population of some taxon to experience such a slowdown in shape change at different molt stages as a result of environmental factors or genetic variation rather than uniform growth patterning. The degree to which the holeidos concept is applicable across trilobites as a whole and whether any phylogenetic or ecological patterns of holeidos or non-holeidos growth exist will require further study of additional taxa.
Two segmentation-defined ontogenetic transitions associated with maturation are well known in trilobites: the completion of the thorax and the completion of the trunk. While these transition points do not necessarily coincide, with hypoprotomeric, synarthromeric, and protarthrous developmental modes all known from the fossil record, they are part of the same changeover from immature to mature body form (Hughes et al., Reference Hughes, Minelli and Fusco2006).
Our proposed holeidos concept supplements these by identifying a threshold derived from sclerite morphology rather than segment count and distribution. Due to the disarticulation of the studied material, it cannot be determined whether holeidos and holaspis occur in the same molt in Calyptaulax, but sagittal lengths of pre- and post-holeidos specimens are consistent with contemporaneity of the two transitions. A similar conclusion was drawn by Kim et al. (Reference Kim, Sheets, Haney and Mitchell2002) in a study of Triarthrus becki (Walcott, Reference Walcott1879), identifying the meraspid-holaspid transition with a decrease in the rate of allometry based on comparisons to the lengths of known latest meraspids and earliest holaspids, although no explicit breakpoint was calculated.
Even among animals with indeterminate or attenuating-determinate growth, including many arthropods, maturation is often associated with stability in shape (Hartnoll, Reference Hartnoll1983; Sebens, Reference Sebens1987). Because juvenile or sub-adult forms are growth-focused while adult forms are reproduction-focused, this is to be expected; a reduction in resources allocated to further growth is unfavorable to dramatic reshaping of existing form. Additionally, the presence of a stable adult shape in an organism's ontogeny may be favored over evolutionary timescales under some circumstances, because a determinate form can more precisely adapt to a given stable environment.
Ontogenetic correlation between cranidia and pygidia
The consistency of the cranidial and pygidial ontogenetic trajectories provides some support for the use of pygidial landmarks in geometric morphometric studies. Despite the aforementioned concerns of segment homology across meraspid instars, the first pygidial segment has the same general form across multiple instars, despite it being a different segment with each molt, because the articulation with the thorax constrains its shape. Due to the disarticulated nature of the studied fossil material, the ontogenetic trajectories of the cranidia and pygidia cannot be directly correlated; it is plausible that the apparent breakpoints may represent a single point in the organism's ontogeny. While breakpoints in the slope of the ontogenetic trajectory were observed for both cranidia and pygidia, it remains uncertain whether those breakpoints correspond to a single developmental period or whether growth modes of the cranidia and pygidia alter at different points in the organism's life history. Due to the disarticulation of the specimens used in this study, it is not possible to directly correlate cranidium size with pygidium size. However, the transition from obviously morphologically immature (pre-breakpoint) instars (see Fig. 2) to an adult morphology (post-breakpoint, decrease in allometry) is located at approximately the same point in the ontogenetic trajectory (Fig. 5). Comparison with other similarly proportioned Ordovician Calyptaulax species allows for a rough comparison between centroid size of articulated adult cranidia and pygidia. Assuming the breakpoints derived from the segmented regression represent the same point in ontogeny, the adult form of C. strasburgensis has a cranidial/pygidial ratio (based on centroid size) of 1.58. Two larger and non-silicified, articulated adult holaspids of C. cf. C. strasburgensis yielded cranidial to pygidial ratios of 1.31 and 1.47. Articulated specimens of C. callicephalus (Hall, Reference Hall1847) and C. armatus (Ulrich and Delo, Reference Ulrich and Delo1940) had a cranidial/pygidial ratio of 1.55 and 1.19, respectively, using the same landmarks that were applied to C. strasburgensis. At the very least, this suggests the breakpoints and corresponding decrease in allometric change of the individual sclerites are within a reasonable range to be ontogenetically correlated. Small sample size of articulated specimens makes a more robust comparison impossible.
Morphometric studies of post-protaspid ontogeny in other groups of trilobites suggest this shift in allometry is relatively widespread; and can be generally coincident or contemporaneous with the completion of the thorax, as it has been observed in the olenelid Triarthrus beckii Green, Reference Green1832 (Kim et al., Reference Kim, Sheets, Haney and Mitchell2002), the trinucleid Marrolithus bureaui Oehlert, Reference Oehlert1895 (Delabroye and Crônier, Reference Delabroye and Crônier2008), and the remopleuridid Haniwa quadrata Kobayashi, Reference Kobayashi1933 (Park and Choi, Reference Park and Choi2010). In other instances, such as in Cryptolithus tesselatus Green, Reference Green1832 (Hopkins and Pearson, Reference Hopkins and Pearson2016), the decrease in allometry occurred before the holaspis period was reached. This has noteworthy implications for the processes governing trilobite evolution, and demonstrates why the holeidos concept is useful for describing variation in these allometric patterns. Studies of trilobites and of extant organisms suggest that evolutionary changes in morphology can occur through heterochrony during juvenile or larval development (Webster and Zelditch, Reference Webster and Zelditch2005; Crônier, Reference Crônier2013), sometimes through changes in the activation of Hox genes or homologs (Gellon and McGinnis, Reference Gellon and McGinnis1998; Akam et al., Reference Akam, Averof, Castelli-Gair, Dawes, Falciani and Ferrier1994). The prevalence of allometric growth in the cranidium and pygidium during immaturity followed by more isometric growth during maturity suggests that evolutionary change, including speciation, may have taken place through alterations in the scale and timing of shape change, likely more concentrated during the meraspid period.
Further study
The current study found support for a gradual enlargement (lateral expansion) of the glabella, and anecdotally, the glabellae of larger specimens appear more bulbous and inflated to the eye. However, our methodology was limited by the availability of visually identifiable surface features, preventing a comprehensive study of shape change specifically of the glabella; the anterior lobe of the glabella is particularly poorly covered due to the lack of furrows. Accurate three-dimensional representation of glabellar inflation may allow more rigorous assessments of changes in otherwise sparsely covered regions of the organism, such as the pleural lobes of the pygidia. Such an approach would also allow for the detection of changes in exoskeletal curvature and the dorsal or ventral migration of points of interest (i.e., shape change not confined to a single plane).
Conclusions
This analysis demonstrates statistically significant allometric shape change in both the cranidia and pygidia of C. strasburgensis over the course of development of eight apparent instars. Younger individuals had comparatively wider glabellas (relative to overall cranidial size) and noticeably reshaped pygidia with a more triangular outline and less convex anterior margin. Crucially, this shape change is concentrated in early development (presumably in the meraspid stage); both cranidia and pygidia initially (at small sizes) follow a trend of approximately linear shape change relative to the smallest specimens, and at larger sizes follow a successive trend with near-zero shape change. This sharp decrease in the rate of allometry, present in both tagmata studied, is consistent with a purported physiological change in growth patterning that we termed a transition to a holeidos (complete form) period of development, which may or may not be independent of the completion of the thorax.
The most dramatic qualitative change observed in C. strasburgensis is the lateral expansion of the glabella; similar glabellar broadening during ontogeny has been observed in other phacopids, such as the early Devonian Plagiolaria poothaii Kobayashi and Hamada, Reference Kobayashi and Hamada1968 (Crônier and Fortey, Reference Crônier and Fortey2006). This may reflect a change in feeding habit during development, and may be relevant to paleoecological studies of phacopids.
Similar patterns of ontogeny have been reported in other phacopids. Landmark-based morphometric characterization of the ontogeny of the Late Devonian phacopids Trimerocephalus lelievrei Crônier and Feist, Reference Crônier and Feist1997 and Weyerites ensae Richter and Richter, Reference Richter and Richter1926 concludes that both experienced allometric growth of the cephalon and pygidium primarily as meraspids, with holaspid molts producing less shape change and more growth in size (Crônier et al., Reference Crônier, Renaud, Feist and Auffray1998, Reference Crônier, Auffray and Courville2005). The appearance of this growth strategy in Calyptaulax significantly extends its temporal range among phacopids; its presence in a mid-Ordovician taxon indicates that it is not specific to Devonian phacopids.
Acknowledgments
The authors are grateful to J. Price for the use of lab equipment and editing, S. Westrop for the aid in the field collection of samples, J. McDaniel for graciously assisting with the lab work, and R. Burkhalter for providing collections support at the Sam Noble Oklahoma Museum of Natural History. M. Webster and L. Laibl provided valuable insight and suggestions, which greatly improved the manuscript.