INTRODUCTION
Problems of complex interactions are common in many fields, including medicine, economics and ecology (Levins Reference Levins1974). In ecology, much attention has been given to describing food webs and interactions among species (Paine Reference Paine1966; May Reference May1974; Pimm et al. Reference Pimm, Lawton and Cohen1991; Dunne et al. Reference Dunne, Williams and Martinez2002a). But often these food webs are nested within larger ecological or social–ecological contexts where exogenous forces influence components of the food web system. External forcings may include physical drivers, anthropogenic impacts or ecosystem components that are not characterized within the focal network. In social–environmental systems, tools that incorporate ecological properties, abiotic variables and management actions within the same analytical framework are needed to accurately understand the dynamics of complex systems and to evaluate potential management actions (Liu et al. Reference Liu, Dietz, Carpenter, Folke, Alberti, Redman, Schneider, Ostrom, Pell, Lubchenco, Taylor, Ouyang, Deadman, Kratz and Provencher2007). However, rarely are compatible datasets available for this type of analysis. Here we use a qualitative network model – a conceptually based modelling approach – and a suite of simulations to address questions about the relative impacts of human and natural influences on early marine survival of juvenile salmon.
In recent years, attention has turned to marine life-history stages of Pacific salmon (Oncorhynchus spp.) in an effort to understand population declines and the subsequent failure to rebound given myriad conservation and restoration efforts in freshwater streams. In Chinook salmon, coho salmon, and steelhead (Oncorhynchus tshawytscha, Oncorhynchus kisutch and Oncorhynchus mykiss, respectively), declines in marine survival have been evidenced within the Salish Sea (Puget Sound, WA, USA, and the Strait of Georgia, BC, Canada) that have not been seen in coastal populations (Beamish et al. Reference Beamish, Sweeting, Lange, Noakes, Preikshot and Neville2010; Johannessen & McCarter Reference Johannessen and McCarter2010; Zimmerman et al. Reference Zimmerman, Irvine, O'Neill, Anderson, Greene, Weinheimer, Trudel and Rawson2015; Ruff et al. Reference Ruff, Anderson, Kemp, Kendall, Mchugh, Velez-Espino, Greene, Trudel, Holt, Ryding and Rawson2017; Kendall et al. Reference Kendall, Marston and Klungle2017). These inland water bodies serve as habitats for juvenile salmon as they pass from natal streams to ocean waters during their outmigration. Yet because of complex anthropogenic changes brought about by population increases and the associated human activity in these waters, it is likely that a number of factors and their cumulative – synergistic or additive – effects are contributing to early marine mortality. Other salmon species, such as chum, pink and sockeye salmon (Oncorhynchus keta, Oncorhynchus gorbuscha and Oncorhynchus nerka, respectively) have not experienced similar declines (Debertin et al. Reference Debertin, Irvine, Holt, Oka and Trudel2017), suggesting that life-history characteristics may also contribute to increased mortality for some species in this region. Teasing apart which factors have negatively impacted the survival of juvenile salmon in marine waters is of concern to local, regional and federal governments and other stakeholders (e.g. the Salish Sea Marine Survival Project, http://marinesurvivalproject.com/) and management actions are being sought to lessen these impacts and increase survival during this period.
Correlative studies of salmon abundance and environmental factors have been ongoing in the greater region for many years (Pearcy Reference Pearcy and McNeil1988; Beamish et al. Reference Beamish, Noakes, McFarlane, Pinnix, Sweeting and King2000; Teo et al. Reference Teo, Botsford and Hastings2009; Burke et al. Reference Burke, Peterson, Beckman, Morgan, Daly and Litz2013). Food web models for the Strait of Georgia (Preikshot Reference Preikshot2008) and Puget Sound (Harvey et al. Reference Harvey, Williams and Levin2012) show primary production as an important driver in the biological system, as well as the effects of top predators in creating trophic cascades and influencing food web dynamics in the mid-trophic levels where time-series data are sparse (Harvey et al. Reference Harvey, Williams and Levin2012). Even with an understanding of the main variables in a given system, measuring abundances of each variable and the flux of energy among them often poses a logistical challenge (Christensen & Walters Reference Christensen and Walters2004). These models do not easily incorporate non-fisheries anthropogenic impacts, such as habitat loss or contaminant exposure, yet we understand that, in many systems, diverse but cumulative impacts can play a role in species population change. For this reason, conceptually based models, incorporating a broader array of variables, are an important tool in providing an integrated picture of ecological and human drivers of ecosystem change.
One tool for evaluating the relative influence of ecosystem components is qualitative network modelling (QNM; also called qualitative network analysis or loop analysis) (Levins Reference Levins1974; Puccia & Levins Reference Puccia and Levins1985; Raymond et al. Reference Raymond, McInnes, Dambacher, Way and Bergstrom2011; Melbourne-Thomas et al. Reference Melbourne-Thomas, Wotherspoon, Raymond and Constable2012; Harvey et al. Reference Harvey, Reum, Poe, Williams and Kim2016), which is advantageous for understanding a system of complex interactions that are not fully specified and when precise measurement is impossible, but when some mechanistic understanding of the interactions exists. It allows for the testing of competing hypotheses given different model structures or the invocation of perturbations to one or more of the model variables. QNM does not explicitly include non-linear direct effects, which occur in and influence social and ecological systems; however, it may help to determine the relative impacts of competing hypothesized factors or indicate where empirical work could be focused in order to improve system understanding (Levins Reference Levins1974).
Researchers have used QNM for evaluating ecosystem responses to ocean acidification in shellfish management (Reum et al. Reference Reum, Ferriss, McDonald, Farrell, Harvey, Klinger and Levin2015) and the impacts of eutrophication and species management within a food web (Carey et al. Reference Carey, Levin, Townsend, Minello, Sutton, Francis, Harvey, Toft, Arkema, Burke, Kim, Guerry, Plummer, Spiridonov and Ruckelshaus2014), as well as for discerning the impact of management actions on species recovery (Harvey et al. Reference Harvey, Reum, Poe, Williams and Kim2016) in the Pacific Northwest. QNM is an important conceptual tool for determining the relative impacts of ecosystem components from which more complex, data-driven modelling efforts can stem. Here we apply this technique in order to evaluate a suite of potential drivers thought to be contributing to increased early marine mortality in a group of Pacific salmon in the Salish Sea. Using a simulation framework, we invoke perturbations to each model variable and suites of variables based on salmon early marine survival hypotheses and assess the model responses related to the salmon species of concern. This work is a foundational step in understanding the impacts of multiple drivers of marine survival declines in Salish Sea salmon.
METHODS
We used QNM to address our primary question regarding the relative impacts of various factors on salmon early marine survival. Our analysis had three main steps: (1) construct an enhanced conceptual model showing positive, negative and neutral relationships; (2) generate a pool of stable simulated models with random weights applied to each model linkage; and (3) invoke one or more perturbations based upon mechanistic understanding of the system and determine the model response.
Conceptual model
To construct our conceptual model of the Salish Sea system, we gathered existing literature and experts on ecosystem components from within and outside of the project technical team. The technical team includes scientists from resource agencies, universities and tribal entities, with expertise ranging from salmon genetics to disease ecology to numerical ocean modelling. We began by developing a list of over 40 possible variables drawn from hypotheses about the decline of Pacific salmon survival within the system (Salish Sea Marine Survival Project hypotheses, http://marinesurvivalproject.com/the-project/key-hypotheses/). The variables included: physical forcings; biological components from primary production to top predators and competitors; and anthropogenic variables. We drew a draft model based upon our knowledge of the system and existing literature and then we conducted small meetings with experts on particular components, such as disease ecology or oceanography, and iteratively developed a working conceptual model. We sought out additional feedback from those working within the Salish Sea but not on the technical team on both the model components and structure, and received further feedback during public presentations to refine the conceptual model.
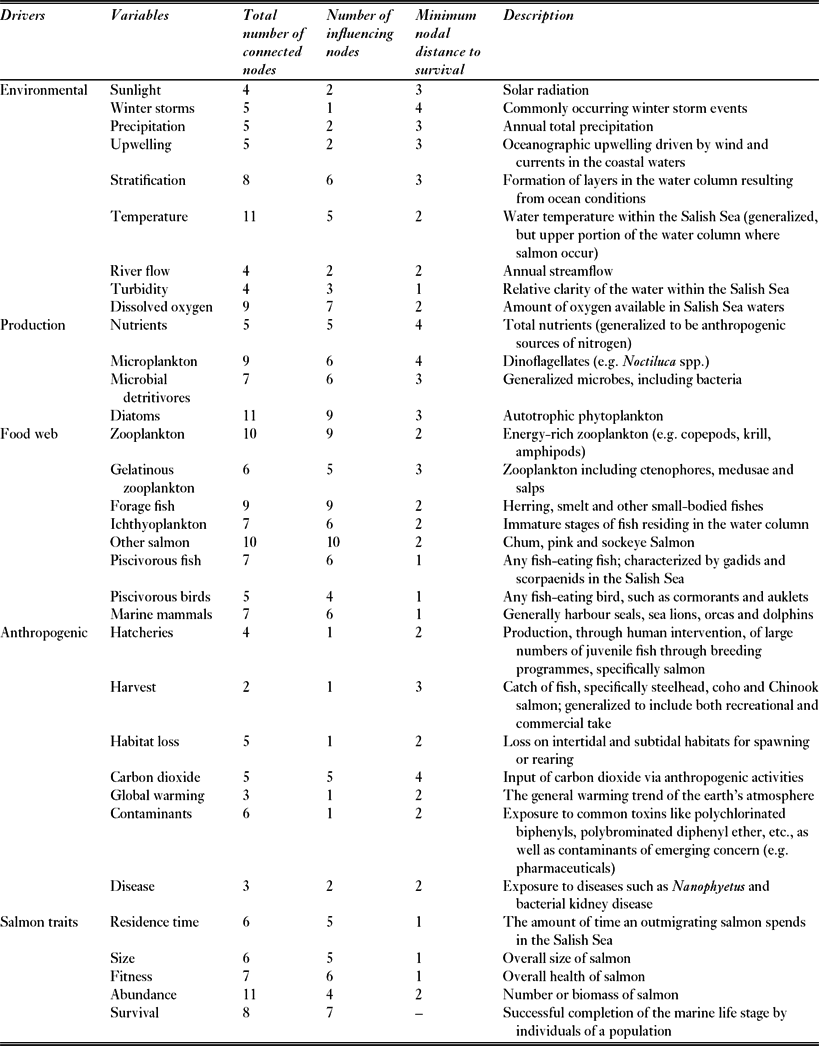
For the final model, we grouped model variables into several driver groups: environmental factors, primary production, food web interactions and anthropogenic impacts (Table 1). While the conceptual model is not exhaustive, it does include many of the drivers identified in our working hypotheses and reflects known interactions within the ecosystem. The inclusion of model variables that are not biomass pools (e.g. temperature and habitat loss) highlights the flexibility of the qualitative modelling approach. Focusing on physical, bottom-up, top-down and anthropogenic factors fits with the working hypotheses of the Marine Survival Project and enabled exploration of combinations of diverse variables.
Descriptions of model nodes (variables) in the Salish Sea qualitative network model by driver group. Also shown are connectivity among nodes, the number of influencing nodes and the distance to the survival node.

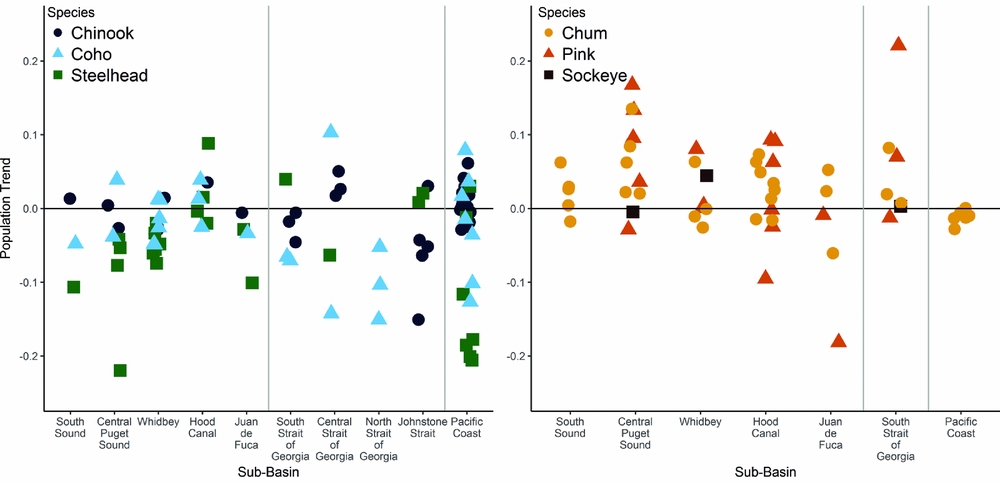
The emphasis of the modelling effort was on understanding sources of decreased survival of the focal salmon species (Chinook, coho and steelhead), which have shown an overall declining population trend (Fig. 1, left panel; see Appendix 1 for details, available online), in addition to a decline in marine survival (Zimmerman et al. Reference Zimmerman, Irvine, O'Neill, Anderson, Greene, Weinheimer, Trudel and Rawson2015; Ruff et al. Reference Ruff, Anderson, Kemp, Kendall, Mchugh, Velez-Espino, Greene, Trudel, Holt, Ryding and Rawson2017; Kendall et al. Reference Kendall, Marston and Klungle2017). Central to our approach was specifying multiple salmon characteristics as modelled network nodes, namely size, fitness, residence time, abundance and survival. We used these traits as primary response variables throughout our analysis. While marine survival (herein ‘survival’) was our principal variable of interest, we included additional traits to evaluate the relative impact on metrics of salmon performance. We included ‘other salmon’ as a model variable, representing pink, chum and sockeye salmon, because the migration timing of all Pacific salmon species means that competitive interactions occur. However, the species represented by the ‘other salmon’ variable have not experienced the same negative population trends (Irvine & Ruggerone Reference Irvine and Ruggerone2016; see Fig. 1 and Appendix 1 for details) and are seen as important to the analysis but different from the focal species. While the emphasis was on representing the most direct impacts on the focal salmon traits, we recognize that many of the model variables (e.g. temperature) could potentially have direct connections to other model nodes; we have included these where interactions were important for understanding the implications for the focal salmon variables or where existing literature has shown strong connections.
Salmon population trends within Puget Sound (left-most sub-basins), the Strait of Georgia (centre sub-basins) and the Pacific Coast (right-most sub-basins) for species with generally decreasing trends (Chinook, coho and steelhead, left) and increasing or stable populations trends (chum, pink and cockeye, right). Two abnormally high pink salmon runs were omitted from the right panel for ease of presentation – these runs had trends of 1.05 and 0.43 and were both from Puget Sound sub-basins. Data are from Washington Department of Fish and Wildlife, Pacific States Marine Fisheries Commission, Ogden et al. (Reference Ogden, Irvine, English, Grant, Hyatt, Godbout and Holt2015) and Zimmerman et al. (Reference Zimmerman, Irvine, O'Neill, Anderson, Greene, Weinheimer, Trudel and Rawson2015).

We defined relationships among variables as positive, negative or null based upon mechanistic understanding of the Salish Sea system and input from regional experts. To implement the simulation modelling, we developed a conceptual digraph using the directed graphing software Dia (v.0.97.2) to represent the model system and the interactions between variables. This diagram served as the foundation for our qualitative modelling.
Simulated networks
We used the QPress package for qualitative network analysis (Melbourne-Thomas et al. Reference Melbourne-Thomas, Wotherspoon, Raymond and Constable2012) with custom modifications in R (R Core Team 2016) to interpret the conceptual digraph, construct simulated networks and perform our analyses. The digraph is interpreted as an interaction matrix, A, where each directed pairwise interaction is represented as coefficients aij. A is treated similarly to a community interaction matrix, wherein the rate of change of any given node is a continuous function of all other interacting nodes (Levins Reference Levins1974; Puccia & Levins Reference Puccia and Levins1985). The interacting components (i.e. model nodes) are set up as a series of differential equations:
 $$\begin{equation*}
\frac{{d{x_i}}}{{dt}} = {f_i}\left( {{x_1},{x_2}, \ldots ,{x_n};{\rm{\ }}{c_1},{\rm{\ }}{c_2},{\rm{\ }} \ldots ,{\rm{\ }}{c_m}} \right)
\end{equation*}$$
where xi is the density of the model component (population) i, the c values are growth parameters and fi is a function describing the per-capita growth rate of that population (Raymond et al. Reference Raymond, McInnes, Dambacher, Way and Bergstrom2011). Therefore, the interaction coefficients aij describe the effect of a change in the level of component j on the level of component i, as defined by the partial derivative of fi with respect to Nj: aij = ∂fi/∂xj evaluated at the equilibrium (Levins Reference Levins1974; Raymond et al. Reference Raymond, McInnes, Dambacher, Way and Bergstrom2011; Melbourne-Thomas et al. Reference Melbourne-Thomas, Wotherspoon, Raymond and Constable2012).
Given a network model and corresponding interaction matrix, A, the negative of the inverse community matrix (−A−1) yields estimated changes in the equilibrium abundances of each component x as a function of a sustained (press) perturbation of one or more system components (Puccia & Levins Reference Puccia and Levins1985). The QPress analysis package provides routines for evaluating the impact of a press perturbation to the system through simulation. For each simulation, a weight (drawn from a random uniform distribution of 0–1) was assigned to each linkage (edge). These weights were positive or negative depending upon the relationship between the two endpoints. If the resulting model with all assigned weights was stable (i.e. converged), the model was accepted. We simulated the network c. 122 000 times to result in 10 000 stable simulated networks. We then assessed the proportion of model runs with positive, negative and neutral responses given changes to particular nodes (see below).
We assessed the sensitivity and robustness of the model. We experimented with changing both the distribution and the variance of the weighting scheme, but did not find large differences in results, so maintained the default weighting for our analyses. We explored the weights of linkages in the balanced models to look for anomalies (methods and results in Appendix 2). Additionally, we calculated distance to the survival node via pathways from each model variable to check for the effects of model structure, described network properties such as connectance and linkage density and evaluated model behaviour with the sequential addition of perturbed nodes and a set of ‘cumulative effects’ of both influential and neutral nodes.
Invoking perturbations
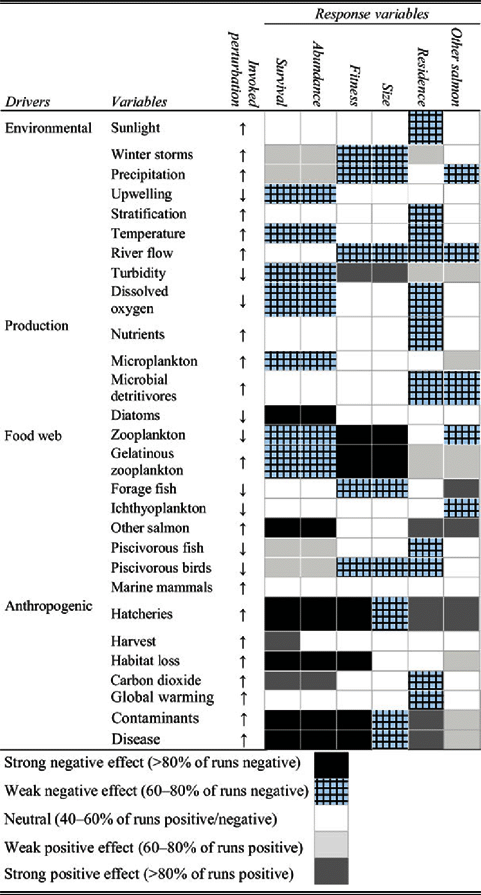
To test hypotheses regarding marine survival, we developed a priori perturbations to each model node (Table 2). The direction of the perturbation (increase or decrease) was based upon our understanding of the system, changes that have occurred concomitant with declines in salmon marine survival (since the 1970s) and expected impacts as a result of anthropogenic change (Appendix 3). We employed several cumulative effects scenarios and modified existing software functions to meet our analytical objectives.
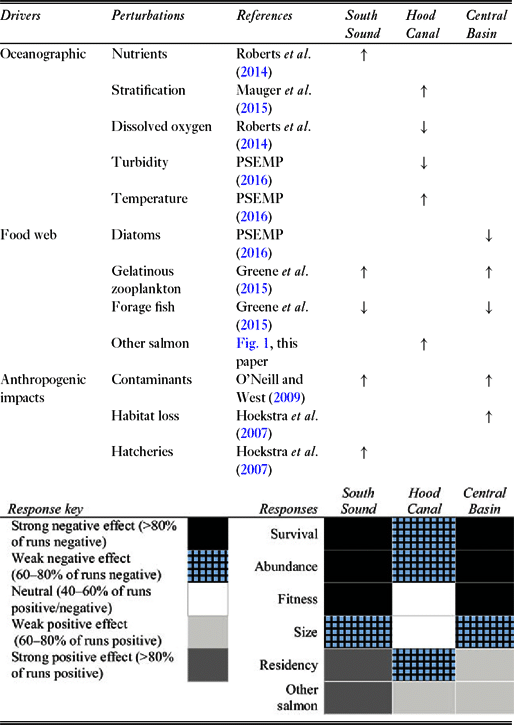
Model variables in the Salish Sea qualitative network model with the direction of the press perturbation invoked in the simulations. The response of perturbations to each individual model node on the focal salmon traits (survival, abundance, fitness, size and residence) and the other salmon model group are indicated by the patterned boxes. The key to the direction and strength of responses of the model simulations is in the lower left portion of the table.

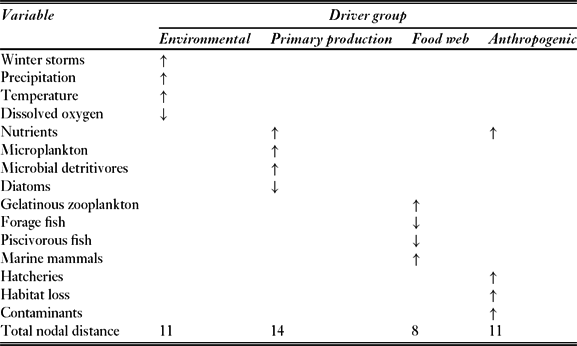
First, we perturbed each node individually and observed outcomes on all other model variables. This allowed for a simple comparison of impacts on the focal salmon metrics from each variable and the ability to compare the extent of the impact to that from any other variable. Second, we evaluated the relative effects of different groups of drivers (Table 3). For example, we were interested in food web effects, so we simultaneously decreased forage fish, increased marine mammals, decreased piscivorous fish and increased gelatinous zooplankton – trends that have been observed in Puget Sound – and observed the impacts on the other model components. For each driver group, we selected four nodes to perturb, thereby standardizing the level of change invoked. By comparing impacts on salmon traits from primary production, food web, environmental and anthropogenic drivers, we were able to query the relative impacts of each of these groups.
Perturbations and responses by driver group. Total nodal distance is the sum of the nodal distances of each node to the survival node.

Finally, we developed scenarios based upon observed changes within three regions of Puget Sound to see how well the model reproduced cumulative impacts in terms of response to the focal salmon metrics, especially survival. The three regions were: (a) South Sound, with a known decline in salmon abundance and cumulative impacts including increased gelatinous zooplankton, nutrients, contaminants and hatchery production and decreased forage fish abundance; (b) Hood Canal, which has had relatively stable salmon abundances, but impacts in terms of oceanography, including increased stratification and temperature and low dissolved oxygen; and (c) Central Basin, which has shown a decline in salmon abundance (relatively less than South Sound), but with a different suite of cumulative impacts including habitat loss, contaminant input and decreased primary production (Table 4). In reality, causes of declining survival are likely multifaceted, complex and non-linear, and this modelling exercise allowed us to examine the relative influence of many factors within one modelling framework.
Salish Sea sub-basin analysis with perturbations invoked and outcomes.

RESULTS
Model
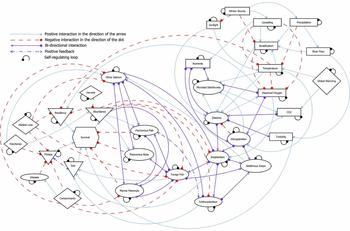
Our final conceptual model had 33 nodes including salmon traits and atmospheric, oceanographic, primary production, food web and anthropogenic drivers (Table 1, Fig. 2, Appendix 3). There were a total of 150 linkages out of 1089 potential linkages within the model. This gives a network density or connectance (realized linkages/potential linkages) of 0.138 and a linkage density (average number of linkages/node) of 4.55. Connectance has been linked with network stability in ecological networks (Dunne et al. Reference Dunne, Williams and Martinez2002b) and in social network theory applied to behavioural ecology (Sih et al. Reference Sih, Hanser and McHugh2009), as well as to resilience in social–ecological systems (Janssen et al. Reference Janssen, Bodin, Anderies, Elmqvist, Ernstson, McAllister, Olsson and Ryan2006). The most highly connected nodes were temperature, diatoms and (salmon) abundance, with a total of 11 connections each; the other salmon and zooplankton nodes were both highly connected (ten linkages) and highly influenced by other variables (ten and nine influencing nodes, respectively; Table 1). All nodes were a minimum distance of four nodes or fewer from survival, but the range of feedback linkages varied greatly, from 1 to 10. Each model node included a self-regulating feedback in order to better represent ecological limits and to aid in model convergence; the exception was survival, which was considered the primary variable of interest and was not constrained.
Conceptual model of the Salish Sea related to salmon survival. Model variables (shapes) represent food web components (ovals), physical drivers (rectangles), anthropogenic impacts (diamonds) and salmon traits of interest (triangles). Survival is shown within a hexagon and was the primary variable of interest.

To assess whether the proximity of each model node to survival influenced the outcomes of our analysis (i.e. are nodes that are more directly connected to survival more likely to result in stronger outcomes?), we evaluated the proportion of negative results for survival with the minimum nodal distance to survival and found no relationship. Both closely connected nodes (minimum nodal distance of 1) and those more distant (≥2 nodes away) resulted in a range of negative responses (<20% to >95%) with respect to survival. Thus, we do not believe that the model structure strongly confounded our results.
Perturbations
The results of the press perturbations to each node showed that anthropogenic impacts resulted in the most consistent negative responses in salmon traits, specifically survival and abundance (Table 2, Appendix 4). Here we use consistency of response to refer to the relative proportion of outcomes that were positive or negative given a perturbation – a strongly consistent response was when proportionally more simulated models (here >80%) had positive or negative responses for the node of interest, while a neutral response resulted when the simulated outcomes were equally positive/negative in outcome.
Individual perturbations showed that an increase in CO2 resulted in a consistently positive response in survival and abundance; CO2 positively influences diatoms in the model, with positive effects cascading through the food web. Conversely, a decrease in diatoms (primary production) resulted in a consistently negative response in survival and abundance, as well as negatives outcomes to zooplankton and turbidity. A direct perturbation to zooplankton (decrease) resulted in strongly consistent negative responses in fitness and size, but less consistently negative results in survival and abundance. On the other hand, a direct decrease in turbidity resulted in a consistent positive response in the individual traits of fitness and size, but slightly negative responses in survival and abundance, which are population-level traits. This is despite the fact that turbidity directly and positively affects survival in the model; this relationship is a result of the association of turbidity with primary production and the resulting predation dynamics in the model. A decrease in the predators (piscivorous fish and birds) resulted in positive responses in survival and abundance and more ambiguous impacts on size and fitness. Marine mammals, which are also known to be predators of salmon, but have experienced increasing populations (and thus act as a positive perturbation), had a neutral response on all salmon response variables. Unexpectedly, increased harvest had a positive effect on survival; harvest has a direct negative effect on abundance within the model, but the feedback to survival is mediated by the food web, specifically forage fish and zooplankton, which may moderate the harvest impacts to survival through reduced competition. This same result indicates that strong feedback mechanisms, like density dependence, were simulated by the model, highlighting the importance of complex food web interactions for salmon survival.
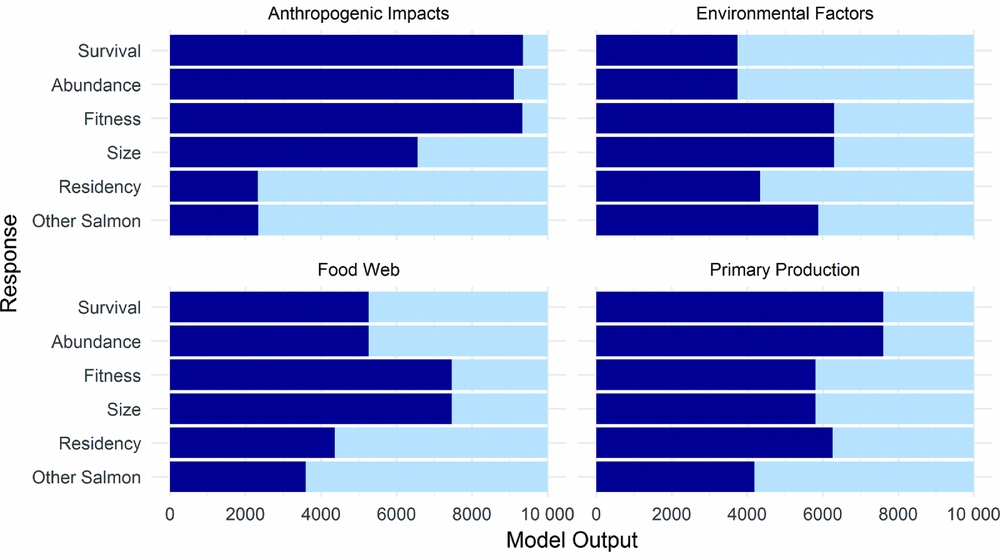
The results of the driver group analysis, which evaluated cumulative impacts from one section of the network, showed anthropogenic impacts to have predominantly negative effects on survival, abundance and fitness, with over 85% of the simulations having negative responses within these model groups (Fig. 3). For the environmental driver group, most simulation results were positive for survival and abundance, but neutral for the other response variables. The primary production group showed consistently negative results in survival and abundance, indicating that changes to primary production can have strong impacts on salmon via the food web. Interestingly, the food web manipulation yielded strong negative responses on the salmon individual traits (size and fitness), but more neutral responses on the population-level traits (abundance and survival). The other salmon category had a consistently positive response in both the food web and anthropogenic driver simulations, indicating that conditions that are less favourable within the food web for the focal salmon species may not be detrimental for other species, with diets that tend to be more planktivorous and generally shorter rearing times within the Salish Sea.
Results for the primary response variables for each of the four groups of drivers. Perturbations were according to Table 3 and, in all four figures, bars represent the number of runs resulting in negative (dark bars) or positive (light bars) responses in the response variable.

For the regional differences, where we modelled three different regions of Puget Sound with respect to salmon survival, our model replicated the observed trends within these regions, with strong negative responses in focal salmon survival, abundance and fitness in both South Sound and Central Basin. The results for Hood Canal were more weakly negative for salmon survival and abundance than in the other regions, and were neutral for fitness and size, suggesting that some of the oceanographic changes evidenced in Hood Canal may be less detrimental for salmon. Responses of other salmon were consistently positive in all three regions, reflecting observed population trends (Fig. 1). Therefore, although our model is a generalization of the processes occurring in the southern portion of the Salish Sea, it does replicate observed trends in the region.
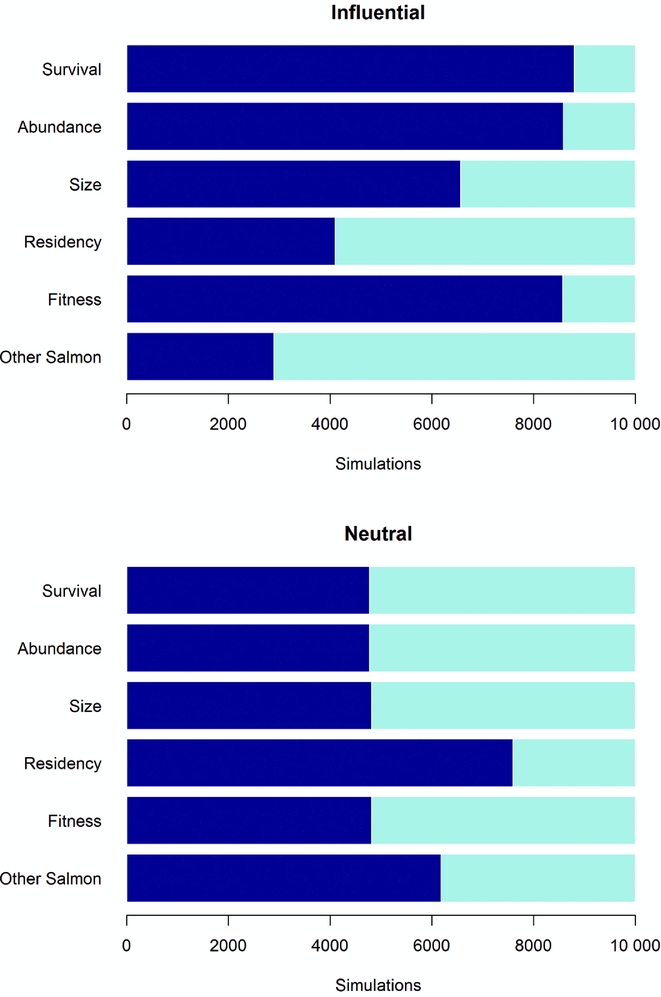
We recognize that many of the perturbations invoked within the model are happening concurrently. To evaluate whether the model would maintain robustness when multiple interacting factors (e.g. cumulative effects) were invoked, we sequentially added disturbances to the model and evaluated the outcomes. When influential individual drivers were included (from Table 2), the results were strongly negative for survival and abundance. We compared ten of the strongest-responding nodes with ten that showed neutral influence on survival and compared the results (Fig. 4). We observed that the influential individual nodes resulted in consistently negative impacts on survival, while the response was neutral for the weaker suite of disturbances.
Comparison of multiple (n = 10) strongly influential (top) and neutral (bottom) variables on salmon survival. The influential variables (resulting from the analysis presented in Table 2) were CO2, contaminants, diatoms, disease, gelatinous zooplankton, habitat loss, hatcheries, other salmon, temperature and zooplankton. The neutral variables were global warming, forage fish, ichthyoplankton, marine mammals, microbial detritivores, nutrients, precipitation, stratification, sunlight and upwelling. The variables in each set were perturbed simultaneously to simulate cumulative impacts and to assess model response. Dark bars show negative impacts on the response variable and light bars show positive responses.

DISCUSSION
Our model showed that a wide variety of drivers had negative effects on early marine survival of coho salmon, Chinook salmon and steelhead. The impacts on the other salmon variable (representing pink, chum and sockeye) were neutral or positive. With only five drivers (precipitation, river flow, microbial detritivores, zooplankton and ichthyoplankton) negatively influencing the other salmon node in our simulations, the model structure seemed to capture the reduced impacts on these species within the Salish Sea (Debertin et al. Reference Debertin, Irvine, Holt, Oka and Trudel2017; Fig. 1). The combination of drivers having negative effects on attributes of salmon fitness and survival suggests that a single sector of the network is insufficient for explaining increased marine mortality and that feedbacks and complex interactions may both exacerbate and mediate the effects of individual drivers.
Anthropogenic factors induced negative responses in salmon traits, especially survival, abundance and fitness. The factors are both direct (e.g. contaminants and disease) and mediated by the food web (e.g. hatcheries, with increased production leading to competitive interactions, and habitat loss, which has a negative effect on salmon residency and fitness, but also on forage fish, because nearshore habitat is critical to forage fish spawning). There are likely indirect connections that were unaccounted for in our model that may make these impacts even stronger in the real world. The food web components individually did not yield strong responses in salmon survival and abundance, but did impact size and fitness. Considering that many of these linkages are both directly and indirectly tied to salmon, the negative outcomes, even where marginal, should be noted. Additionally, many of the feedbacks present in the model were through the food web. In the driver group analysis, the negative impacts of food web changes on the individual traits of size and fitness are notable. Our model does not have a temporal component, but negative impacts on individual traits would likely manifest in survival and population declines over time.
The conceptual model exhibited particularly strong sensitivity to changes in key linkages: the effects of fitness upon size and vice versa, and of survival upon abundance. These results suggest that processes influencing these factors will strongly influence marine survival and point to the importance of monitoring these pathways. Size and fitness (condition) are relatively easy-to-monitor characteristics measured in standard salmon sampling programs. The measurement of size, combined with techniques that can measure growth and conditions, including the use of chemical-based indicators of fitness such as fatty acid biomarkers (Hook et al. Reference Hook, Gallagher and Batley2014) or hormone markers (Beckman Reference Beckman2011), would provide some indication of how these attributes are changing over time. However, understanding mechanisms for changes in size and conditions is more complex. As our model and the existing literature suggest, several factors contribute to changes in size over time, with food web alteration being one of the likely mechanisms. However, these changes are not yet fully understood in the Salish Sea. Our model allowed for comparison of multiple factors and showed that a decrease in primary production had the strongest negative impact on salmon survival. Additional research on the impacts of changing primary production in this system and the links to salmon condition would aid in further teasing apart this relationship.
Our response metrics focused on model runs that converged on an equilibrium (i.e. only balanced models were used in the perturbation scenarios). The number of model runs needed (c. 122 000) to get a subset of converged models (10 000) suggests that most models did not converge to a stable solution. The ‘real’ Salish Sea is likely represented by one of the many possible combinations and may in fact be unstable, not in a ‘converged’ state, as our model assumed. Such unstable states are predicted outcomes when ecosystems surpass tipping points (Carpenter & Brock Reference Carpenter and Brock2006; Samhouri et al. Reference Samhouri, Andrews, Fay, Harvey, Hazen, Hennessey, Holsman, Hunsicker, Large, Marshall, Stier, Tam and Zador2017). Alternatively, the Salish Sea ecosystem may have reached a new equilibrium: analysis of marine survival trends indicates a steep decline in the 1970s and 1980s, levelling off at a low level that has persisted to the present (Zimmerman et al. Reference Zimmerman, Irvine, O'Neill, Anderson, Greene, Weinheimer, Trudel and Rawson2015). Hence, the simulation framework with multiple sets of initial conditions may have allowed us to detect endpoints that include a new equilibrium for marine survival of salmon.
The conceptual model underlying the analysis represents a complex set of feedbacks. Additional interconnections that we did not represent would tend to stabilize the system even more (Dunne et al. Reference Dunne, Williams and Martinez2002a; Ives & Carpenter Reference Ives and Carpenter2007). And while nonlinear properties are fundamental to ecological systems, they are nearly always influenced by feedbacks, an essential component built into our model structure (DeAngelis & Waterhouse Reference DeAngelis and Waterhouse1987, Scheffer et al. Reference Scheffer, Carpenter, Foley, Folke and Walker2001). The lack of explicit spatial or temporal components within the model limits our ability to make predictions beyond a static snapshot. However, through our comparison of three sub-regions within our system, we were able to compare different starting conditions and gauge model responses. While additional complexity in the temporal component would allow for detecting evidence of change over time, the lack of comprehensive empirical data across all ecosystem components currently limits the tractability of such a modelling approach.
The model results in and of themselves are informative for comparing among a suite of potential causes of declining marine survival in salmon and in evaluating the cumulative effects of these drivers. Additionally, this conceptual model forms the foundation for additional research efforts. Currently, development of multivariable time-series analysis and an end-to-end ecosystem model (Atlantis) is ongoing via the Salish Sea Marine Survival Project. The development of the Atlantis ecosystem model has been aided by the conceptual underpinnings presented herein. Efforts have been made to develop data streams where the conceptual model has shown important linkages (e.g. a sub-project was initiated using satellite-derived data to better understand variability in primary production in the system). In this way, the qualitative network model is foundational for continuing quantitative modelling work, but is also an important tool for conveying the complexity of the system and the problem to diverse audiences.
Our results suggest that teasing out the causes of declines in marine survival will be challenging and multifaceted and will involve both understood and unknown feedbacks. Multiple singular factors led to declines in most of the simulations, and suites of ecosystem components had strong effects on marine survival and other salmon attributes. Nevertheless, our ability to distinguish causal factors will likely be improved by tracking multiple ecosystem indicators, especially those influencing salmon size and fitness. As with any model, ours is a simplified version of the ecosystem; however, our approach resulted in a complex representation of declining populations in an ecosystem context that served as a useful tool for identifying the relative influences of numerous hypothesized drivers of marine mortality. Through this examination, we have identified some sectors of the ecosystem that warrant further examination, such as the food web and anthropogenic impacts.
ACKNOWLEDGEMENTS
We thank members of the Salish Sea Marine Survival Project technical team for input into the conceptual model. B. Raymond provided assistance with modifying R code. I. Kaplan, C. Harvey, I. Perry, I. Pearsall, T. Curran and I. Kemp provided insight into early versions of the modelling effort and results. A. Dufault and N. Kendall (Washington Department of Fish and Wildlife) assisted with data compilation for Fig. 1. The manuscript benefited from comments provided by I. Kaplan, C. Harvey and R. Zabel (NOAA – Northwest Fisheries Science Center) and from the anonymous reviewers.
FINANCIAL SUPPORT
This work was paid for by the Pacific Salmon Commission's Southern Endowment Fund via Long Live the Kings. This is publication number 12 from the Salish Sea Marine Survival Project, an international research collaboration designed to determine the primary factors affecting the survival of juvenile salmon and steelhead in the Salish Sea.
CONFLICT OF INTEREST
None.
ETHICAL STANDARDS
None.
Supplementary material
To view supplementary material for this article, please visit https://doi.org/10.1017/S0376892917000509