Introduction
Schizophrenia is one of the most common disabling mental illnesses. It has been known to affect 1% of the population worldwide, and causes heavy burden on families and society (van Os & Kapur, Reference van Os and Kapur2009). Although many studies, including family and twin studies, have shown that schizophrenia has high heritability (80%), schizophrenia still cannot be explained as a monogenic disorder (McGuffin et al. Reference McGuffin, Farmer, Gottesman, Murray and Reveley1984; Sawa & Snyder, Reference Sawa and Snyder2002). The Psychiatric Genome Consortium carried out a large-scale study and uncovered many genes associated with schizophrenia (Schizophrenia Working Group of the Psychiatric Genomics Consortium, 2014). It is now generally recognized that schizophrenia is a complex illness caused by multiple genetic variants and each with small to modest effect size [O'Donovan et al. Reference O'Donovan, Craddock, Norton, Williams, Peirce, Moskvina, Nikolov, Hamshere, Carroll and Georgieva2008; Schizophrenia Psychiatric Genome-Wide Association Study (GWAS) Consortium, 2011]. However, it remains unknown as to why all the identified variants represent only a modest proportion of the overall heritability of schizophrenia. With missing heritability yet to be revealed, some studies tried to expand their sample size to increase the power of genome-wide association studies (GWAS) (Schizophrenia Working Group of the Psychiatric Genomics Consortium, 2014), which, although promising, can be extremely expensive and time-consuming. Two studies in Han Chinese population suggested that some common variants are involved in the susceptibility to schizophrenia (Shi et al. Reference Shi, Li, Xu, Wang, Li, Shen, Zhang, Chen, Zhou, Ji, Li, Xu, Liu, Wang, Yang, Liu, Sun, Wan, Qin, He, Steinberg, Cichon, Werge, Sigurdsson, Tosato, Palotie, Nothen, Rietschel, Ophoff, Collier, Rujescu, Clair, Stefansson, Stefansson, Ji, Wang, Li, Zheng, Zhang, Feng and He2011; Yue et al. Reference Yue, Wang, Sun, Tang, Liu, Zhang, Li, Zhang, Zhang, Ma, Du, Wang, Ren, Yang, Hu, Wang, Deng, Tan, Tan, Chen, Xu, Yang, Zuo, Yan, Ruan, Lu, Han, Ma, Cai, Jin, Zhang, Yan, Mi, Yin, Ma, Liu, Kang, Sun, Pan, Shuang, Yang, Wang, Yang, Li, Ma, Li, Yu, Li, Huang, Lv, Li, Zhao, Huang, Zhang and Zhang2011); however, no overlapping single nucleotide polymorphisms (SNPs) were detected from these two studies. One of the possible reasons for this may be that the heterogeneity of the descriptive symptoms such as the disease severity and more subtle characteristics may have been largely ignored due to the clinical diagnostic categories. Recently, Arnedo et al. (Reference Arnedo, Svrakic, Del Val, Romero-Zaliz, Hernández-Cuervo, Fanous, Pato, Pato, de Erausquin, Cloninger and Zwir2015) found that 17 independent gene networks are correlated with the eight subtypes of schizophrenia. This poses a challenge to the reliability of schizophrenia as a diagnostic entity. Therefore, it is important to refine the phenotype of schizophrenia rather than its general clinical symptoms in order to unravel the complex genetic structure of schizophrenia. Some GWAS were handled to detect pathogenic genes of schizophrenia using quantitative traits (QTs) such as a composite score of six neurocognitive dimensions, blood oxygen level-dependent (BOLD) signal (Potkin et al. Reference Potkin, Turner, Guffanti, Lakatos, Fallon, Nguyen, Mathalon, Ford, Lauriello and Macciardi2009b ) and gray matter volume (Stein et al. Reference Stein, Medland, Vasquez, Hibar, Senstad, Winkler, Toro, Appel, Bartecek, Bergmann, Bernard, Brown, Cannon, Chakravarty, Christoforou, Domin, Grimm, Hollinshead, Holmes, Homuth, Hottenga, Langan, Lopez, Hansell, Hwang, Kim, Laje, Lee, Liu, Loth, Lourdusamy, Mattingsdal, Mohnke, Maniega, Nho, Nugent, O'Brien, Papmeyer, Putz, Ramasamy, Rasmussen, Rijpkema, Risacher, Roddey, Rose, Ryten, Shen, Sprooten, Strengman, Teumer, Trabzuni, Turner, van Eijk, van Erp, van Tol, Wittfeld, Wolf, Woudstra, Aleman, Alhusaini, Almasy, Binder, Brohawn, Cantor, Carless, Corvin, Czisch, Curran, Davies, de Almeida, Delanty, Depondt, Duggirala, Dyer, Erk, Fagerness, Fox, Freimer, Gill, Goring, Hagler, Hoehn, Holsboer, Hoogman, Hosten, Jahanshad, Johnson, Kasperaviciute, Kent, Kochunov, Lancaster, Lawrie, Liewald, Mandl, Matarin, Mattheisen, Meisenzahl, Melle, Moses, Muhleisen, Nauck, Nothen, Olvera, Pandolfo, Pike, Puls, Reinvang, Renteria, Rietschel, Roffman, Royle, Rujescu, Savitz, Schnack, Schnell, Seiferth, Smith, Steen, Valdes Hernandez, Van den Heuvel, van der Wee, Van Haren, Veltman, Volzke, Walker, Westlye, Whelan, Agartz, Boomsma, Cavalleri, Dale, Djurovic, Drevets, Hagoort, Hall, Heinz, Jack, Foroud, Le Hellard, Macciardi, Montgomery, Poline, Porteous, Sisodiya, Starr, Sussmann, Toga, Veltman, Walter, Weiner, Bis, Ikram, Smith, Gudnason, Tzourio, Vernooij, Launer, DeCarli, Seshadri, Andreassen, Apostolova, Bastin, Blangero, Brunner, Buckner, Cichon, Coppola, de Zubicaray, Deary, Donohoe, de Geus, Espeseth, Fernandez, Glahn, Grabe, Hardy, Hulshoff Pol, Jenkinson, Kahn, McDonald, McIntosh, McMahon, McMahon, Meyer-Lindenberg, Morris, Muller-Myhsok, Nichols, Ophoff, Paus, Pausova, Penninx, Potkin, Samann, Saykin, Schumann, Smoller, Wardlaw, Weale, Martin, Franke, Wright and Thompson2012; Wang et al. Reference Wang, Xiang, Deng, Wu, Li, Ma, Wang, Jiang, McAlonan, Chua, Sham, Hu and Li2013). The limited statistical power due to the small sample size can be increased by using a QT analysis (Potkin et al. Reference Potkin, Turner, Guffanti, Lakatos, Fallon, Nguyen, Mathalon, Ford, Lauriello and Macciardi2009b ), especially QTs that can be used to test the structural and functional deficits of the brain in schizophrenia. The highly complex structure of the human brain is strongly shaped by genetic influences (Hibar et al. Reference Hibar, Stein, Renteria, Arias-Vasquez, Desrivières, Jahanshad, Toro, Wittfeld, Abramovic, Andersson, Aribisala, Armstrong, Bernard, Bohlken, Boks, Bralten, Brown, Mallar Chakravarty, Chen, Ching, Cuellar-Partida, den Braber, Giddaluru, Goldman, Grimm, Guadalupe, Hass, Woldehawariat, Holmes, Hoogman, Janowitz, Jia, Kim, Klein, Kraemer, Lee, Olde Loohuis, Luciano, Macare, Mather, Mattheisen, Milaneschi, Nho, Papmeyer, Ramasamy, Risacher, Roiz-Santiañez, Rose, Salami, Sämann, Schmaal, Schork, Shin, Strike, Teumer, van Donkelaar, van Eijk, Walters, Westlye, Whelan, Winkler, Zwiers, Alhusaini, Athanasiu, Ehrlich, Hakobjan, Hartberg, Haukvik, Heister, Hoehn, Kasperaviciute, Liewald, Lopez, Makkinje, Matarin, Naber, Reese McKay, Needham, Nugent, Pütz, Royle, Shen, Sprooten, Trabzuni, van der Marel, van Hulzen, Walton, Wolf, Almasy, Ames, Arepalli, Assareh, Bastin, Brodaty, Bulayeva, Carless, Cichon, Corvin, Curran and Czisch2015).
Schizophrenia is one of the diseases implicated in the dysconnectivity of the brain (Pettersson-Yeo et al. Reference Pettersson-Yeo, Allen, Benetti, McGuire and Mechelli2011), and numerous studies have attempted to locate the hypothesized aberrant networks. Wernicke suggested that dysconnectivity between distinct functional modules involving both sensorimotor and association areas of the brain generates symptoms of psychosis (Cutting & Shepherd, Reference Cutting and Shepherd1987). Some previous studies have suggested many altered regional connectivities in patients with schizophrenia, which contributed to the general acceptance of a vaguely defined ‘widespread dysconnectivity’ (Broyd et al. Reference Broyd, Demanuele, Debener, Helps, James and Sonuga-Barke2009; Kim et al. Reference Kim, Manoach, Mathalon, Turner, Mannell, Brown, Ford, Gollub, White and Wible2009). However, the putative ‘dysconnectivity of the brain’ remains elusive as no constant patterns that can reliably explain the complex and heterogeneous symptoms of schizophrenia have emerged. To date, seed-based analysis (SBA) and independent component analysis (ICA) are the most common methods used to study functional connectivity in the brain of patients with schizophrenia. SBA with a priori specification of brain regions is hypothesis-based analysis, only allowing for testing candidate regions by previous observations. Although the ICA approach is a data-driven approach that is well suited for novel discoveries of aberrant connectivity, it is only partially independent of prior assumptions (Joel et al. Reference Joel, Caffo, van Zijl and Pekar2011), as the components are assumed to arise from statistically independent sources and are often selected based on prior expectations of plausible signals, e.g. large-scale networks such as the default mode network. As a result, across studies, even similarly named components have a diverse anatomical distribution, which again precludes pooled synthesis of individual studies. Therefore, to provide both greater confidence and accuracy in identifying the specific regions and their functional connections that contribute most to schizophrenia, it is important to be able to use a voxel-based brain-wide analysis strategy.
Together, the present study aimed to identify the common genetic variants underlying the dysconnectivity of the brain in schizophrenia. We first investigated the most abnormal pattern of connectivity discovered from the whole-brain data-driven search. Subsequently, the dysconnectivities of the brain were integrated into the genetic data from GWAS analysis as QTs in order to identify novel susceptibility loci for schizophrenia. The present study of the imaging genetics opens the door to unravel the complex mechanisms of abnormalities of the brain in schizophrenia.
Method
Subjects
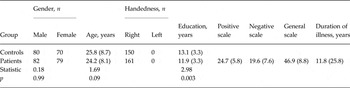
This study included 311 participants, including 161 patients with schizophrenia (82 men and 79 women) and 150 healthy control subjects (80 men and 70 women). Table 1 summarizes the demographic and clinical characteristics of the participants. More details such as data collection are presented in the Supplementary material. The study was approved by the Ethics Committee of the West China Hospital of Sichuan University. All the patients and controls provided written informed consents.
Demographic and clinical characteristics of the participants

Data are given as mean (standard deviation) unless otherwise indicated.
Imaging data acquisition and processing
Preprocessing and statistical analysis of functional images were carried out using the Statistical Parametric Mapping package (SPM8, Wellcome Department for Imaging Neuroscience, London, UK). For each individual participant's dataset, the first 10 image volumes were discarded to allow the functional magnetic resonance imaging (fMRI) signal to reach a steady state. The initial analysis included slice time correction and motion realignment. The resulting images were then spatially normalized to the Montreal Neurological Institute (MNI) echo planar imaging (EPI) template in SPM8, resampled to 3 × 3 × 3 mm3, and subsequently smoothed with an isotropic Gaussian kernel [full width at half maximum (FWHM) 8 mm]. The details of imaging data acquisition and processing are presented in the online Supplementary material.
Imaging statistical analysis
Voxel-wise and atlas-based brain-wide association study
Here, we performed whole-brain voxel-wise and atlas-based association studies as described in our previous study (Cheng et al. Reference Cheng, Palaniyappan, Li, Kendrick, Zhang, Luo, Liu, Yu, Deng, Wang, Ma, Guo, Francis, Liddle, Mayer, Schumann, Li and Feng2015). In brief, a measure for the association (MA) between voxel i and the brain disorder was defined as MA(i) = N α , where N α is the number of links between voxel i and every other voxel in the brain that has a p value of less than α [in the present study, α = 0.05/(47636 × 47635/2)] in t tests. A larger value of MA implies a more significant alteration in functional connectivity.
The MA value described above shows voxels with significantly different functional connectivities between cases and controls, but not the brain regions to which these voxels have altered connectivity. In order to investigate the abnormal connectivity pattern in the functional connectivity networks in schizophrenia, all significant voxels (after Bonferroni correction) were parcellated into four isolated regions in three clusters (see online Supplementary Table S1) using an anatomical labeling (AAL) atlas. The time series were then extracted in each cluster by averaging the BOLD signals of all significant voxels within that region. The functional connectivity was evaluated between each pair of clusters using Pearson's correlation coefficient. Then, cluster-wise functional connectivity analysis on the significant voxels within each cluster was performed to compare patient groups with their respective healthy controls. We finally obtained a 4 × 4 symmetric matrix that shows the overall pattern of the altered connectivity patterns between these voxel clusters in the schizophrenia group.
Correlations between symptom severity and abnormal functional connectivity
We investigated whether differences in functional connectivity correlated with symptom severity as assessed by the Positive and Negative Syndrome Scale (PANSS) using Pearson's correlation, using age, gender and disease duration as covariates.
Quality control and statistics for genetic data
Genotyping and quality controls
The pipeline of genotyping and quality controls was presented in a previous study (Wang et al. Reference Wang, Xiang, Deng, Wu, Li, Ma, Wang, Jiang, McAlonan, Chua, Sham, Hu and Li2013). The details are presented in the online Supplementary material.
Genotype imputation
Genotypes were phased with shapeIT to generate haplotypes (Delaneau et al. Reference Delaneau, Marchini and Zagury2012), which were used to impute missing data using IMPUTE2 (Howie et al. Reference Howie, Donnelly and Marchini2009), referenced to the 1000 Genomes Project phase I dataset. Imputed missing data underwent the same quality-control steps as stated above.
Association analysis using functional connectivities as QTs
SNP-based and gene-based analysis for single QTs
A mixed linear regression with SNP* group was used in this study,
 $y = {\beta _0} + {\beta _{{\rm cov}}} \ast {X_{{\rm cov}}} + {\beta _1} \ast {\rm group} + {\beta _2}\; SNP$
 $+ \; {\beta _3} \ast SNP \ast {\rm group} + {z_{{\rm ploygene}}} + e$
, where y stands for abnormal functional connectivities; X
cov denotes the covariates age and gender, and z
polygene is a random effect using the kinship matrix in addition to the usual fixed effects. Compared with the fixed-effects model, the random-effect model assists in controlling for latent heterogeneity when this heterogeneity is constant over time and correlated with independent variables. Moreover, linear mixed-effects models are often preferred over more traditional approaches such as analysis of variance (ANOVA) because of the advantage of these models in dealing with missing values. On the other hand, as a large number of variables were analysed and the complexity of the model was applied in the initial analyses of the interaction term model, we only focused on the SNPs and genes that reached genome-wide significance. Using this model, we performed the two degrees of freedom joint test for the SNP main effect and the SNP × group interaction. Although PLINK has been the most popular tool in GWAS, mixed linear modeling has not been implemented in this package yet. In this study, the MixABEL package (Aulchenko et al.
Reference Aulchenko, Ripke, Isaacs and van Duijn2007) was used to explore the mixed linear model with SNP × group interaction. This package has been used in some previous GWAS studies (Svishcheva et al.
Reference Svishcheva, Axenovich, Belonogova, van Duijn and Aulchenko2012; Basson et al.
Reference Basson, Sung, Schwander, Kume, Simino, de las Fuentes and Rao2014; Fabregat-Traver et al.
Reference Fabregat-Traver, Sharapov, Hayward, Rudan, Campbell, Aulchenko and Bientinesi2014; Pirastu et al.
Reference Pirastu, Kooyman, Traglia, Robino, Willems, Pistis, Amin, Sala, Karssen, van Duijn, Toniolo and Gasparini2015). In addition, the genome inflation factor λ was denoted as the ratio of the observed to the expected median χ
2 (0.465). Gene-based univariate association tests using the extended Simes procedure was performed for each QT by using the program GATES (Andersson et al.
Reference Andersson, Ek and Olsson2015). GATES is freely available in KGG v3.0 (http://statgenpro.psychiatry.hku.hk/limx/kgg/download.php).
SNP-based and gene-based analysis for multiple QTs
GWAS are generally performed one phenotype at a time, although clinical overlaps and statistical correlations between many phenotypes occur. Multivariate analysis, in which multiple phenotypes are usually reduced to a single composite score, often results in loss of statistical power. A trait-based association test has been recommended that uses an extended Simes procedure (TATES) to overcome loss of statistical power (Li et al. Reference Li, Gui, Kwan and Sham2011, van der Sluis et al. Reference van der Sluis, Posthuma and Dolan2013). TATES combines p values obtained in univariate GWAS to generate one multi-phenotype-based p value, while correlations between components are corrected. Unlike other multivariate methods (O'Reilly et al. Reference O'Reilly, Hoggart, Pomyen, Calboli, Elliott, Jarvelin and Coin2012), TATES unravels both genetic variants that are common to multiple phenotypes as well as phenotype-specific variants (van der Sluis et al. Reference van der Sluis, Posthuma and Dolan2013). Extensive simulations show that TATES can warrant correct false-positive rates and is more powerful than the univariate tests of composite scores and the standard multivariate ANOVA (van der Sluis et al. Reference van der Sluis, Posthuma and Dolan2013).
In this study, we used multivariate gene-based association by the extended Simes procedure (MGAS). This approach allows gene-based testing of multivariate phenotypes in unrelated individuals (Van der Sluis et al. Reference Van der Sluis, Dolan, Li, Song, Sham, Posthuma and Li2015). MGAS is freely available in KGG v3.0.
Results
Whole-brain voxel-based functional networks
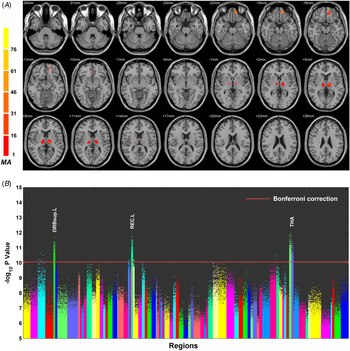
Fig. 1 illustrates the anatomical locations that show significant whole-brain connectivity aberrations in patients with schizophrenia and in the control subjects (p < 4.5 × 10⁻¹¹ after Bonferroni correction). Voxels with significantly altered functional connectivities in the schizophrenia population are shown in color, assessed by the MA given by the number of significantly affected links relating to each voxel (Fig. 1 A). The most significantly altered cluster was in the superior frontal gyrus (peak MNI coordinates −12, 48, −18; cluster size 45, MA 92), while the second most significantly altered cluster was in the thalamus (peak MNI coordinates −12, −12, 6; cluster size 69, MA 33). Based on the AAL template, the cluster with peak MNI coordinates (−12, 48, −18) can be parcellated into two brain regions, namely, the left rectus and the superior orbital cortex. Online Supplementary Table S1 summarizes the coordinates of the significant clusters. The bilateral thalamus, left rectus (REC.L), and left superior frontal gyrus, and the orbital frontal cortex (OFC) showed significantly abnormal functional connections in the patients with schizophrenia (Fig. 1 B).
Voxels with different functional connectivity in schizophrenia. (A) Location of the voxels with significantly altered functional connectivity with other voxels (using whole-brain Bonferroni correction). (B) Manhattan plot showing the probability values for each link differing between the schizophrenia and control groups. Each dot is a functional connectivity link between two voxels. There are a total of 47636 × 47636/2 links, and a dot is only plotted if p < 10–5. The red dotted line is the Bonferroni correction threshold 4.4 × 10⁻¹¹. The regions indicate the anatomical labeling (AAL) areas in which the voxels were located, with the numbers for each region specified in Table 1. THA.R, Right thalamus; THR.L, left thalamus; REC.L, left rectal gyrus; ORBsup.L, left superior orbital frontal gyrus.

Altered functional connectivity pattern
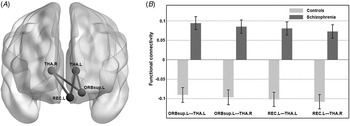
Fig. 2 provides a schematic brain-based diagram of altered functional connectivities based on the significant voxels in the above-mentioned four brain regions: the left thalamus (THA.L), right thalamus (THA.R), left superior orbital cortex (ORBsup.L) and REC.L. Four significant increased functional connectivities between these brain regions were found in the schizophrenic patients (p < 1 × 10–11).
Functional connectivity matrix calculated from the blood oxygen level-dependent (BOLD) signals in the significant voxels in each of the four clusters. (A) Schematic diagram showing differences in voxel cluster-based connectivities between the schizophrenia and control groups. (B) Bar plot of the four functional connectivities. Values are means, with standard deviations represented by vertical bars. THA.R, Right thalamus; THR.L, left thalamus; REC.L, left rectal gyrus; ORBsup.L, left superior orbital frontal gyrus.

Correlation between clinical symptoms and altered functional connectivity
We calculated Pearson's correlation between the strength of significantly increased functional connectivity and symptom severity (positive, negative, general pathopsychological symptoms, and total PANSS scores assessed using the PANSS). As shown in online Supplementary Fig. S1, there was a trend of correlation between negative symptoms and the increased functional connectivity of REC.L and THA.L (r = 0.186, p < 0.021), but the correction did not survive after multiple corrections. We did not find any correlations between any of the other functional connectivities and clinical symptoms.
Results from GWAS
In all, five patients and four controls were excluded from this study after failing the cryptic relatedness test and minimal missing genotyped rates (>5%). After SNP imputation and stringent SNP quality controls, 227 subjects with high-quality genotypes (6 055 918 SNPs with an average call rate of 99.9%) remained in this study. The principal components analysis (PCA) identified no obviously different structures between cases and controls (online Supplementary Fig. S2). The QQ plot of the linear mixed-model (LMM) showed that the genomic inflation factors for the four functional connectivities after PCA adjustment (λ) were 1.0162, 1.0173, 1.099 and 1.0201, respectively (online Supplementary Fig. S3A–D), suggesting good quality controls and absence of population stratification for our samples.
SNP-based results
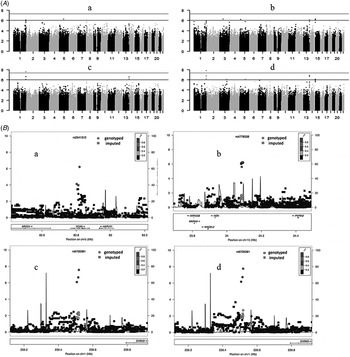
As shown in online Supplementary Table S2, we used an LMM statistic and complementary logistic regression analysis for an additive genetic model to estimate the effect sizes of individual SNPs. The LMM with genotype × group interaction was performed using the four increased functional connectivities (ORBsup.L–THA.L, ORBsup.L–THA.R, REC.L–THA.L, and REC.L–THA.R) as QTs. Fig. 3 shows the Manhattan plot of the genome-wide p values obtained for the LMM analysis (p LMM). The SNP rs6700381, which is the approximately 1.37 Mbp downstream of the CHRM3 (cholinergic receptor, muscarinic 3) gene, reached genomic significance (p = 1.76802 × 10⁻⁸ with REC.L–THA.R as the QT, and p = 2.7211 × 10⁻⁸ with REC.L–THA.L as the QT). Moreover, two imputed SNPs, namely, rs10158639 and rs1092587, which mapped to CHRM3, were implicated to be marginally associated with the increased functional connectivities of the four QTs (p values ranged from 3.279 × 10⁻⁶ to 1.880 × 10⁻⁷; details are shown in online Supplementary Table S2).
(A) Manhattan plots for genome-wide association studies (GWAS) in 161 patients with schizophrenia and 150 controls. Log10 p LMM values of single nucleotide polymorphisms (SNPs) were obtained by a linear mixed-model (LMM) analysis and plotted chromosome-wise against the physical position of each SNP using four increased functional connectivities as quantitative traits (QTs). (B) Significance of GWAS genotyped and imputed SNPs within the 400-kb region in the CHRM3 (cholinergic receptor, muscarinic 3) gene. All plots were adapted from LocusZoom output (Pruim et al. Reference Pruim, Welch, Sanna, Teslovich, Chines, Gliedt, Boehnke, Abecasis and Willer2010).

In the present study, we found the joint effect of multi-phenotype (i.e. increased functional connectivities of ORBsup.L–THA.L, ORBsup.L–THA.R, REC.L–THA.L, and REC.L–THA.R) using TATES. The p value of the SNP rs6700381 almost reached genome-wide significance (5.13 × 10⁻⁸), and the p values of the SNPs rs970014 and rs970015 on gene FAM12A (family with sequence similarity 12, member A) reached 4.14 × 10⁻⁷ (see online Supplementary Table S2).
Gene-based results
Univariate gene-based analysis revealed that the FAM12A gene was significantly associated with increased functional connectivities of REC.L–THA.L and REC.L–THA.R as QTs, respectively (nominal p value = 1.54 × 10⁻⁶, corrected p = 0.036 for REC.L–THA.L; nominal p = 7.59 × 10⁻⁷, corrected p = 0.018 for REC.L–THA.R).
In multivariate gene-based analysis for the joint effect of the aforementioned four increased functional connectivities, the FAM12A gene also showed a significant association (nominal p = 1.47 × 10⁻⁶, corrected p = 0.034).
Discussion
In this study, we identified the altered functional network involving the bilateral thalamus and OFC in first-episode treatment-naive patients with schizophrenia. Moreover, these abnormally increased functional connectivities were independent of clinical manifestations, except negative symptoms, suggesting that the increased connectivities may be one of the endophenotypes of schizophrenia. In addition, we detected a number of genes implicated in the pathogenesis of schizophrenia using these abnormal functional connectivities as QTs, among which CHRM3 was the most associated gene, reaching genomic significance in univariate analysis and almost reaching genomic significance in multivariate analysis. In the gene-based analysis, the FAM12A gene reaches a genomic significance in univariate and multivariate analysis.
The thalamus and OFC were highlighted as the most altered regions in functional brain networks in the present study. Consistent with previous studies, our findings support that the OFC plays an important role in the pathogenesis of schizophrenia (Nakamura et al. Reference Nakamura, Nestor, Levitt, Cohen, Kawashima, Shenton and McCarley2008) as well as the distributed functional dysconnectivity involving some brain region of the frontal lobe (Weinberger et al. Reference Weinberger, Egan, Bertolino, Callicott, Mattay, Lipska, Berman and Goldberg2001; Potkin et al. Reference Potkin, Turner, Brown, McCarthy, Greve, Glover, Manoach, Belger, Diaz and Wible2009a ). The OFC is a prefrontal cortex (PFC) region in the frontal lobes and is involved in sensory integration, representing the affective value of reinforcers, and in the cognitive process of decision-making (Morten, Reference Morten2005). Moreover, the thalamus plays a central and dynamic role in information transmission and processing in the brain. A series of evidence showed that the thalamus plays a vital role in the pathogenesis of schizophrenia (Andreasen et al. Reference Andreasen, O'Leary, Cizadlo, Arndt, Rezai, Ponto, Watkins and Hichwa1996; Chun et al. Reference Chun, Westmoreland, Bayazitov, Eddins, Pani, Smeyne, Yu, Blundon and Zakharenko2014). First, postmortem studies of schizophrenia patients revealed a decrease in the size of the thalamus in schizophrenia (Byne et al. Reference Byne, Buchsbaum, Mattiace, Hazlett, Kemether, Elhakem, Purohit, Haroutunian and Jones2002). Second, some neurocognitive performance, such as sensory gating, working memory and executive function, have been shown to activate abnormal fMRI performances of the thalamus in patients with schizophrenia, highlighting the role of the thalamus in this disorder (Andrews et al. Reference Andrews, Wang, Csernansky, Gado and Barch2006). Third, sleep studies have repeatedly detected a decrease in sleep spindle measures in patients with schizophrenia (Ferrarelli et al. Reference Ferrarelli, Peterson, Sarasso, Riedner, Murphy, Benca, Bria, Kalin and Tononi2010). Sleep spindles are waxing and waning 12–16 Hz oscillations initiated by the thalamic reticular nucleus and regulated by the reticulo-thalamocortical circuits (Ferrarelli et al. Reference Ferrarelli, Peterson, Sarasso, Riedner, Murphy, Benca, Bria, Kalin and Tononi2010).
Together, our study supports that the pathological activation of thalamus–OFC connectivity is a core feature in first-onset and drug-naive patients with schizophrenia. A growing body of evidence indicates significant abnormalities in thalamocortical connectivity in schizophrenia (Anticevic et al. Reference Anticevic, Cole, Repovs, Murray, Brumbaugh, Winkler, Savic, Krystal, Pearlson and Glahn2014), as part of the thalamo-cortico-striatal circuits. A distinct feature of the identified thalamic connections shows a pattern of prefrontal reduction in connectivity. This pattern was first reported by Woodward et al. (Reference Woodward, Karbasforoushan and Heckers2012) and was subsequently replicated and shown to be a common feature in bipolar disorder and schizophrenia in seed-based fMRI analyses but not data-driven analysis (Anticevic et al. Reference Anticevic, Cole, Repovs, Murray, Brumbaugh, Winkler, Savic, Krystal, Pearlson and Glahn2014). In addition, Welsh et al. (Reference Welsh, Chen and Taylor2008) found significantly reduced thalamocortical connectivity in patients with chronic schizophrenia (mean duration of illness, 20.2 years) compared with matched healthy controls. However, it must be emphasized that all patients with schizophrenia recruited in these studies were chronic cases or were taking medication at the time of the study. In a longitudinal study, Anticevic et al. (Reference Anticevic, Hu, Xiao, Hu, Li, Bi, Cole, Savic, Yang, Repovs, Murray, Wang, Huang, Lui, Krystal and Gong2015) found that the PFC connectivity in early course patients with schizophrenia was increased; however, the initial hyperconnectivity is decreased with time, which may due to therapeutic effects. Antipsychotics have been found to recover the abnormally increased thalamocortical connectivities in schizophrenia (Celada et al. Reference Celada, Llado-Pelfort, Santana, Kargieman, Troyano-Rodriguez, Riga and Artigas2013). Whether or not antipsychotic use and illness duration should be included as factors that can reduce the thalamocortical connectivity remains to be an unresolved issue. Although altered functional connectivity involving the thalamus and frontal cortex in schizophrenia has been described previously (Petersen et al. Reference Petersen, Ahmad, Shafiq, Brown-Kipphut, Fong and Anwar Iqbal2013), the present investigation described many other differences, perhaps partly because in the present study we only include first-onset and treatment-naive patients, and partly due to the analysis we performed. For example, the fixed-effects models in meta-analysis consider all datasets as homogeneous and some specific altered pattern in first-onset and drug-naive group may be covered by other datasets. In addition, the frontal region is relative large and the thalamus consists of complex thalamic nuclei that have specific brain connections; therefore, the altered patterns between the thalamic nuclei and distinct frontal regions may differ across individuals. For schizophrenia, hyperconnectivity between the thalamus and frontal cortex could lead to excessive transfer of information to the frontal cortex with the compromise of losing enough thalamic control on motor/sensory information processing (Klingner et al. Reference Klingner, Langbein, Dietzek, Smesny, Witte, Sauer and Nenadic2014).
In our study, the SNP rs6700381 in 1q43, where the CHRM3 gene is located, was detected to associate with its role in multiple brain functional connectivities. The CHRM3 gene decodes cholinergic receptor, muscarinic 3. The muscarinic cholinergic receptors belong to a larger family of G protein-coupled receptors. The M3 muscarinic receptor influences a multitude of central and peripheral nervous system processes via its interaction with acetylcholine, and may be an important modulator of behavior, learning and memory. Several lines of evidence have shown that the M3 muscarinic receptor is involved in the pathogenesis of mental illnesses. Gibbons et al. (Reference Gibbons, Scarr, McLean, Sundram and Dean2009) found that CHRM3 gene expression is decreased in the rostral PFC of patients with bipolar disorder compared with those with depression. The rostral PFC is the region of the brain implicated in the pathogenesis of mania (Blumberg et al. Reference Blumberg, Stern, Ricketts, Martinez, de Asis, White, Epstein, Isenberg, McBride, Kemperman, Emmerich, Dhawan, Eidelberg, Kocsis and Silbersweig1999). Furthermore, there is a large overlap in the genetic backgrounds in patients with schizophrenia and bipolar disorder (Cross-Disorder Group of the Psychiatric Genomics Consortium et al. Reference Lee, Ripke, Neale, Faraone, Purcell, Perlis, Mowry, Thapar, Goddard, Witte, Absher, Agartz, Akil, Amin, Andreassen, Anjorin, Anney, Anttila, Arking, Asherson, Azevedo, Backlund, Badner, Bailey, Banaschewski, Barchas, Barnes, Barrett, Bass, Battaglia, Bauer, Bayés, Bellivier, Bergen, Berrettini, Betancur, Bettecken, Biederman, Binder, Black, Blackwood, Bloss, Boehnke, Boomsma, Breen, Breuer, Bruggeman, Cormican, Buccola, Buitelaar, Bunney, Buxbaum, Byerley, Byrne, Caesar, Cahn, Cantor, Casas, Chakravarti, Chambert, Choudhury, Cichon, Cloninger, Collier, Cook, Coon, Cormand, Corvin, Coryell, Craig, Craig, Crosbie, Cuccaro, Curtis, Czamara, Datta, Dawson, Day, De Geus, Degenhardt, Djurovic, Donohoe, Doyle, Duan, Dudbridge, Duketis, Ebstein, Edenberg, Elia, Ennis, Etain, Fanous, Farmer, Ferrier, Flickinger, Fombonne, Foroud, Frank, Franke, Fraser, Freedman, Freimer, Freitag, Friedl, Frisén, Gallagher, Gejman, Georgieva, Gershon, Geschwind, Giegling, Gill, Gordon, Gordon-Smith, Green, Greenwood, Grice, Gross, Grozeva, Guan, Gurling, De Haan, Haines, Hakonarson, Hallmayer, Hamilton, Hamshere, Hansen, Hartmann, Hautzinger, Heath, Henders, Herms, Hickie, Hipolito, Hoefels, Holmans, Holsboer, Hoogendijk, Hottenga, Hultman, Hus, Ingason, Ising, Jamain, Jones, Jones, Jones, Tzeng, Kähler, Kahn, Kandaswamy, Keller, Kennedy, Kenny, Kent, Kim, Kirov, Klauck, Klei, Knowles, Kohli, Koller, Konte, Korszun, Krabbendam, Krasucki, Kuntsi, Kwan, Landén, Långström, Lathrop, Lawrence, Lawson, Leboyer, Ledbetter, Lee, Lencz, Lesch, Levinson, Lewis, Li, Lichtenstein, Lieberman, Lin, Linszen, Liu, Lohoff, Loo, Lord, Lowe, Lucae, MacIntyre, Madden, Maestrini, Magnusson, Mahon, Maier, Malhotra, Mane, Martin, Martin, Mattheisen, Matthews, Mattingsdal, McCarroll, McGhee, McGough, McGrath, McGuffin, McInnis, McIntosh, McKinney, McLean, McMahon, McMahon, McQuillin, Medeiros, Medland, Meier, Melle, Meng, Meyer, Middeldorp, Middleton, Milanova, Miranda, Monaco, Montgomery, Moran, Moreno-De-Luca, Morken, Morris, Morrow, Moskvina, Muglia, Mühleisen, Muir, Müller-Myhsok, Murtha, Myers, Myin-Germeys, Neale, Nelson, Nievergelt, Nikolov, Nimgaonkar, Nolen, Nöthen, Nurnberger, Nwulia, Nyholt, O'Dushlaine, Oades, Olincy, Oliveira, Olsen, Ophoff, Osby, Owen, Palotie, Parr, Paterson, Pato, Pato, Penninx, Pergadia, Pericak-Vance, Pickard, Pimm, Piven, Posthuma, Potash, Poustka, Propping, Puri, Quested, Quinn, Ramos-Quiroga, Rasmussen, Raychaudhuri, Rehnström, Reif, Ribasés, Rice, Rietschel, Roeder, Roeyers, Rossin, Rothenberger, Rouleau, Ruderfer, Rujescu, Sanders, Sanders, Santangelo, Sergeant, Schachar, Schalling, Schatzberg, Scheftner, Schellenberg, Scherer, Schork, Schulze, Schumacher, Schwarz, Scolnick, Scott, Shi, Shilling, Shyn, Silverman, Slager, Smalley, Smit, Smith, Sonuga-Barke, St Clair, State, Steffens, Steinhausen, Strauss, Strohmaier, Stroup, Sutcliffe, Szatmari, Szelinger, Thirumalai, Thompson, Todorov, Tozzi, Treutlein, Uhr, van den Oord, Van Grootheest, Van Os, Vicente, Vieland, Vincent, Visscher, Walsh, Wassink, Watson, Weissman, Werge, Wienker, Wijsman, Willemsen, Williams, Willsey, Witt, Xu, Young, Yu, Zammit, Zandi, Zhang, Zitman, Zöllner, Devlin, Kelsoe, Sklar, Daly, O'Donovan, Craddock, Sullivan, Smoller, Kendler and Wray2013). Therefore, it would not be surprising if the same gene is implicated in the pathogenesis of both these conditions. Also, Poulin et al. (Reference Poulin, Butcher, McWilliams, Bourgognon, Pawlak, Kong, Bottrill, Mistry, Wess, Rosethorne, Charlton and Tobin2010) found that CHRM3-knockout mice showed a deficit in fear conditioning learning and memory, the mechanisms of which include reduction in receptor phosphorylation. It is possible that the M3 muscarinic receptor-dependent learning and memory depend on receptor phosphorylation/arrestin signaling. Additionally, CHRM3 has been suggested to be a candidate gene responsible for patients with 1q43 or 1q43–q44 deletions (Petersen et al. Reference Petersen, Ahmad, Shafiq, Brown-Kipphut, Fong and Anwar Iqbal2013). Moreover, deletions of 1q43 usually result in complex clinical phenotypes which include intellectual disability, autism (Petersen et al. Reference Petersen, Ahmad, Shafiq, Brown-Kipphut, Fong and Anwar Iqbal2013), seizures (EPICURE Consortium et al. Reference Steffens, Leu, Ruppert, Zara, Striano, Robbiano, Capovilla, Tinuper, Gambardella, Bianchi, La Neve, Crichiutti, de Kovel, Kasteleijn-Nolst Trenite, de Haan, Lindhout, Gaus, Schmitz, Janz, Weber, Becker, Lerche, Steinhoff, Kleefuss-Lie, Kunz, Surges, Elger, Muhle, von Spiczak, Ostertag, Helbig, Stephani, Moller, Hjalgrim, Dibbens, Bellows, Oliver, Mullen, Scheffer, Berkovic, Everett, Gardiner, Marini, Guerrini, Lehesjoki, Siren, Guipponi, Malafosse, Thomas, Nabbout, Baulac, Leguern, Guerrero, Serratosa, Reif, Rosenow, Morzinger, Feucht, Zimprich, Kapser, Schankin, Suls, Smets, De Jonghe, Jordanova, Caglayan, Yapici, Yalcin, Baykan, Bebek, Ozbek, Gieger, Wichmann, Balschun, Ellinghaus, Franke, Meesters, Becker, Wienker, Hempelmann, Schulz, Ruschendorf, Leber, Pauck, Trucks, Toliat, Nurnberg, Avanzini, Koeleman and Sander2012), microcephaly/craniofacial dysmorphology, corpus callosal agenesis/hypogenesis, and so on. To the best of our knowledge, our study is the first to implicate the role of CHRM3 in schizophrenia.
The FAM12A gene has been previously implicated in male infertility (Damyanova et al. Reference Damyanova, Dimitrova-Dikanarova, Hadjidekova, Savov, Nesheva, Rukova, Vatev and Toncheva2013). To date, this gene has not been reported to be involved in the pathogenesis of any psychiatric diseases.
Several strengths and limitations of this study must be taken into account when interpreting the findings of this study. In our study, we performed the analysis only in first-onset and treatment-naive patients with schizophrenia, which is superior to the sample populations of previous studies. We concurrently used functional connectivity assessments of both the genotype and phenotype to identify their associations, thereby combining genome and phenome information. Moreover, our study is data-driven rather than hypothesis-driven analysis and SBA. One limitation of this study is its sample size, which is not very large for genetic analysis. Thus, some variants could be missed due to limited statistical power. Fortunately, the endophenotype strategy may increase the power of the analysis for GWAS in the present study. The imputed genotyping data used in this study might also improve the statistical power of the analysis.
Taken together, specific alterations in resting-state thalamocortical functional connectivity are a core feature of schizophrenia. Alterations in this schizophrenia-associated network could be a reliable mechanistic index to discriminate patients from healthy controls. Furthermore, we discovered several common genetic variants underlying the abnormal increases in the functional connectivities in patients with schizophrenia. In particular, CHRM3 could play a vital role in the deficits of thalamus–cortical connectivities. The application of neuroimaging genetics can provide insight into the causes of variability in human brain development and potentially help determine the mechanisms of schizophrenia dysfunction by unraveling susceptibility variants related to the disorder. However, our findings, of course, require a careful reconsideration of the concept of ‘replicability’ due to the heterogeneity and complexity of schizophrenia. In order to be meaningful in complex disorders like schizophrenia, efforts to replicate the findings of this study must take into account the distributed heritability and developmental complexity of the disease.
Supplementary material
For supplementary material accompanying this paper visit http://dx.doi.org/10.1017/S0033291716000167
Acknowledgements
This work was partly funded by the National Nature Science Foundation of China Key Project 81130024 (to T.L.); National Key Technology R & D Program of the Ministry of Science and Technology of China during the 12th Five-Year Plan 2012BAI01B06 (to T.L.); National Natural Science Foundation of China/Research Grants Council of Hong Kong Joint Research Scheme8141101084&N HKU736/14 (to T.L. and P.C.S.); the ‘135’ Project of Building Top Disciplines in China of West China Hospital, Sichuan University; National Nature Science Foundation of China Grant 81271479 (to Q.W.); the outstanding young researcher grant of Sichuan University (to Q.W.) and the Hong Kong Health and Medical Research Fund 02132236 (to X.M.)
Declaration of Interest
None.