INTRODUCTION
Widespread concern exists over the health of marine ecosystems given the diversity and impact of human activities affecting these systems worldwide (Halpern et al. Reference Halpern, Walbridge, Selkoe, Kappel, Micheli, D'Agrosa, Bruno, Casey, Ebert, Fox, Fujita, Heinemann, Lenihan, Madin, Myers, Perry, Selig, Spalding, Steneck and Watson2008), with overfishing consistently identified as a key threat to all parts of the world's oceans (Pauly et al. Reference Pauly, Christensen, Dalsgaard, Froese and Torres1998). Overexploitation has resulted in dire predictions about the ability of oceans to continue supporting fisheries (Worm et al. Reference Worm, Barbier, Beaumont, Duffy, Folke, Halpern, Jackson, Lotze, Micheli, Palumbi, Sala, Selkoe, Stachowicz and Watson2006), in turn leading to calls for fishery management reform (Costello et al. Reference Costello, Gaines and Lynham2008) and increased protection to maintain some locations in a more ‘pristine’ ecosystem state (Lubchenco et al. Reference Lubchenco, Palumbi, Gaines and Andelman2003). No-take marine reserves, which prohibit all exploitative activities, have become widely recognized as an effective conservation tool for protecting marine resources, resulting in increases in the abundance, biomass and diversity of many species within their boundaries (Halpern Reference Halpern2003; Micheli et al. Reference Micheli, Halpern, Botsford and Warner2004; Lester et al. Reference Lester, Halpern, Grorud-Colvert, Lubchenco, Ruttenberg, Gaines, Airame and Warner2009). However, the ability for reserves to provide conservation or fisheries benefits to adjacent waters remains highly controversial (Roberts et al. Reference Roberts, Bohnsack, Gell, Hawkins and Goodridge2001; Tupper Reference Tupper2002; Gell & Roberts Reference Gell and Roberts2003; Hilborn et al. Reference Hilborn, Stokes, Maguire, Smith, Botsford, Mangel, Orensanz, Parma, Rice, Bell, Cochrane, Garcia, Hall, Kirkwood, Sainsbury, Stefansson and Walters2004).
Growing evidence from theoretical models and empirical studies suggests that higher abundances inside reserves can lead to spillover of adults to nearby fished areas (Rowley Reference Rowley1994; Roberts et al. Reference Roberts, Bohnsack, Gell, Hawkins and Goodridge2001; Goni et al. Reference Goni, Adlerstein, Alvarez-Berastegui, Forcada, Renones, Criquet, Polti, Cadiou, Valle, Lenfant, Bonhomme, Perez-Ruzafa, Sanchez-Lizaso, Garcia-Charton, Bernard, Stelzenmuller and Planes2008; Kellner et al. Reference Kellner, Nisbet and Gaines2008; Perez-Ruzafa et al. Reference Perez-Ruzafa, Martin, Marcos, Zamarro, Stobart, Harmelin-Vivien, Polti, Planes, Garcia-Charton and Gonzalez-Wanguemert2008). Spillover is typically observed as declining patterns of abundance or catch across reserve boundaries, although there may be no detectable pattern of decline in abundance if fishing effort is intense surrounding the reserve. Additional evidence comes from ecosystem-level models evaluating the effect of large closures on fish stocks and landings (for example see Guenette et al. Reference Guenette, Pitcher and Walters2000; Pitcher et al. Reference Pitcher, Buchary and Hutton2002; Zeller & Reinert Reference Zeller and Reinert2004), measures of changing fisheries yield or profit adjacent to reserves (McClanahan & Mangi Reference McClanahan and Mangi2001; Alcala et al. Reference Alcala, Russ, Maypa and Calumpong2005; Abesamis et al. Reference Abesamis, Alcala and Russ2006a) and from studies of small-scale adult movement patterns across reserve boundaries (Samoilys Reference Samoilys1997; Zeller et al. Reference Zeller, Stoute and Russ2003; Topping et al. Reference Topping, Lowe and Caselle2005). However, these studies cannot address the extent to which small-scale reserves may benefit local fishers (in the case of the ecosystem-level models) or determine if reserves can benefit local fish stocks and fishery catches (in the case of the adult movement studies). A recent study used a spatially-explicit population growth and harvest model to simulate potential spillover rates and distances, a key step towards addressing the nature of spillover (Perez-Ruzafa et al. Reference Perez-Ruzafa, Martin, Marcos, Zamarro, Stobart, Harmelin-Vivien, Polti, Planes, Garcia-Charton and Gonzalez-Wanguemert2008). The critical next step is to tie such models to empirical data on spillover and assess whether reserves are generally expected to compensate local fisheries for lost yields due to fishing displacement from reserves. Answering this question could prove crucial in resolving debates about reserve establishment (Hilborn et al. Reference Hilborn, Stokes, Maguire, Smith, Botsford, Mangel, Orensanz, Parma, Rice, Bell, Cochrane, Garcia, Hall, Kirkwood, Sainsbury, Stefansson and Walters2004; Roberts et al. Reference Roberts, Hawkins and Gell2005). If this compensation does occur, even if only partially, then no-take reserves can play a key role in fisheries management, as well as conservation.
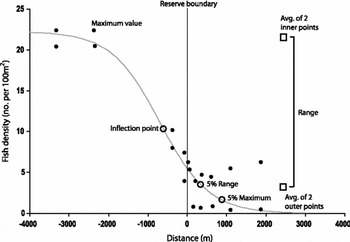
Here we synthesize empirical evidence of adult spillover to address four fundamental questions about the nature and extent of spillover from marine reserves. (1) How common is spillover for those species that respond positively to reserve protection? (2) How far from reserves can spillover be detected? (3) Do traits of species (i.e. mobility) or reserves (i.e. size or age) influence spillover occurrence and detectable distance? (4) Does spillover compensate fishers for catch lost to closed fishing grounds and, if so, to what extent? We employ a two-pronged approach to address these questions. First, we use statistical models and a variety of metrics to assess the nature and extent of spillover (Fig. 1). Second, we use these results to fit a reaction-diffusion model that estimates spillover rate at each reserve and determines whether fishery catch would be locally sustainable without the reserve in place. While spatially-explicit reaction-diffusion models have a long history in conservation applications (Shigesada & Kawasaki Reference Shigesada and Kawasaki1997; Cantrell & Cosner Reference Cantrell and Cosner2003), this is an innovative use of this type of model, particularly in combination with statistical analyses of empirical data. Combining these two approaches provides a novel assessment of whether reserves compensate, or even enhance, local catch via spillover.
Metrics for estimating spillover distance (see Methods) applied to a sample dataset (Guidetti Reference Guidetti2007) for which the logistic curve was the best fit (see Appendix 1, supplementary material at URL http://www.ncl.ac.uk/icef/EC_Supplement.htm).

METHODS
Synthesis
We synthesized all studies published in the literature prior to March 2009 containing spatially-explicit empirical data of spillover from no-take marine reserves identified from searches of Web of Science using the keywords ‘marine reserve’, ‘spillover’ or ‘marine protected area’. We found independent measures of overall spillover from 16 reserve-level surveys and 35 taxonomic groups (species, genus or family level) from those reserves (Appendices 1–3, see supplementary material at URL http://www.ncl.ac.uk/icef/EC_Supplement.htm). We did not include adult movement data because these studies examine individuals rather than abundances and our focus was on population-level outcomes of individual movements. We also did not include data from areas with partial protection to avoid confounding results with protection status. We obtained data from figures, tables or the authors on abundance, biomass or catch at increasing distances in each direction from the reserve centre to areas outside the reserve (if more than one direction was surveyed, i.e. ‘transects’) and for each taxonomic group separately. Measurements at four or more distances within and around a reserve from each study were required for model fitting. Relevant papers that we excluded because they did not meet our criteria are addressed in the Discussion. To assess reserve-level spillover, we used data reported at the reserve level when provided and otherwise combined data from individual taxonomic groups and transects at a reserve. We recorded reserve size and age from each study, and species mobility (whether sedentary, mobile or highly mobile) from FishBase (see URL http://www.fishbase.org).
In four cases, the original research reported two different metrics for spillover (Appendix 1, see supplementary material at URL http://www.ncl.ac.uk/icef/EC_Supplement.htm, ‘measured responses’ column, for example density and catch). We used the following decision rules to select the most appropriate measure to include in our synthesis (Appendix 1, see supplementary material at URL http://www.ncl.ac.uk/icef/EC_Supplement.htm, measure used). For Apo Reserve (Abesamis et al. Reference Abesamis, Russ and Alcala2006b), we used density for reserve level analyses because it was the only measure available, but used biomass for taxonomic analyses because biomass is the more relevant metric when evaluating fisheries compensation. Spillover distance estimates at the taxonomic level were nearly identical for density versus biomass for this study, so this decision had no effect on our results. For Mombasa Reserve (McClanahan & Mangi Reference McClanahan and Mangi2000), we used catch rather than mean fish size data, because mean size masks abundance and/or biomass patterns while catch is a direct measure of fisheries benefit. For Barbados Reserve (Rakitin & Kramer Reference Rakitin and Kramer1996), we used catch rather than density data as density gradients do not always reflect true spillover patterns (as discussed below), but we report both measures in Appendix 1 (see supplementary material at URL http://www.ncl.ac.uk/icef/EC_Supplement.htm) to help illustrate this point. Finally, for Columbretes Reserve (Goni et al. Reference Goni, Quetglas and Renones2006), we used catch per unit effort (CPUE) rather than catch per unit area (CPUA) data because the former were measured both inside and outside the reserve while the latter were only measured outside the reserve, and thus model fits were more accurate (and conservative) with CPUE data.
Statistical models of potential spillover
The expectation that spillover from marine reserves will produce abundance gradients with distance from the reserve, with a shape that depends on species mobility and catch rates, was first described over a decade ago (Rakitin & Kramer Reference Rakitin and Kramer1996) and later refined and modelled (Kaunda-Arara & Rose Reference Kaunda-Arara and Rose2004; Goni et al. Reference Goni, Quetglas and Renones2006). We expanded on these previous model-fitting approaches and estimated spillover by fitting three model forms (exponential decay, Eq. 1; linear decay, Eq. 2; and logistic decay, Eq. 3) to each dataset, all of which imply the same mechanism and essentially capture different parts of a logistic curve, in order to find the best fit to the empirical data.


where Y is adult abundance (or catch) and x is the distance from the reserve boundary (negative values are inside the reserve). For Eqs (1) and (2), α estimates the rate of decline in spillover, while in Eq. (3) α is the magnitude of the reserve effect (i.e. how much a variable, such as density, changes due to protection provided by a no-take reserve), β is where the midpoint of the diminishing reserve effect is centred (this ‘inflection point’ is inside the reserve if β > 1, outside the reserve if β < 1, and centred on the reserve boundary if β = 1) and δ is how steeply the reserve effect declines (larger values of δ represent steeper declines). In Eq. (3), the combination of β and δ determine how far spillover spreads beyond the reserve boundary, with the expectation that both parameters are affected by species’ mobility and the intensity and spatial pattern of fishing outside the reserve. The use of multiple models allowed us to find the best fit to the empirical data while not requiring that the sampling assumptions for the logistic fit hold true. In cases where the logistic decay fit was computationally possible but produced negative values for β (which produces a curve that is no longer logistic), spillover distances were calculated using the next best fit model.
Model fits were conducted using the nls function in R (R 2006), which seeds the fitting procedure with chosen parameter values and then searches for those that produce the best fit. In every case but one transect, both linear and exponential functions were fit, while for eight reserve-level and nearly half of the taxonomic-level datasets, logistic functions could not be fit. This is expected because spatially-explicit monitoring data are often not sufficient to capture the full spatial pattern, especially when there are limited sampling sites within the reserve. In these last cases, seed values across many orders of magnitude were tested, but the data were either too sparse or too variable to allow for logistic model fitting. We used an Akaike information criterion (AIC) model selection procedure to compare model fits.
Past studies have primarily calculated the inflection point of logistic fits to estimate spillover distance (Kaunda-Arara & Rose Reference Kaunda-Arara and Rose2004; Abesamis et al. Reference Abesamis, Russ and Alcala2006b), but this method captures the midpoint, not the detectable extent, of spillover. Therefore, we developed several new methods that better capture detectable spillover distance (Fig. 1). For all three model forms, we calculated the distance at which the curve is 5% of the maximum observed value and 5% of the observed range. The range is defined as the average of the two points furthest outside the reserve to the average of the two points furthest inside the reserve. These two metrics provide a conservative (5% range) and more liberal (5% maximum) estimate of how far outside the reserve spillover can be detected. For logistic fits, we also calculated where the inflection point occurs for comparison with previous methods (Appendix 2, see supplementary material at URL http://www.ncl.ac.uk/icef/EC_Supplement.htm). Spillover distances can be negative (i.e. inside reserve boundaries), in which case fishing impacts reach further into the reserve than target species spill out. We also tested whether spillover distance was affected by reserve size, number of years of protection at time of survey and species mobility (sedentary versus mobile) using a multivariate linear model (R 2006).
Population models (reaction-diffusion models)
Of the 35 taxonomic datasets we evaluated, 17 included a logistic decay statistical model as a best fit (Appendix 2, see supplementary material at URL http://www.ncl.ac.uk/icef/EC_Supplement.htm). These data come from eight of the 13 reserves evaluated in our analyses. For these datasets, we calculated the best-fit reaction-diffusion model to the logistical model to assess whether the local fisheries would be viable without the reserve and, if so, to what extent lost catches due to reserve creation were compensated for by potential increases in catch outside the reserve.
For the population modelling framework, we used a Fisher reaction-diffusion model (Fisher Reference Fisher1937), which includes logistic growth, combined with a linear catch-effort production function. Kellner et al. (Reference Kellner, Tetreault, Gaines and Nisbet2007, Reference Kellner, Nisbet and Gaines2008) and Perez-Rusafa et al. (Reference Perez-Ruzafa, Martin, Marcos, Zamarro, Stobart, Harmelin-Vivien, Polti, Planes, Garcia-Charton and Gonzalez-Wanguemert2008) have previously shown that this form of a reaction-diffusion model produces the sigmoid shaped spillover curves exhibited across many marine reserve boundaries. Accordingly, population density, n, is described at each point in space as follows:

where the rate of movement ( ), fishing (
 ) and time are scaled to the population growth rate (r) to reduce the number of parameters needed for the least-squares fit, and k is the maximum density. The scaled fishing rate was set to zero inside the reserve (
 ). We also assumed no losses at the region edges (i.e. reflecting boundaries
 ). Otherwise all parameters were considered homogeneous across space, including the fishing rate outside the reserve (we address the implications of this assumption in the Discussion).
Like the statistical model analysis, the parameters were estimated using least squares to find the best-fit reaction-diffusion model at equilibrium that approximates the logistic curve derived in the statistical analysis above. This method for parameter estimation provides the most consistency across the empirical studies examined here given the paucity of movement and demographic data available for most marine species. The reaction-diffusion model produced reasonable model fits for 14 of the 17 taxonomic datasets analysed. We report the results when the reaction-diffusion model fit the logistic model with an R2 > 0.5 (n = 12) or when the fit to the raw data was very high (R2 > 0.75) despite a logistic model not emerging as a best fit for the statistical model (n = 2). In the two cases in which taxonomic groups were measured in two different transects, the reaction-diffusion model was fit to each transect and catch compensation estimated separately. The results were similar for both transects and are reported here as single averaged estimates of compensation.
We then integrated the relative fishing effort () and catch ( ) estimates across the fished area to calculate total effort (
 ) and total catch (
 ) with the reserve in place. In order to determine population viability without a reserve, our estimates were then included in a model that removed the reserve and spread fishing effort across the entire area (i.e. remained constant but was spread over a larger area):

where L is the total area with the reserve now removed, such that  . L is based on the width of the reserve boundary to the centre of the reserve plus the total distance measured outside the reserve in each study (Appendix 1, see supplementary material at URL http://www.ncl.ac.uk/icef/EC_Supplement.htm). In this no reserve case, total catch,
 , is calculated by integrating
 across the entire region.
When a reserve is in place, spillover can often sustain fishing even if > 1 outside the reserve (i.e. fishing outside the reserve is greater than the population growth rate, see terms for reserve and regional population persistence in Kellner et al. Reference Kellner, Tetreault, Gaines and Nisbet2007). However, the population can no longer be self-sustainable without a reserve if the fishing rate per area,  , is greater 1. We used the relative estimates from the reaction-diffusion model fitting to determine whether the population could be self-sustainable without a reserve (i.e.
 ) and whether the reserve was likely to provide fisheries compensation (
 ). Finally, for those cases where the local fishery is not self-sustainable without a reserve in place, we calculated the percent decrease in fishing mortality necessary to make the fishery sustainable (Table 1). All analyses were conducted in MATLAB (v6.5) and FEMLAB (v3.0).
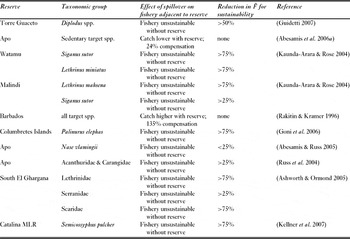
Reaction-diffusion model fits evaluating the extent to which spillover from reserves compensates fishers for lost fishing grounds and the reduction in fishing effort required to make the fishery sustainable in the absence of the reserve.

RESULTS
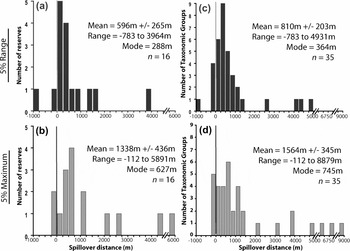
Abundance of target species was higher inside no-take reserves versus areas outside for all studies included in our synthesis, and thus statistical model fits for spillover all had negative slopes. We found significant spillover from reserves based on data at the reserve level pooled across taxonomy (Fig. 2a; t-test: df = 15, t = 2.25, p = 0.04) and data divided by taxonomy (Fig. 2b; t-test: df = 34, t = 3.75, p = 0.0007), with nearly every reserve showing positive spillover, even from very small reserves (e.g. Balicasag Reserve, 0.08 km2). Using the most conservative estimate (5% range), spillover is detectable on average up to 600 m (reserve level) and 800 m (taxonomic level) from the reserve boundary, and may be detectable as far as 1500 m from the boundary on average based on a less conservative estimate (5% maximum; Fig. 2 and Appendix 2, see supplementary material at URL http://www.ncl.ac.uk/icef/EC_Supplement.htm). These distance estimates are robust to the type of statistical model used (in studies for which multiple fits were selected by AIC methods; Appendix 2, see supplementary material at URL http://www.ncl.ac.uk/icef/EC_Supplement.htm) and are very similar to those found in model simulations (Perez-Ruzafa et al. Reference Perez-Ruzafa, Martin, Marcos, Zamarro, Stobart, Harmelin-Vivien, Polti, Planes, Garcia-Charton and Gonzalez-Wanguemert2008). Spillover distance was not affected by reserve size, years of protection or species mobility (Appendix 3, see supplementary material at URL http://www.ncl.ac.uk/icef/EC_Supplement.htm).
Histogram of spillover distances for (a, b) data pooled across species and (c, d) separated by species groups for (a, c; black histogram bars) the 5% range spillover metric and (b, d; grey histogram bars) 5% maximum spillover metric. Distances were derived by selecting the best model fit for the empirical data. The thin vertical line indicates the location of the reserve boundary, with negative numbers indicating negative spillover distances.

Reaction-diffusion model results showed that in 86% (12 of 14) of the cases spillover from reserves replenished local fish catch (i.e. fishing effort was high enough that without a reserve in place the local fishery would likely be unsustainable; i.e.  ; Table 1). In the remaining two cases where the local fishery would be viable without the reserve (), estimated spillover rates show that the reserve can fully compensate displaced fishers for lost local yield for one case () and partially compensate them in the other case (
 ).
DISCUSSION
Even limited spillover creates the opportunity for fishers to catch those fish, suggesting that no-take marine reserves will generally provide at least some compensation to fishers displaced by reserves. Our estimates of spillover distance are consistent with studies of large-scale partial-protection marine protected areas that find even greater spillover distances (Murawski et al. Reference Murawski, Wigley, Fogarty, Rago and Mountain2005), with studies of adult movement patterns showing similar or greater distances of movement across reserve boundaries (for example (Samoilys Reference Samoilys1997; Kelly & MacDiarmid Reference Kelly and MacDiarmid2003; Topping et al. Reference Topping, Lowe and Caselle2005), and with estimates from spillover studies that did not meet our inclusion criteria (Abesamis & Russ Reference Abesamis and Russ2005; Goni et al. Reference Goni, Adlerstein, Alvarez-Berastegui, Forcada, Renones, Criquet, Polti, Cadiou, Valle, Lenfant, Bonhomme, Perez-Ruzafa, Sanchez-Lizaso, Garcia-Charton, Bernard, Stelzenmuller and Planes2008; Harmelin-Vivien et al. Reference Harmelin-Vivien, Le Direach, Bayle-Sempere, Charbonnel, Garcia-Charton, Ody, Perez-Ruzafa, Renones, Sanchez-Jerez and Valle2008; Williams et al. Reference Williams, Walsh, Claisse, Tissot and Stamoulis2009). However, in all of these cases, spillover acts at relatively small scales such that single reserves cannot sustain entire fished stocks (through spillover alone; they may be able to provide this service through larval export).
We may underestimate spillover distances because most empirical studies measured gradients in fish abundance rather than catch, and therefore measure detectable rather than actual spillover. In heavily fished areas, or areas where fishers concentrate their effort at reserve boundaries and ‘fish-the-line’, abundance patterns may show an immediate decline (Kellner et al. Reference Kellner, Tetreault, Gaines and Nisbet2007) which could be misinterpreted as lack of spillover, while catch data would strongly indicate otherwise. Indeed, the one study that measured both catch and abundance (Rakitin & Kramer Reference Rakitin and Kramer1996) produced much higher spillover distances using catch data (Appendix 2, see supplementary material at URL http://www.ncl.ac.uk/icef/EC_Supplement.htm), suggesting that detectable spillover distance may be strongly tied to the distribution and magnitude of fishing effort outside reserves. Future analyses would benefit from including both abundance and CPUE measurements in field monitoring near reserve boundaries.
Spillover is predicted to increase with reserve effect, since larger increases in abundance within reserves should lead to greater spillover. Reserve effects may (Claudet et al. Reference Claudet, Osenberg, Benedetti-Cecchi, Domenici, Garcia-Charton, Perez-Ruzafa, Badalamenti, Bayle-Sempere, Brito, Bulleri, Culioli, Dimech, Falcon, Guala, Milazzo, Sanchez-Meca, Somerfield, Stobart, Vandeperre, Valle and Planes2008) or may not (Halpern Reference Halpern2003) increase with increasing reserve size; regardless, the reserves in our dataset were relatively small (6.9 km2 ± 1.7 SE), limiting our ability to detect a reserve size effect on spillover distance. Reserve effect is also expected to increase with greater years of protection (Russ et al. Reference Russ, Alcala, Maypa, Calumpong and White2004); because reserves in this study had all been protected for a relatively long time (16.1 yrs ± 1.8 SE) there was probably insufficient variation in age to detect a potential effect. Spillover distances did not differ by species mobility, contrary to theoretical predictions (Kellner et al. Reference Kellner, Tetreault, Gaines and Nisbet2007) and empirical evidence from movement studies (Zeller et al. Reference Zeller, Stoute and Russ2003; Abesamis et al. Reference Abesamis, Russ and Alcala2006b). However, our analysis lacked power because most of the species that were studied were in the same mobility category (mobile). Low sample size for highly-mobile species precluded their inclusion in analysis, but these species are not generally the focus of marine reserve goals (Le Quesne & Codling Reference Le Quesne and Codling2009) because they may be less likely to benefit from protection except in very large reserves.
The reaction-diffusion model results provide compelling evidence that reserves can play a key role in the replenishment of the fisheries beyond their borders, at the scale of the size of the reserve, in particular when fishing pressure is high outside the reserve (or before the reserve is put in place). Indeed, without reserves, fishing effort would need to be reduced by >50% in most cases to make the local fisheries sustainable (Table 1). The degree to which larger networks of no-take reserves could compensate fisheries at the scale of entire stocks remains an open question, although theoretical work suggests such compensation is possible (Hastings & Botsford Reference Hastings and Botsford1999; Neubert Reference Neubert2003; Kaplan & Botsford Reference Kaplan and Botsford2005).
However, the ability of reserves to replenish fish catches does not necessarily translate into economic compensation. Fishers may have to travel greater distances (at greater cost) or fish less often owing to displacement from their original fishing grounds. Spillover may also take time to accrue, exacting short-term costs on fishers (Smith & Wilen Reference Smith and Wilen2003). However, studies that have focused on catch metrics (effort and value) support our finding that spillover can compensate fishers (Roberts et al. Reference Roberts, Bohnsack, Gell, Hawkins and Goodridge2001; Murawski et al. Reference Murawski, Wigley, Fogarty, Rago and Mountain2005). Furthermore, our assumption that fishing effort remains constant when redistributed over the entire sampled area when the reserve is hypothetically removed may not be realistic, and influences our estimates of the sustainability of the fishery without the reserve. A reserve may also attract fishers to its borders to take advantage of spillover, and if some of those fishers come from outside the sampled area our results may under-predict catch.
Non-targeted and/or less mobile species are generally not expected to show a spillover pattern in abundance and are therefore less likely to be the focus of spillover studies. As such, we recognize that a study bias may exist in the marine reserve literature towards species that are targeted and have moderate mobility as adults (although several studies synthesized here included non-target and/or immobile species, which, as expected, showed no spillover). Given that the focus of debate about spillover and fisheries compensation is directed at targeted species, we suggest our results are robust because: (1) our quantitative methods can detect negative spillover distances, (2) we find highly consistent occurrence of spillover (14 of 16 reserves; 30 of 35 taxonomic groups) and (3) we focus on species that are targets of fisheries. Finally, spillover estimates may be spurious if underlying habitat heterogeneity instead drives abundance patterns. However, there is no evidence that reserves are sited in better habitat (Halpern et al. Reference Halpern, Gaines and Warner2004; Lester et al. Reference Lester, Halpern, Grorud-Colvert, Lubchenco, Ruttenberg, Gaines, Airame and Warner2009), although there is evidence that spillover is facilitated by habitat continuity across reserve boundaries (Forcada et al. Reference Forcada, Valle, Bonhomme, Criquet, Cadiou, Lenfant and Sanchez-Lizaso2009). Furthermore, habitat protection provided by a reserve could actually decrease the potential for spillover if habitat quality drives abundance patterns and therefore fish preferentially remain inside the reserve (Rodwell et al. Reference Rodwell, Barbier, Roberts and McClanahan2003; Forcada et al. Reference Forcada, Bayle-Sempere, Valle and Sanchez-Jerez2008).
These results suggest how methodology may be improved for future research to ensure that questions about spillover distance and fisheries compensation can be better answered. Sampling needs to be sufficient to allow the detection of small-scale changes in fish and fishing effort inside and outside the reserve (for example every 100–250 m), and ideally include more than 10 measurements across space to allow for better model fitting. Furthermore, when possible, CPUE data should be measured, with catch data followed by abundance data as the next best options. If CPUE data cannot be collected, some estimate of the spatial pattern and intensity of fishing effort outside the reserve is useful, as are data on habitat distribution and quality. Distance between sampling locations should be significantly smaller than the average home-range size of the species being surveyed, and data should be collected at the centre of the reserve and at a large distance outside the reserve to provide estimates of unfished abundance and fished abundance outside the influence of spillover, respectively. Finally, data on baseline conditions before reserve establishment are helpful (Francini-Filho & Moura Reference Francini-Filho and Moura2008), but obtaining such data is challenging and should not limit future reserve studies.
Our results also provide guidelines for incorporating marine reserves into local-scale fisheries management. Networks of small- to medium-sized reserves that are large enough to protect mobile species within their boundaries, as have been recently established in California and the Great Barrier Reef, are probably preferable to larger fewer reserves, as adult spillover is a relatively small-scale phenomenon. This confirms previous theoretical predictions on the design of reserve networks for fisheries management (Neubert Reference Neubert2003) and recommendations reached from model simulations of spillover effects (Perez-Ruzafa et al. Reference Perez-Ruzafa, Martin, Marcos, Zamarro, Stobart, Harmelin-Vivien, Polti, Planes, Garcia-Charton and Gonzalez-Wanguemert2008). Additionally, because reserves are likely to compensate local fishers for lost catch (although perhaps not lost profit), especially in intensely fished systems, those fishers who are displaced by a reserve will be the same ones who directly benefit from spillover. Whether or not they are fully compensated economically, and how quickly such compensation could happen, remains an open research question, but our results suggest marine reserves can locally replenish fish stocks outside their boundaries. Therefore, no-take marine reserves need not create conflict between fishery and conservation goals, and, in fact, may often offer a solution benefiting all parties.
ACKNOWLEDGEMENTS
We thank R. Goni for sharing data, and S. Gaines, M. Baskett, A. Hastings, D. Kramer and an anonymous reviewer for helpful comments on the paper. Support was provided by a grant from the David and Lucille Packard Foundation to NCEAS for ecosystem-based management of marine systems, the Partnership for Interdisciplinary Studies of Coastal Oceans (PISCO) funded by the David and Lucile Packard Foundation and the Gordon and Betty Moore Foundation (contribution number 348), the Sustainable Fisheries Group supported by the Paul G. Allen Family Foundation and the Bahamas Biocomplexity Project (US NSF Biocomplexity grant OCE-0119976) and US EPA Science to Achieve Results (R832223).