Implications
Studies of nutrient intake of grazing herbivores have always been limited by difficulties in estimating the diet composition of animals. n-alkanes (alkanes), as faecal markers, have been widely investigated for estimation of diet composition. Recently, long-chain alcohols (alcohols) and long-chain fatty acids (acids) have received the most attention and have showed a great potential, combining with alkanes, to estimate the composition of complex diets.
This research represents the first study of the potential of alcohols and acids as faecal markers for animal nutrition studies in a typical steppe in Inner Mongolia, which is an important part of the world's grassland ecosystem and the most important grazing land in China.
Introduction
A variety of techniques have been developed for estimating diet composition of herbivores (Dove and Mayes, Reference Dove and Mayes1991). However, in recent years, plant wax marker techniques have received the most attention (Dove and Mayes, Reference Dove and Mayes1996; Mayes and Dove, Reference Mayes and Dove2000), developing from one marker type (n-alkanes; Mayes et al., Reference Mayes, Beresford, Lamb, Barnett, Howard, Jones, Eriksson, Hove, Pedersen and Staines1994; Salt et al., Reference Salt, Mayes, Colgrove and Lamb1994) to two marker types (n-alkanes and long-chain alcohols; Bugalho et al., Reference Bugalho, Dove, Kelman, Wood and Mayes2004; Dove and Charmley, Reference Dove and Charmley2008) or three marker types (n-alkanes, long-chain alcohols and fatty acids; Ali et al., Reference Ali, Mayes, Lamb, Hector, Verma and Ørskov2004 and Reference Ali, Mayes, Hector, Verma and Ørskov2005; Lin et al., Reference Lin, Luo, Zhang, Wang, Shu and Hong2009b).
Before n-alkanes (alkanes), long-chain alcohols (alcohols) and long-chain fatty acids (acids) can be used routinely for diet composition estimation, and thorough indoor validation studies are required, particularly in relation with the estimation of faecal recoveries and the evaluation of the accuracy of diet composition estimates (Bugalho et al., Reference Bugalho, Dove, Kelman, Wood and Mayes2004; Ali et al., Reference Ali, Mayes, Hector, Verma and Ørskov2005; Lin et al., Reference Lin, Luo, Zhang, Wang, Shu and Hong2009b). To date, these studies have been conducted by feeding known mixtures of two to five components to livestock, based on alkanes alone (Charmley and Dove, Reference Charmley and Dove2007; Lin et al., Reference Lin, Luo, Zhang and Shu2007; Ferreira et al., Reference Ferreira, Celaya, Garcia, Rodrigues and Osoro2009b), and different combinations of alkanes and alcohols (Dove and Charmley, Reference Dove and Charmley2008) or alkanes and acids (Ferreira et al., Reference Ferreira, Carvalho, Falco, Celaya, Garcia, Santos, Rodrigues and Osoro2009a). Moreover, the studies for evaluating the potential use of alkanes, alcohols and acids as diet composition markers were based on even more simple diets with three components (Ali et al., Reference Ali, Mayes, Hector, Verma and Ørskov2005; Lin et al., Reference Lin, Luo, Zhang, Wang, Shu and Hong2009b). However, in most situations, free-ranging animals consume more complex diets, indicating that there is a need to rigorously test the method using more complex dietary mixtures.
The objectives of this study were to assess the accuracy of using alcohols and acids, combined with alkanes, as markers for estimating diet composition, and to investigate the effect of diet composition on faecal recovery of alkanes, alcohols and acids.
Material and methods
The study was conducted at the Guyuan State Key Monitoring and Research Station of Grassland Ecosystem (China). All the animal experiments received approval from the China Agricultural University Laboratory Animal Care Advisory Committee.
Animals and diets
Eighteen Inner Mongolia fine-wool × Mongolia wethers (6 to 8 months of age, 30 kg initial live weight) were housed indoors and tethered individually with neck chains in a 21-day experiment. Sheep were assigned randomly to three diets (six animals per diet): diet A (four components: 35.5% Leymus chinensis, 4.7% Elymus sibiricum, 12.1% Chenopodium album and 51.6% Puccinellia chinampoensis); diet B (six components: 32.1% L. chinensis, 20.2% Leymus dasystachys, 18.8% E. sibiricum, 3.9% C. album, 11.2% P. chinampoensis and 13.9% Medicago sativa); and diet C (eight components: 32.6% L. chinensis, 20.5% L. dasystachys, 19.1% E. sibiricum, 3.9% C. album, 11.3% P. chinampoensis, 9.4% M. sativa, 1.0% Saussurea sinuate and 2.2% Bromus inermis). The diets were prepared according to the advice of the local farmers and reflect the typical diet composition consumed by grazing sheep in the study site. The sheep were each offered 1 kg/day (air-dry) of the diet.
Fresh herbage species were harvested on a daily basis and were separately chopped into approximately 20 mm lengths and then mixed thoroughly according to the required diet composition. Animals were fed equal portions of their daily ration at 0830, 1230 and 1630 h and had free access to water and mineral blocks. The amount fed to each sheep was adjusted from days 1 to 7 of the adaptation period, to ensure less than 5% refusal (Brosh et al., Reference Brosh, Henkin, Rothman, Aharoni, Orlov and Arieli2003). As the material was chopped into approximately 20 mm lengths, it was assumed that the sheep were unable to select, either leaves or stem (Hameleers and Mayes, Reference Hameleers and Mayes1998). Refusals were, therefore, not evaluated for their botanical composition.
Sampling procedures and sample preparation
The experiment consisted of a 15-day adaptation period and a 6-day sampling period. Sheep were fitted with faecal collection bags 7 days before the sampling period and wore them throughout the collection period (Elwert et al., Reference Elwert, Dove and Rodehutscord2008). Faecal collection bags were emptied on a daily basis at approximately 0800 h during the 6-day sampling period. The total weight of faeces was recorded, and a representative sample (20% of the total) was taken. Herbage samples were collected on a daily basis 2 days before the corresponding faecal sample. Refusals were recorded on a daily basis at 1900 h to calculate the actual dry matter intake.
Herbage and faeces samples were immediately dried at 65°C for 48 h in a forced-air oven. Further, subsamples were pooled per herbage species and animal, respectively, and then ground through a 1 mm screen for alkanes, alcohols and acids analysis.
Extraction and analysis of alkanes, alcohols and acids
Alkanes, alcohols and acids were extracted and analysed according to the methods of Duncan et al. (Reference Duncan, Mayes, Lamb, Young and Castillo1999), Bugalho et al. (Reference Bugalho, Dove, Kelman, Wood and Mayes2004), respectively, with the exception that C27OH and C21-acid were used as internal standards for alcohols and acids, respectively (Lin et al., Reference Lin, Luo, Wang, Zhang and Shu2009a).
Gas chromatography (GC) was conducted using GC-2010 gas chromatography (Shimadzu Corporation, Kyoto, Japan) fitted with a flame ionisation detector. Samples of extracts were injected into a TC-1 high-resolution capillary column (0.25 mm inner diameter and 30 m long, 0.25 μm film thickness; GL Sciences Inc., Tokyo, Japan) with split auto-injection (split ratio 35 : 1). Carrier gas was helium at 1.0 ml/min. For alkanes, injector and detector temperatures were maintained at 350°C, the temperature programmed for the column oven was started at 200°C for 0.5 min, 6°C/min to 300°C, where it was held for 10 min. For alcohols and acids, injector and detector temperatures were maintained at 320°C and 330°C, respectively. For alcohols, the column oven was temperature programmed to 120°C for 0.5 min, 15°C/min to 250°C and 3°C/min to 300°C, where it was held for 5 min. For acids, the column oven was temperature programmed to 120°C for 0.5 min, 15°C/min to 250°C, 5°C/min to 290°C, where it was held for 12 min.
Standard solutions containing a mixture of synthetic odd-chain alkanes (C23 to C33), even-chain alcohols (C20OH to C32OH) or even-chain acid-methyl esters (C20-acid to C32-acid) were prepared with five different concentrations. The varied concentrations of standard solutions were used for the calibration by linear regression. The response factors for individual alkane, alcohol and acid were calculated from peak areas and the known concentrations.
Calculations
Faecal recovery of each alkane, alcohol and acid was calculated as the proportion of ingested compound, which was recovered in faeces. Diet proportions were estimated using a non-negative least-square procedure in the software EatWhat (Dove and Moore, Reference Dove and Moore1995). In this study, only the six odd alkanes (C23, C25, C27, C29, C31 and C33) that were found in relatively greater concentrations were used, whereas all available alcohols and acids were used for diet proportion estimates, except C20OH, which occurred at low concentrations. Although diet A and diet B were estimated using alkanes alone, alcohols alone, acids alone or their combinations (alkanes and alcohols; alkanes and acids; alcohols and acids; and alkanes and alcohols and acids), diet C was estimated only on the basis of a combination of two or three marker types, because only one marker type did not offer enough markers for estimating this diet treatment. The number of markers has to at least equal the number of diet components using the non-negative least-square procedure (Dove and Mayes, Reference Dove and Mayes2005). The faecal concentration of individual alkanes, alcohols and acids was corrected using one of the two methods: (i) using the mean recovery of the dietary treatment that the respective animal belonged to (diet recovery) and (ii) using the mean recovery across all dietary treatments (general recovery).
The accuracy of diet composition estimates as a whole was assessed using the Kulczynski similarity index (KSI), which calculates the overlap between observed and estimated diet composition using different markers and different sets of faecal recovery correction, as follows (Kerbs, Reference Kerbs1989; Ferreira et al., Reference Ferreira, Carvalho, Falco, Celaya, Garcia, Santos, Rodrigues and Osoro2009a):
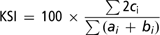
where ci is the lesser percentage of i component in the observed and estimated diet composition, and (ai + bi) is the sum of percentages of each herbage component in the observed and estimated diet composition.
Statistical analysis
All statistical analysis was performed using the SPSS11.5 for Windows. ANOVA was conducted to evaluate the diet composition effect on faecal recovery rates of individual alkanes, alcohols and acids. We carried out the t-test for paired comparisons between observed and estimated diet composition values. For a diet consisting of ‘n’ species, the t-test was conducted for ‘n − 1’ species, because the proportion of the last species is a function of the sum of the other species. Therefore, the minor diet component in each diet treatment (E. sibiricum in diet A, C. album in diet B and S. sinuate in diet C) was excluded from the t-test. Furthermore, the effect of diet composition (diet), faecal recovery correction (recovery), marker and their interactions diet × recovery, diet × marker, recovery × marker and diet × recovery × marker on the KSI values were examined by ANOVA.
Results
Marker profiles of the plant species
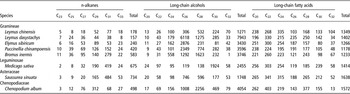
The profiles of alkanes, alcohols and acids in the eight herbage species used in the experiment are shown in Table 1. Considerable amounts of odd-chain alkanes, even-chain alcohols and acids were detected in the herbage species. Concentrations of even-chain alcohols and acids were generally greater than those of alkanes. The predominant alkanes were C27, C29 and C31, and predominant alcohols were C26OH and C28OH, except M. sativa in which the greatest concentration of alcohols was C30OH. Generally, the differences between the concentrations of individual even-chain acids were smaller than those of alkanes and alcohols. However, the concentration of C32-acid was markedly lower than that of the other acids. The total alcohol concentration of L. dasystachys was the greatest of the eight species analysed, whereas this species contained the lowest total alkane concentration.
Concentration (mg/kg DM) of individual n-alkanes, long-chain alcohols and fatty acids within each forage species

DM = dry matter.
Faecal recoveries of alkanes, alcohols and acids
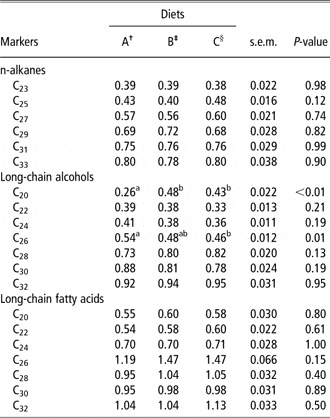
In all diets, alkane, alcohol and acid faecal recoveries showed a similar tendency as they increased with the carbon chain length (Table 2). Average faecal recoveries ranged from 0.39 (C23) to 0.79 (C33) for alkanes, 0.37 (C22OH) to 0.94 (C32OH) for alcohols and 0.57 (C20-acid) to 1.07 (C32-acid) for acids. In all diets, the recovery of C26-acid (1.38 ± 0.07) was greater than might have been expected from interpolation between C24-acid and C28-acid.
Effect of diets on faecal recovery (g/g) of n-alkanes, long-chain alcohols and fatty acids in different diets (n = 6)

a,bMeans within a row with different superscripts differ (P < 0.05).
†Diet A = Leymus chinensis (35.5%), Elymus sibiricum (4.7%), Chenopodium album (12.1%) and Puccinellia chinampoensis (51.6%).
‡Diet B = L. chinensis (32.1%), Leymus dasystachys (20.2%), E. sibiricum (18.8%), C. album (3.9%), P. chinampoensis (11.2%) and Medicago sativa (13.9%).
§Diet C = L. chinensis (32.6%), L. dasystachys (20.5%), E. sibiricum (19.1%), C. album (3.9%), P. chinampoensis (11.3%), M. sativa (9.4%), Saussurea sinuate (1.0%) and Bromus inermis (2.2%).
Further analysis indicated that, in the three marker types, only the recoveries of C20OH and C26OH were affected (P < 0.01) by diet composition. Faecal recovery of C20OH and C26OH in diet A was greater (P < 0.01) than that in diet B and diet C (Table 2).
Determining diet composition
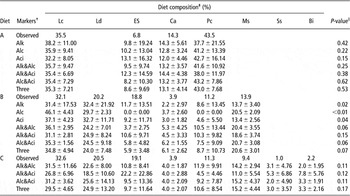
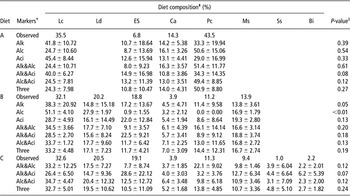
Statistical analysis shows that, for diets A and C, diet composition estimated based on different markers and faecal recoveries did not differ from the observed values (P > 0.05; Table 3). For diet B, the estimates obtained by different markers corrected by general recovery were not different from the observed diet compositions (P > 0.05), except for the estimation by alkanes (P = 0.05) or alcohols (P < 0.05; Table 4). On the basis of diet recovery, however, the diet composition estimated by different markers or marker combinations were significantly different (P < 0.05), or showed the tendency (P < 0.1) to be different from the observed values, except for the estimates obtained by the combination of alkanes and acids.
Observed and estimated proportions of the herbage species (mean ± s.d., n = 6) in diet A, diet B and diet C using different markers and faecal recovery correction based upon diet recovery (the mean recovery of the dietary treatment that the respective animal belonged to)

†Markers: Alk = n-alkanes; Alc = long-chain alcohols; Aci = long-chain fatty acids; Alk&Alc = the combination of n-alkanes and long-chain alcohols; Alk&Aci = the combination of n-alkanes and long-chain fatty acids; Alc&Aci = the combination of long-chain alcohols and long-chain fatty acids; Three = the combination of n-alkanes, long-chain alcohols and fatty acids.
‡Diet composition: Lc = Leymus chinensis; Ld = Leymus dasystachys; Es = Elymus sibiricum; Ca = Chenopodium album; Pc = Puccinellia chinampoensis; Ms = Medicago sativa; Ss = Saussurea sinuate; Bi = Bromus inermis.
§Probability of paired sample t-test between observed and estimated diet composition.
Observed and estimated proportions of the herbage species (mean ± s.d., n = 6) in diet A, diet B and diet C using different markers and faecal recovery correction based upon general recovery (the mean recovery across all dietary treatments)

†Markers: Alk = n-alkanes; Alc = long-chain alcohols; Aci = long-chain fatty acids; Alk&Alc = the combination of n-alkanes and long-chain alcohols; Alk&Aci = the combination of n-alkanes and long-chain fatty acids; Alc&Aci = the combination of long-chain alcohols and long-chain fatty acids; Three = the combination of n-alkanes, long-chain alcohols and fatty acids.
‡Diet composition: Lc = Leymus chinensis; Ld = Leymus dasystachys; Es = Elymus sibiricum; Ca = Chenopodium album; Pc = Puccinellia chinampoensis; Ms = Medicago sativa; Ss = Saussurea sinuate; Bi = Bromus inermis.
§Probability of paired sample t-test between observed and estimated diet composition.
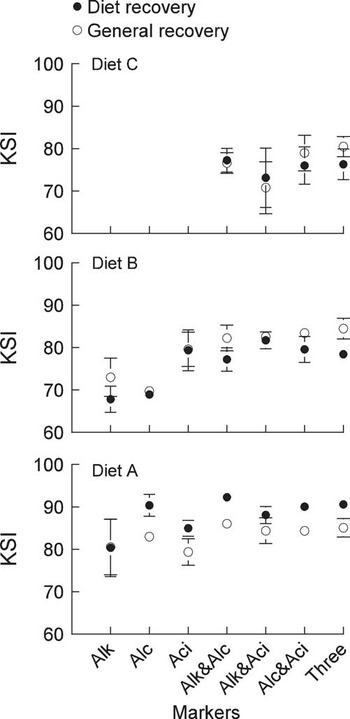
The accuracy of diet composition estimates as a whole was further assessed using the KSI value. The results of ANOVA indicated that markers and diet affected KSI (P < 0.05). In general, as the diet components increased in number from diet A (four plant species) to diet B (six plant species) and diet C (eight plant species; Figure 1), the KSI decreased significantly from 85.7 in diet A to 77.7 and 76.2 in diet B and diet C, respectively (P < 0.05). When different marker types were used, improvement in the accuracy of the estimates of diet was only obtained by using the combination of alkanes and alcohols (KSI = 81.9), alcohols and acids (KSI = 82.0) or alkanes, alcohols and acids (KSI = 82.5), instead of alkanes alone (KSI = 75.4; P < 0.05). In general, the recovery treatment (general recovery v. diet recovery) did not affect the accuracy of estimates of diet composition (P > 0.05). No significant interaction was found between markers and diet (P > 0.05). The same is the case for the interaction among diet, marker and recovery (P > 0.05).
Kulczynski similarity index (mean ± s.e.) between observed and estimated diet compositions of diet A, diet B and diet C using n-alkanes (Alk), long-chain alcohols (Alc), long-chain fatty acids (Aci) and their combinations. Estimates based on the mean recovery of the dietary treatment that the respective animal belonged to (diet recovery), and the mean recovery across all dietary treatments (general recovery). Diet A = Leymus chinensis (35.5%), Elymus sibiricum (4.7%), Chenopodium album (12.1%) and Puccinellia chinampoensis (51.6%); diet B = L. chinensis (32.1%), Leymus dasystachys (20.2%), E. sibiricum (18.8%), C. album (3.9%), P. chinampoensis (11.2%) and Medicago sativa (13.9%); diet C = L. chinensis (32.6%), L. dasystachys (20.5%), E. sibiricum (19.1%), C. album (3.9%), P. chinampoensis (11.3%), M. sativa (9.4%), Saussurea sinuate (1.0%) and Bromus inermis (2.2%).

An interaction (P < 0.05) between diet and recovery effects occurred for the overall KSI values of the three diets based on diet recovery and general recovery. In diet A, the use of diet recovery resulted in an improvement (P < 0.01) of diet composition estimation. The composition of diet A was estimated with excellent precision by all markers (85.0 < KSI < 92.3), except when using alkanes alone (KSI = 80.3). Comparatively, estimates based on general recovery lead to a greater bias between estimated and observed diet composition (79.4 < KSI < 86.0).
In diet B, both diet recovery and general recovery methods gave reasonable estimates of diet composition (67.8 < KSI < 84.4). However, alkanes or alcohols alone produced relatively lower (P < 0.05) quality diet composition estimates (67.8 < KSI < 73.0) than those from other markers. In diet C, sufficiently accurate estimates of diet composition were achieved by all markers based on diet recovery or general recovery (70.8 < KSI < 80.5). Although the KSI values numerically decreased when alkanes were used in combination with acids (KSI = 71.9), no significant difference of KSI occurred among the four sets of markers used for diet composition estimators of diet C.
Discussion
Alkanes, alcohols and acids concentrations of the herbage species
Previous studies reported that alkanes with odd-numbered carbon chains, as well as alcohols and acids with even-numbered carbon chains, were predominant in plant species and could be used for the estimation of diet composition and intake of ruminants (Mayes et al., Reference Mayes, Lamb and Colgrove1986; Ali et al., Reference Ali, Mayes, Hector, Verma and Ørskov2005; Dove and Mayes, Reference Dove and Mayes2005). Therefore, this study only showed the odd-chain alkanes and even-chain alcohols and acids. A wide variation in the concentration of individual marker of L. chinensis, L. dasystachys and E. sibiricum occurred in this study compared with another report (Lin et al., Reference Lin, Luo, Zhang, Wang, Shu and Hong2009b), which could be attributed to variations in climate (Lin et al., Reference Lin, Liu and Zhang2006) and stage of growth (Dove and Mayes, Reference Dove and Mayes1996; Zhang et al., Reference Zhang, Togamura and Otsuki2004), as well as leaf-to-stem proportions (Smith et al., Reference Smith, Mayes and Raats2001).
Dove and Charmley (Reference Dove and Charmley2008) reported that, in general, the predominant alcohols of monocotyledons were C26OH and C28OH, whereas dicotyledons, such as subterranean clover, contained high concentrations of C30OH (Bugalho et al., Reference Bugalho, Dove, Kelman, Wood and Mayes2004). Data from this study also showed that the predominant alcohol in M. sativa was C30OH, and in Poaceae (Gramineae) species were C26OH and C28OH. However, results indicated that the predominant alcohols in Asteraceae and Chenopodiaceae, which are dicotyledons, were C26OH and C28OH.
L. chinensis and L. dasystachys exhibited very similar alkane patterns (Lin et al., Reference Lin, Liu and Zhang2006); however, the alcohol patterns of these two species were clearly discriminated. This was also the same case with M. sativa and S. sinuata. Previous studies also found that species with similar patterns of one marker type could have different patterns of another (Ali et al., Reference Ali, Mayes, Hector, Verma and Ørskov2005; Lin et al., Reference Lin, Luo, Wang, Zhang and Shu2009a). These results confirmed the usefulness of alcohols as markers for diet composition estimation.
Faecal recoveries of alkanes, alcohols and acids
In general, faecal recoveries of alkanes, alcohols and acids in this study were comparable with those summarised by Dove and Mayes (Reference Dove and Mayes2005), and support previous reports that faecal marker recoveries increase with increasing chain length in ruminants (Ali et al., Reference Ali, Mayes, Lamb, Hector, Verma and Ørskov2004; Dove and Charmley, Reference Dove and Charmley2008; Lin et al., Reference Lin, Luo, Zhang, Wang, Shu and Hong2009b). However, it should be noted that alcohols with relatively shorter carbon chain length (C20OH to C26OH) in this experiment, as well as in our previous study (Lin et al., Reference Lin, Luo, Zhang, Wang, Shu and Hong2009b), showed lower faecal recoveries than those published by Ali et al. (Reference Ali, Mayes, Lamb, Hector, Verma and Ørskov2004) and Dove and Charmley (Reference Dove and Charmley2008). This variation could be caused by diet factors such as herbage species (Lin et al., Reference Lin, Luo, Zhang and Shu2007 and Reference Lin, Luo, Zhang, Wang, Shu and Hong2009b), and animal factors such as species, breed, age and physiological states (Dove and Mayes, Reference Dove and Mayes1991; Elwert et al., Reference Elwert, Kluth and Rodehutscord2004). Differences in faecal alkane recovery between experiments have been compared by Dove et al. (Reference Dove, Mayes, Freer, Coombe and Foot1989) and Dove and Mayes (Reference Dove and Mayes1991). For example, the faecal recovery of C25 and C27 alkanes in sheep were, respectively, as low as 0.20 and 0.45 in Mayes and Lamb (Reference Mayes and Lamb1984), and as high as 0.49 and 0.61 in Mayes et al. (Reference Mayes, Lamb and Colgrove1988). Thus, these results indicated that a single recovery value for any marker cannot be assumed (Dove et al., Reference Dove, Mayes, Freer, Coombe and Foot1989).
However, there is no universal result of the effect of diet composition on the faecal marker recoveries (Ferreira et al., Reference Ferreira, Carvalho, Falco, Celaya, Garcia, Santos, Rodrigues and Osoro2009a). Some studies have indicated that diet composition did not affect faecal recoveries of alkanes (Mayes et al., Reference Mayes, Lamb and Colgrove1986; Elwert et al., Reference Elwert, Kluth and Rodehutscord2004; Dove and Charmley, Reference Dove and Charmley2008), alcohols and acids (Ali et al., Reference Ali, Mayes, Lamb, Hector, Verma and Ørskov2004). By contrast, others found significant effects of diet composition on faecal recoveries of alkanes (Ferreira et al., Reference Ferreira, Oliván, Rodrigues, Garcia and Osoro2005 and Reference Ferreira, Garcia, Rodrigues, Celaya, Dias-da-Silva and Osoro2007; Elwert et al., Reference Elwert, Dove and Rodehutscord2008) and acids (Ferreira et al., Reference Ferreira, Carvalho, Falco, Celaya, Garcia, Santos, Rodrigues and Osoro2009a). In this study, faecal recovery values for alkanes, alcohols and acids were not affected by diet composition, except C20OH and C26OH.
To better understand the influence of diet composition on faecal recoveries of markers, it is necessary to make direct comparisons of the faecal marker recoveries from various herbage species. Although a few direct comparisons of faecal marker recoveries from various herbage species exist, most of these studies came to the similar conclusion. In cattle, differences of faecal alkane recoveries were observed between herbage species (Ohajuruka and Palmquist, Reference Ohajuruka and Palmquist1991; Hendricksen et al., Reference Hendricksen, Reich, Roberton, Reid, Gazzola, Rideout and Hill2002). In sheep, recent studies found an effect of herbage species on faecal recoveries of alkanes (Lin et al., Reference Lin, Luo, Zhang and Shu2007; Elwert et al., Reference Elwert, Dove and Rodehutscord2008), alcohols and acids (Lin et al., Reference Lin, Luo, Wang, Zhang and Shu2009a). These results implied that the major source of the variation of faecal marker recoveries between diets should be the herbage species that comprise the diets, and therefore the effect of the diet composition on faecal marker recoveries would depend on the particular species comprising the diets (Ferreira et al., Reference Ferreira, Carvalho, Falco, Celaya, Garcia, Santos, Rodrigues and Osoro2009a). Elwert et al. (Reference Elwert, Dove and Rodehutscord2008) also suggested that even though faecal marker recoveries may differ among individual feeds, the possible differences become less important in mixtures of varying proportions of the individual feeds.
In this study, the abnormally high faecal recoveries of C26-acid detected across diet treatments ranged from 1.19 to 1.47. A recent experiment conducted by Lin et al. (Reference Lin, Luo, Zhang, Wang, Shu and Hong2009b), using the same analytical procedures for acids as in this study, also found abnormally high faecal recoveries of C26-acids. A possible explanation could be a co-elution, during GC analysis, of unsaturated C20 or C22-acids and the C26-acids, erroneously resulting in greater recoveries (Lin et al., Reference Lin, Luo, Zhang, Wang, Shu and Hong2009b). However, excluding C26-acid from the markers employed for estimating diet composition did not improve the accuracy of estimates. Therefore, C26-acid and its faecal recovery were further used for estimating diet composition.
Determining diet composition
The reliability of the plant wax technique would decline as the number of dietary components increases, because the potential for diet components to exhibit similar marker patterns to that of another diet component increases as the number of components increases (Dove and Mayes, Reference Dove and Mayes1991 and Reference Dove and Mayes1996). Results of this study supported a previous conclusion that the increase in number of possible diet components led to a decrease of the KSI values (Ferreira et al., Reference Ferreira, Carvalho, Falco, Celaya, Garcia, Santos, Rodrigues and Osoro2009a).
The correction of faecal marker concentrations for their incomplete recovery is necessary to avoid possible bias when estimating diet composition (Dove and Mayes, Reference Dove and Mayes1996; Brosh et al., Reference Brosh, Henkin, Rothman, Aharoni, Orlov and Arieli2003). Faecal marker recovery is an important and sensitive factor, which could influence the accuracy of diet composition estimates (Brosh et al., Reference Brosh, Henkin, Rothman, Aharoni, Orlov and Arieli2003; Elwert et al., Reference Elwert, Kluth and Rodehutscord2004; Ferreira et al., Reference Ferreira, Oliván, Rodrigues, Garcia and Osoro2005). More information on faecal recovery values would allow a more accurate prediction of diet composition (Elwert et al., Reference Elwert, Dove and Rodehutscord2008). Therefore, when diet composition estimates were based on diet recovery as compared with general recovery, a better estimate of diet composition was achieved, especially in situations where diet composition had an effect on faecal marker recoveries (Lin et al., Reference Lin, Luo, Zhang and Shu2007; Ferreira et al., Reference Ferreira, Carvalho, Falco, Celaya, Garcia, Santos, Rodrigues and Osoro2009a; Lin et al., Reference Lin, Luo, Zhang, Wang, Shu and Hong2009b). For diet A, in this study, the ANOVA result of the KSI value showed that the best agreement between the observed and estimated diet composition was obtained on the basis of diet recovery. However, across the three diets, no differences were found in the accuracy of diet composition estimates based on diet recovery and general recovery. The lack of an effect due to faecal recovery correction was because recovery was unaffected by diets. These results further supported our earlier suggestion that, for free grazing sheep, an appropriate faecal marker recovery is necessary to achieve accurate diet composition estimates, and these appropriate faecal recoveries could be obtained from a concomitant indoor experiment on a separate group of animals, fed a similar diet or at least a diet with the same composition (Charmley and Dove, Reference Charmley and Dove2007; Lin et al., Reference Lin, Luo, Zhang and Shu2007; Elwert et al., Reference Elwert, Dove and Rodehutscord2008).
Some of the standard deviations of diet composition were quite high, especially for the component with relatively small proportion (Tables 3 and 4). This shows a common dilemma, as Charmley and Dove (Reference Charmley and Dove2007) discussed, when using plant wax markers to estimate diet composition and intake. Treatment mean values are often close to the expected values, although large variation in estimates for individual animals can be observed. This indicates the necessity for using a large sample size.
The significant effect of the marker and the strong interaction between marker and diet (P = 0.095) on the overall KSI values indicated that, for different diets, the same markers or marker combinations have different potential for estimation of diet composition. However, across the three diets in this study, the better estimates of composition were obtained with the combinations of two or three marker types (alkanes and alcohols; alkanes and acids; alcohols and acids; and alkanes and alcohols and acids), whereas alkanes, alcohols or acids also showed accurate estimates in diet A. Studies of Ali et al. (Reference Ali, Mayes, Hector, Verma and Ørskov2005) and Lin et al. (Reference Lin, Luo, Zhang, Wang, Shu and Hong2009b) concluded that alcohols had great potential to estimate composition of complex diets, whereas the estimation using acids was poorer, and alkanes were of intermediate potential. Ferreira et al. (Reference Ferreira, Carvalho, Falco, Celaya, Garcia, Santos, Rodrigues and Osoro2009a) also reported that diet composition estimates based on acids alone were less accurate than those obtained using alkanes alone. In contrast, data from another study indicated that estimates of diet composition based on alcohols alone were not as good as alkanes alone (Dove and Charmley, Reference Dove and Charmley2008). Nevertheless, most of the studies concluded that diet composition estimated from the combination of two or three marker types was always better than using a single marker type (Ali et al., Reference Ali, Mayes, Hector, Verma and Ørskov2005; Dove and Charmley, Reference Dove and Charmley2008; Ferreira et al., Reference Ferreira, Carvalho, Falco, Celaya, Garcia, Santos, Rodrigues and Osoro2009a).
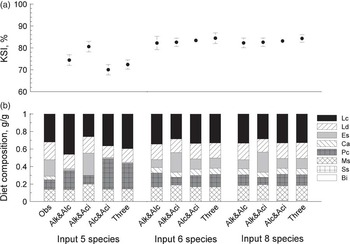
Generally, diet composition of free-ranging ruminants is not as complex as the plant communities of the rangeland they graze. Therefore, Dove and Mayes (Reference Dove and Mayes2005) suggested that microscopic methods of faecal cuticle analysis or observational measurements may provide a good indication of whether an animal is consuming an individual plant species, and the combination of such qualitative procedures with plant wax marker methods would give a more reliable estimate of diet composition for animals in complex plant communities. However, although the microscopic methods and the observational measurements would accurately determine the major diet components of free-ranging animals, they might give incorrect information of the minor diet components (Dove and Mayes, Reference Dove and Mayes2005). This could lead to erroneous decisions regarding the exclusion or inclusion of herbage species from the least-squares estimation based on plant wax markers. Previous studies have shown that including herbage species, which animals never consumed, into least-squares estimation resulted in accurate diet composition estimates using plant wax markers (Ferreira et al., Reference Ferreira, Carvalho, Falco, Celaya, Garcia, Santos, Rodrigues and Osoro2009a). Nevertheless, little published information is available to answer whether excluding minor diet components from estimation of diet composition based on plant wax markers would affect the accuracy of diet composition estimates. In this study, the effect of excluding or including some herbage species as potential diet components on the accuracy of diet composition prediction was tested, using diet B as an example. The composition of diet B had C. album as a minor diet component (3.9%), and the other five herbage species (L. chinensis, L. dasystachys, E. sibiricum, P. chinampoensis and M. sativa) as major diet components (>11.2%). Figure 2 shows the difference of the accuracy of diet composition prediction, based on general faecal recovery, among the three treatments of using different herbage species as potential diet components: first, using only the five major diet components (Input 5 species); second, using all the six observed diet components (Input 6 species); third, using not only the six observed diet components, but also the other two herbage species (S. sinuata and B. inermis), which were never consumed by animals in diet B (Input 8 species). Results indicated that although diet B only contained 3.9% of C. album calculation without taking into account C. album would clearly decrease (P < 0.05) the accuracy of diet composition estimates (Figure 2, Input 5 species v. Input 6 species). However, no significant difference between Input 6 species and Input 8 species (P > 0.05) indicated that including extra herbage species that were not grazed by sheep would not reduce the quality of diet composition estimates. This result suggested that in the situation where the number of available markers are greater than that of the potential diet components of animals, all the potential diet components should be considered when diet composition are estimated by the plant wax markers technique. However, for animals grazing on complex swards, the available herbage species may be numerically greater than available markers, and then microscopic methods or observational measurements should be carefully used.
Kulczynski similarity index (mean ± s.e.) and observed (Obs) and estimated diet composition of diet B using different combinations of n-alkanes (Alk), long-chain alcohols (Alc) and long-chain fatty acids (Aci) based on the mean recovery across all dietary treatments. The observed diet composition of diet B is 32.1% Leymus chinensis (Lc), 20.2% L. dasystachys (Ld), 18.8% Elymus sibiricum (Es), 3.9% Chenopodium album (Ca), 11.2% Puccinellia chinampoensis (Pc) and 13.9% Medicago sativa (Ms). Estimates based on different herbage species as potential diet components: Input 5 species, using only the five major components (Lc, Ld, Es, Pc and Ms) of diet B; Input 6 species, using the five major components and one minor component (Ca) of diet B; Input 8 species, using the six diet components of diet B and the other two herbage species, Saussurea sinuata (Ss) and Bromus inermis (Bi), which were never consumed by animals in diet B.

Conclusions
This study confirmed the usefulness of alkanes, alcohols and acids as markers for determining the complex diet composition of sheep with up to eight diet components, although the reliability of the plant wax technique appeared to decline as the number of dietary components increased. Faecal marker concentrations corrected based on general faecal recoveries yielded sufficiently accurate estimates of diet composition, indicating that, for free-ranging sheep, accurate diet composition estimates could be achieved based on faecal marker recoveries obtained from a concomitant indoor experiment on a separate group of animals, given a similar diet composition.
Excluding minor diet components from diet composition calculations decreased the accuracy of diet composition estimates, whereas including extra herbage species that were not grazed by sheep would not reduce the quality of diet composition estimates. Therefore, attention should be paid to avoid missing minor diet components from the calculation of diet composition, which could happen when the plant wax marker technique is used to estimate diet composition of free-ranging animals.
Acknowledgements
This study was supported by the ‘973’ (No. 2007CB106805), National Natural Science Foundation of China (30871822) and Projects for agro-industry technology research (200903060).