

How corporations successfully adapt to global competition remains highly relevant in business studies. At least since Alfred Chandler's influential works, business historians have discussed which corporate strategies are appropriate in response to global competitive pressures. The business history literature has identified many recurrent patterns in European and U.S. firms’ responses to global competition, while also discussing the basis for strategic divergence among firms from different countries.Footnote 1 In recent years, corporations from small, open economies, such as the Nordic countries and the Netherlands, have received particular attention.Footnote 2 Such corporations are highly dependent on global competition, as they have small home markets. With economic globalization and economic integration in recent decades, new export opportunities have also emerged for them. While many of these corporations have followed general patterns of global competition, a key question remains: Under which circumstances have corporations successfully deviated from widely accepted strategies for global competition? This question is particularly important because it promises to help researchers disentangle the general forces of global competition from the individual effects of human agency.
Shipbuilding is a particularly relevant industry in which to study corporate responses to global competition. According to Dong Sung Cho and Michael E. Porter, shipbuilding is “an extreme case of a global industry” and has been “global, at least since the nineteenth century.”Footnote 3 Its products—ships—are mobile, and shipowners can order ships from wherever they prefer. Therefore, shipbuilders have experienced global competitive pressures from an early point in time and seen global shifts that were later observed in other manufacturing industries.Footnote 4 Since the early twentieth century, when British shipbuilders held a market share over 60 percent, several global shifts have occurred. By the late nineteenth century, German shipbuilders had started to challenge the British, and from World War I, expanding Swedish, Dutch, Danish, and other European shipbuilders followed suit. An eastward shift in hegemony occurred early, and Japanese shipbuilders had climbed to the top ranks of global shipbuilding by 1956. In the 1970s, South Korea emerged as a major global shipbuilding nation, followed by China's rapid ascent from the 1990s. While Japan has remained a major shipbuilding nation, Europe accounted for only 5.78 percent of global deliveries in 2014.Footnote 5 Questions related to shipyard competitiveness and global shifts have indeed intrigued historians, who have sought to explain the mixed fortunes of individual yards and whole shipbuilding nations, both declining and emerging ones.Footnote 6
Shipyards have also attracted attention beyond business history. In Porter's influential 1986 book on competition in global industries, quoted above, a full chapter, authored by Cho and Porter, was dedicated to shipbuilding. Cho and Porter studied “the process of global competition over time” and argue that their study has broader implications for competition in global industries.Footnote 7 Seeing global competition in a dynamic perspective, they demonstrated how companies had to adapt their global strategies to changes in their environment. Identifying appropriate strategies for firms based in different countries at different points in time, they discovered four generic strategies that shipyards have followed sequentially.Footnote 8
The first strategy was cost leadership. Yards located in countries with low labor costs would typically enter the shipbuilding industry based on cost advantages. Further cost advantages have been derived from low material costs (such as steel, main engines, and marine equipment).Footnote 9 High labor productivity based on efficient organizations, high levels of trust between labor and management, and a conducive labor culture may have contributed further to the cost advantages.Footnote 10 Initially focusing on standardized and simple ship designs, Cho and Porter argue that yards “that succeeded combined initial factor advantages with rapidly rising technology.”Footnote 11
In response to rising national costs, in particular for labor, shipbuilders have gradually migrated to global differentiation or global segmentation strategies.Footnote 12 Shipbuilders in high-cost countries specialize in sophisticated vessels, for which they charge premium prices. A wide range of vessel types is supplied according to the differentiation strategy, and quality in terms of technology and punctual deliveries is high. Global segmentation, a niche strategy, focuses more narrowly on a specific type of vessel, such as cruise ships, which requires very sophisticated engineering know-how and high standards of workmanship.
The last strategy, protected market, is based on government protection to compensate for low competitiveness. Employed in the last phase, this strategy has proven unsuccessful in securing long-term survival. According to Cho and Porter, “its high cost raises serious questions about its appropriateness.”Footnote 13 Various governmental support schemes have been observed in shipbuilding nations around the world, including direct subsidies, government orders, and government ownership.Footnote 14
Cho and Porter ruled out the existence of a fifth strategy, one that existed in other manufacturing industries:
The national responsiveness strategy focuses on a certain regional market and capitalizes on differences in buyer needs or channels in that particular country. Ships are a mobile product, and buyer needs across countries are quite homogenous. Therefore, this strategy is not employed in shipbuilding.Footnote 15
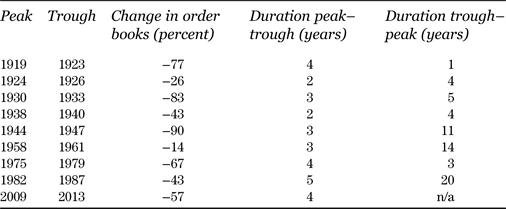
Changes in shipbuilding hegemony have represented irreversible shifts, but pronounced shipbuilding cycles have also characterized the business (Table 1).Footnote 16 Cycles in shipping freight markets translate into shipbuilding cycles with a time lag. Shipping cycles occur because freight rates respond quickly to demand changes caused by, for example, political crises or natural disasters, and supply of new ships adapts slowly because it can take two to three years from order to delivery. Shipyards rarely have alternative uses and face high exit barriers due to high fixed costs. To partly counteract shipbuilding cycles, some yards have also engaged in ship repair.Footnote 17
Global Shipbuilding Cycles

Sources: Martin Stopford, Maritime Economics (New York, 2009). Data for the 2009–2013 cycle are based on UNCTAD Review of Maritime Transport 2015 (Geneva, 2015), 45.
Cho and Porter analyzed the dynamics of global competition over the course of the twentieth century. While such generalizing studies provide valuable insights into recurrent patterns of competition, unique corporate cases also deserve further attention. Under which circumstances can companies successfully defy accepted notions of competitiveness and diverge from general patterns of global competition? To answer this question requires a thorough assessment of the role of individuals and their agency in creating global competitiveness. As Randall Morck and Bernard Yeung argue in a 2011 article, “History provides context—an intensity of information around a few observations—and this can sometimes be as useful as a large data set.”Footnote 18 In defense of business history, they elaborate:
History records autobiographical and biographical information that can tell us what people were thinking, worrying about, or pursuing when they did what they did. . . . Fundamental advances in understanding . . . can emerge from ascertaining the constraints, knowledge, motives, and cognitive processes of those key decision-makers.Footnote 19
Following Morck and Yeung's call, this article examines the competitiveness of Odense Steel Shipyard, which was located in Denmark and associated with a large shipping company, A.P. Moller-Maersk. The article analyzes the strategies pursued by the yard from 1918 to 2012 and the key decision makers’ motivations. In doing so, it challenges Cho and Porter's framework of competitiveness and demonstrates how Odense defied accepted concepts of competitiveness for two decades. For a long period Odense Steel Shipyard succeeded in responding to global competition with a unique strategy. The case illustrates how individuals, under certain conditions, were able to shape competitiveness in a unique way and to some extent counteract the broader forces of global competition.
Methods
The article analyzes the responses to global competition, and the strategies, of Odense Steel Shipyard managers and owners. It explores the competitive position of the shipyard as perceived by key decision makers, based on the archives of the yard and the A.P. Moller-Maersk Group. The main sources are comprehensive shipyard board meeting minutes and correspondence between shipyard management and the shipyard owner. Due to the confidential nature of correspondence and board minutes, these sources are ideal for analyzing decision makers’ perceptions of competitiveness and the evolution of their perspectives. In correspondence with yard management, it is reasonable to expect the owner to hold a critical perspective on such issues as quality, costs, and productivity; in this way the owner could motivate yard management to engage in continuous improvements. On the other hand, the yard management may have had an interest in providing the owner with positive assessments of the yard. The yard and owner archives allow identification of key decision makers and an analysis of the rationales behind their strategic decisions at the points in time when these were made. The article then compares the Odense Steel Shipyard strategies with the generic shipyard strategies identified by Cho and Porter. It also situates the yard strategy within the broader developments of Danish manufacturing exports, as analyzed in business history literature.Footnote 20
Cost Leadership
Toward the end of World War I, Danish shipowner A. P. Møller established the Odense Steel Shipyard in the town of Odense, Denmark. At that time, agriculture dominated Danish exports, but the war had provided new opportunities for trade and manufacturing companies due to Danish neutrality. Shipping and shipbuilding in particular experienced a boom, and several new Danish shipping companies and shipyards were established in response.Footnote 21 Møller's business also benefited from this situation. He managed a fleet of tramp ships in two steamship companies, named Svendborg and 1912, which were founded in 1904 and 1912, respectively. The Møller family held controlling interests in the two shipping companies, but Møller himself made the investment in the shipyard. The two companies engaged in tramp shipping and followed the same growth trajectory.Footnote 22 Commonly known as the Maersk shipping companies, they acquired secondhand tramp ships, which were soon supplemented with new builds from Dutch and U.K. shipyards.Footnote 23
In setting up his own shipyard, Møller followed a trend of vertical integration in Danish shipbuilding at the time. During World War I, the leading Danish shipping companies—East Asiatic Company, DFDS, and J. Lauritzen—acquired Danish shipyards or established greenfield yards. Together with A. P. Møller these three companies remained the leading owners of Danish shipyards until the late twentieth century.Footnote 24 However, the inspiration to set up a shipyard, according to Møller, had come from a British tramp-shipping and shipbuilding group, Robert Ropner. From 1895 to 1897, Møller had worked as a shipping trainee in Newcastle, in close proximity to Ropner, which built what was one of the world's largest fleets at the time. In a 1918 letter to the Svendborg board, Møller explained that he had set up the Odense Steel Shipyard “to support the shipping interests and to develop a similar relationship between shipping and shipbuilding as the world-renowned company R. Ropner in West Hartlepool had so convincingly done.”Footnote 25 Møller strongly believed in the principles of vertical integration. During World War I, access to building berths was a major challenge. While the United Kingdom engaged in hostilities, shipowners could not easily place new orders. Danish neutrality and booming freight markets provided major business opportunities for Danish shipowners, but shipyard berths were in scarce supply. Vertical integration would give Møller's shipping companies preferable access to such berths.Footnote 26 This development was also in line with general trends in Danish business, where business leaders were concerned about foreign supplies in times of hostilities and wanted to strengthen national self-sufficiency.Footnote 27
Through an initial investment of DKK 2 million, Møller established a medium-sized shipyard, based on well-proven technologies.Footnote 28 Aiming at a global cost-leadership strategy, he established a low-cost yard in terms of equipment and layout.Footnote 29 During the late 1920s, the shipyard enjoyed a 5 to 20 percent wage-level advantage relative to Danish competitors.Footnote 30 Moreover, wage levels at Danish shipyards were lower than those for Norwegian competitors, while matching Swedish levels.Footnote 31
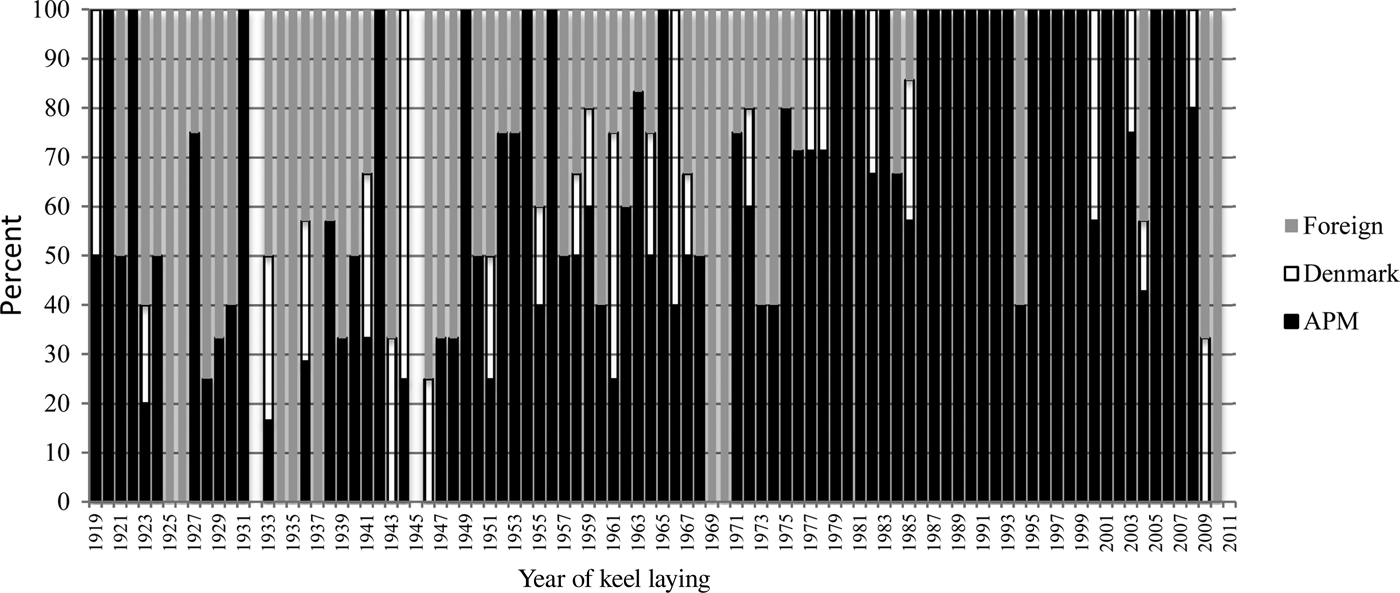
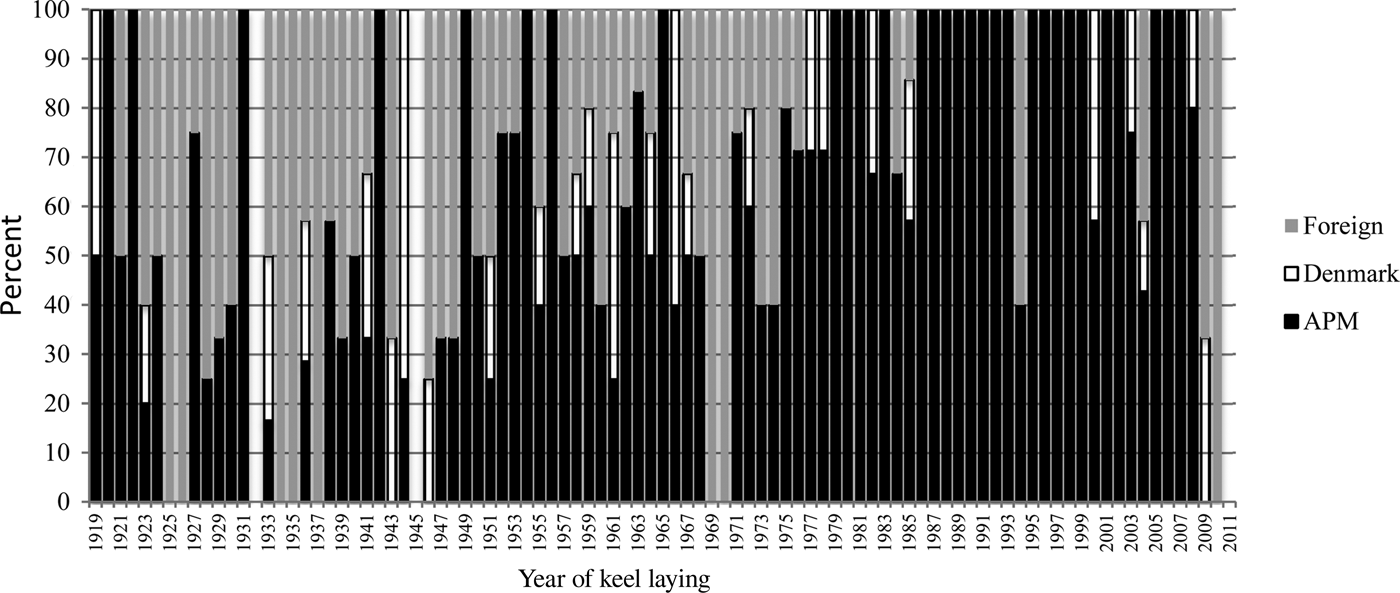
The shipyard allowed Møller to constantly update his technical knowledge, in which he had held a profound interest since childhood.Footnote 32 Møller constantly delved into technical matters at the shipyard, both large and small, while he also served as executive for the two expanding shipping companies.Footnote 33 At the same time, the yard provided him with commercial information on trends in the shipping markets, including insights into other shipowners’ tenders for new ships. Building vessels for both the two Maersk shipping companies and external shipowners, the yard initially focused on relatively simple tramp ships.Footnote 34 From 1919 to 1935, Maersk orders accounted for 37 percent of the order book (Figure 1).
Deliveries from Odense Steel Shipyard by customer nationality and keel-laying year. The figure is based on number of ships. APM refers to the Maersk shipping companies. (Source: René Schrøder Christensen, “Odense Staalskibsværft 1918–2012 – et teknologisk førende værft nationalt og internationalt?” [Odense Steel Shipyard 1918–2012: A technologically leading shipyard nation- and worldwide?], 314–38 [PhD diss., University of Southern Denmark, Odense, 2016]).
Although Møller envisaged a cost-leadership strategy for the yard, cost challenges soon emerged. In terms of labor productivity, the shipyard compared unfavorably with German and Swedish shipyards, which Møller considered to be world leaders.Footnote 35 Improvements were made, but the physical layout and old equipment made such efforts difficult.Footnote 36 Indeed, the small labor-cost advantage could not compensate for low-labor productivity. Odense Steel Shipyard was also disadvantaged with regard to material costs. It depended on steel imports, and additional transportation costs for steel were incurred because of the yard's location at the narrow Odense Canal.Footnote 37
For Danish manufacturing exports in general, the 1920s and early 1930s were difficult times. Declining industrial exports represented only approximately one-third of exports from agriculture, and home-market orientation for manufacturing companies generally increased. During the global crisis of the early 1930s, protectionism and various trade barriers proliferated.Footnote 38 These developments were particularly problematic for corporations in small economies such as Denmark. In the Danish context, the interwar period has been described as “a general set-back for multinational activities.”Footnote 39
Shipping and shipbuilding were also strongly affected by the crisis, suffering from excess capacity, and in 1931 the order book at Møller's yard was empty.Footnote 40 Møller asked shipyard workers for a 15 percent wage reduction in return for new orders from the Maersk shipping companies. When labor unions declined, Møller closed the shipyard and laid off all blue-collar workers. The shipyard's managing director, Martin Andreas Westh, resigned, and all berths were empty from May 1932 to February 1933.Footnote 41 The yard was reopened in March 1933, with Erik Ringsted as the new managing director. Møller had recruited Ringsted from a position as senior engineer at another Danish shipyard, Burmeister & Wain, and Ringsted had international shipbuilding experience from a position at Barclay Curle & Co., Glasgow. One of Ringsted's first achievements was a 5 percent wage reduction agreement with the labor unions.Footnote 42 Møller did not expect high returns on his investment, however.Footnote 43 He shared his aim with Ringsted in a 1933 letter: “the shipyard must be run effectively with the goal of at least covering expenses.”Footnote 44
Protectionism in the 1930s characterized not only international trade, but also shipbuilding.Footnote 45 The Danish government offered attractive loans with low interest rates to shipowners during this period, in response to foreign subsidies, particularly those in the United Kingdom.Footnote 46 Evidence in the archives of the Odense Steel Shipyard suggests that such loans were also granted for ships built at Odense at the time.Footnote 47 This contrasts with the conclusion of Cho and Porter, who argue that “protected market strategies tend to be chosen at the declining phase of the industry and seem to be sustainable for only a short period.”Footnote 48 Although no comprehensive, international comparison of shipbuilding subsidies exists for the period, it is clear that protectionist schemes were implemented while shipyards employed cost-leadership, differentiation, and segmentation strategies. Government protection in large shipbuilding nations contributed to some extent to a regionalization of shipbuilding markets in the 1930s.
Some shipyards also supported regionalization, which attempted to restrict competition. In 1933, Odense Steel Shipyard reached an agreement with major Swedish and Dutch tanker shipbuilders Nederlandsche Scheepsbouw and Götaverken on such competitive restrictions. The Dutch would refrain from tenders in the large Norwegian market, while Götaverken and Odense Steel Shipyard would not compete for Nederlandsche Scheepsbouw's traditional customers.Footnote 49 In the following year, further correspondence between Møller and Götaverken hinted at such market coordination. Certain customers were seen as “naturally” belonging to certain yards.Footnote 50 Such practices were legal in Denmark until 1937, when the first national competition law was enacted.Footnote 51 Cho and Porter argue that shipbuilding was a global industry, but the practices of yards from small economies indicate that this characterization is not fully warranted. Efforts to regionalize and restrict competition in response to global competition were made during this period.
Global Segmentation
In the 1930s, Møller wanted the yard to adopt a new strategy based on global differentiation. The yard should build several advanced ship types, such as refrigerated vessels and liner ships, for the global shipping market. In Møller's words to the yard management,
Other yards attract considerable orders from different places in the world. We are not even considered, probably due in part to a lagging sales organization, and partly because we cannot meet specific needs in the design process. We only have Norway and a one-sided production.Footnote 52
Odense Steel Shipyard built a few refrigerated ships and liner vessels in the interwar period, but gradually it adopted a different strategy, based on global segmentation.Footnote 53 The basis was laid in the late 1920s with orders from the Norwegian market. During the 1920s and 1930s, Odense Steel Shipyard relied on orders from Norway and the Maersk shipping companies (Figure 1). Møller personally cultivated Norwegian shipowners through his personal network, with investments in expanding Norwegian tanker shipping companies controlled by Leif Høegh, Sigval Bergesen, and Anders Jahre. He used this network to secure orders for Odense Steel Shipyard.Footnote 54 In 1927, Odense Steel Shipyard delivered its first tanker, and the buyer was a major Norwegian shipowner, A.F. Klaveness & Co. The Maersk shipping companies entered tanker shipping one year later, with a fleet built in Copenhagen and Odense.
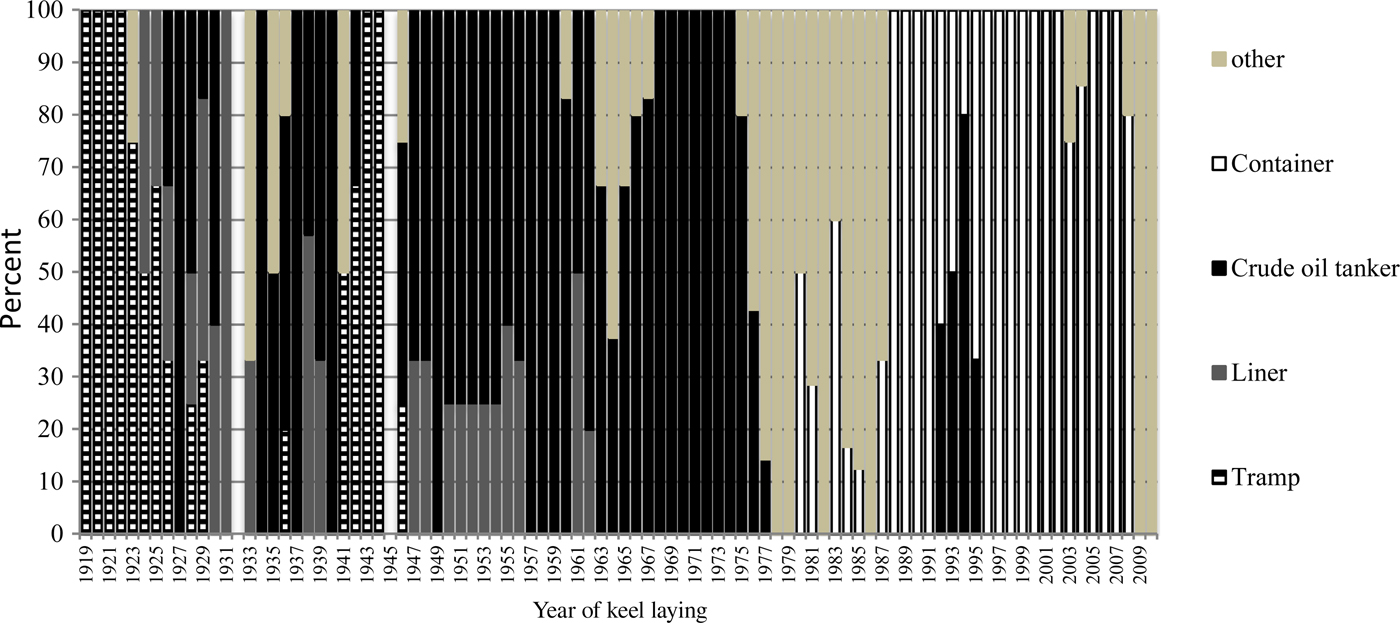
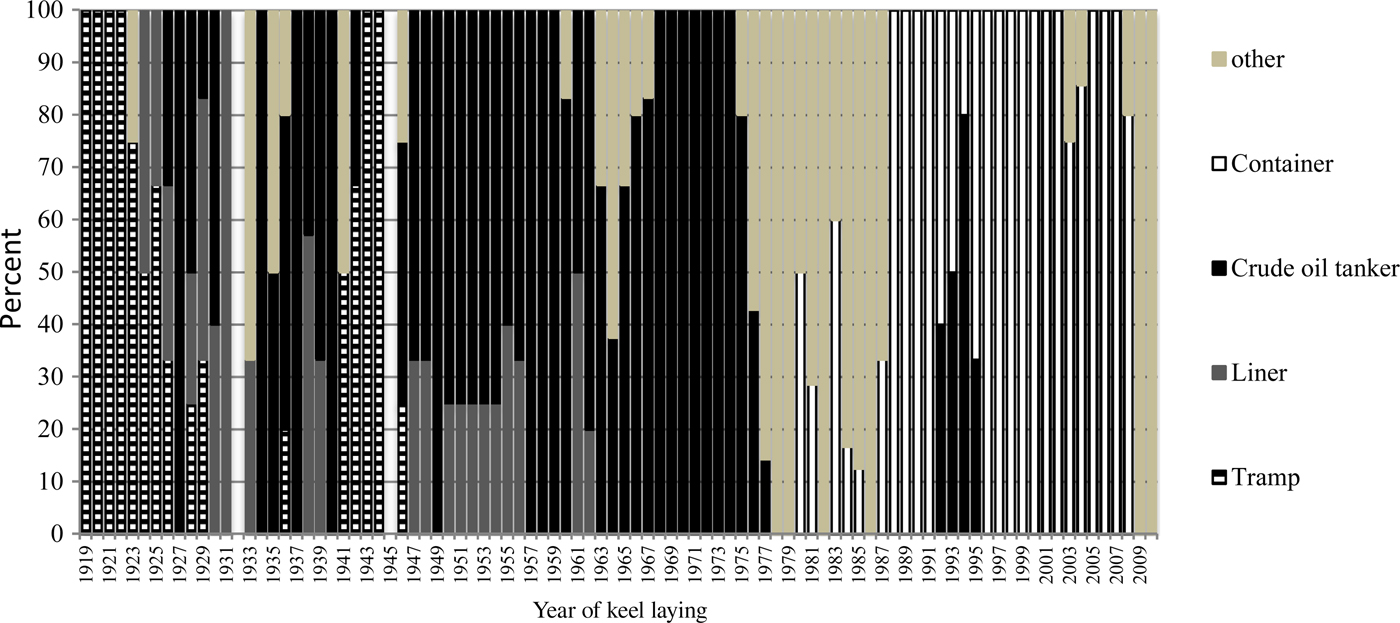
Although Møller was skeptical about a global segmentation strategy and lamented the yard's reliance on his Norwegian network, the focus on tankers proved fruitful. Tankers represented the only major growth segment in shipping in the interwar period and provided even greater business opportunities with the breakthrough of the international oil economy after 1945. In particular, Swedish and Japanese shipbuilders responded with major investments in new welding technologies, large-scale ship section construction, and most significantly in more commodious facilities, which could accommodate ever-larger tankers.Footnote 55 While Odense was not an innovator in regard to welding technology and section construction, it invested in a new shipyard at Lindø, twelve kilometers from the original site. Opened in 1959, the Lindø yard had two building docks with a capacity of 100,000 deadweight tons (dwt) each; a third, even larger dock for tankers of up to 750,000 dwt was inaugurated in 1969. This infrastructure allowed the yard to focus almost entirely on the rapidly rising demand for ever-larger crude oil tankers (Figure 2). It found customers from the Maersk companies, oil majors, and independent Norwegian and Greek shipowners (Figure 1). This strategy represented clear global segmentation, as described by Cho and Porter, and it was successful for many years. While the Lindø yard experienced challenges in its first years of operation, it made profits each year from 1956 to 1971 (with the exception of 1962 and 1963, which saw losses).Footnote 56 In 1972, Erik Quistgaard, engineer and shipyard managing director, declared the shipyard “technically to be completely competent.”Footnote 57
Deliveries from Odense Steel Shipyard by vessel type and keel-laying year. The figure is based on numbers of ships. “Other” refers mainly to reefers, dry bulk carriers, product tankers, and LPG carriers. (Source: René Schrøder Christensen, “Odense Staalskibsværft 1918–2012 – et teknologisk førende værft nationalt og internationalt?” [Odense Steel Shipyard 1918–2012: A technologically leading shipyard nation- and worldwide?], [PhD diss., University of Southern Denmark, Odense, 2016], 314–38).
Originally owned by shipowner A. P. Møller, the yard was transferred to a limited liability company, Odense Steel Shipyard Ltd., in 1944. This had the two Maersk shipping companies and Møller as shareholders. Møller was the majority owner and key decision maker, serving as chief executive for the two shipping companies and chairman of the shipyard board. In 1957 the two Maersk companies became majority owners of the yard, but Møller remained the key decision maker. On his death in 1965, the two shipping companies acquired the remaining shares, and his son, Mærsk Mc-Kinney Møller, took over and continued the family leadership of the shipyard and the conglomerate of the two Maersk shipping companies.
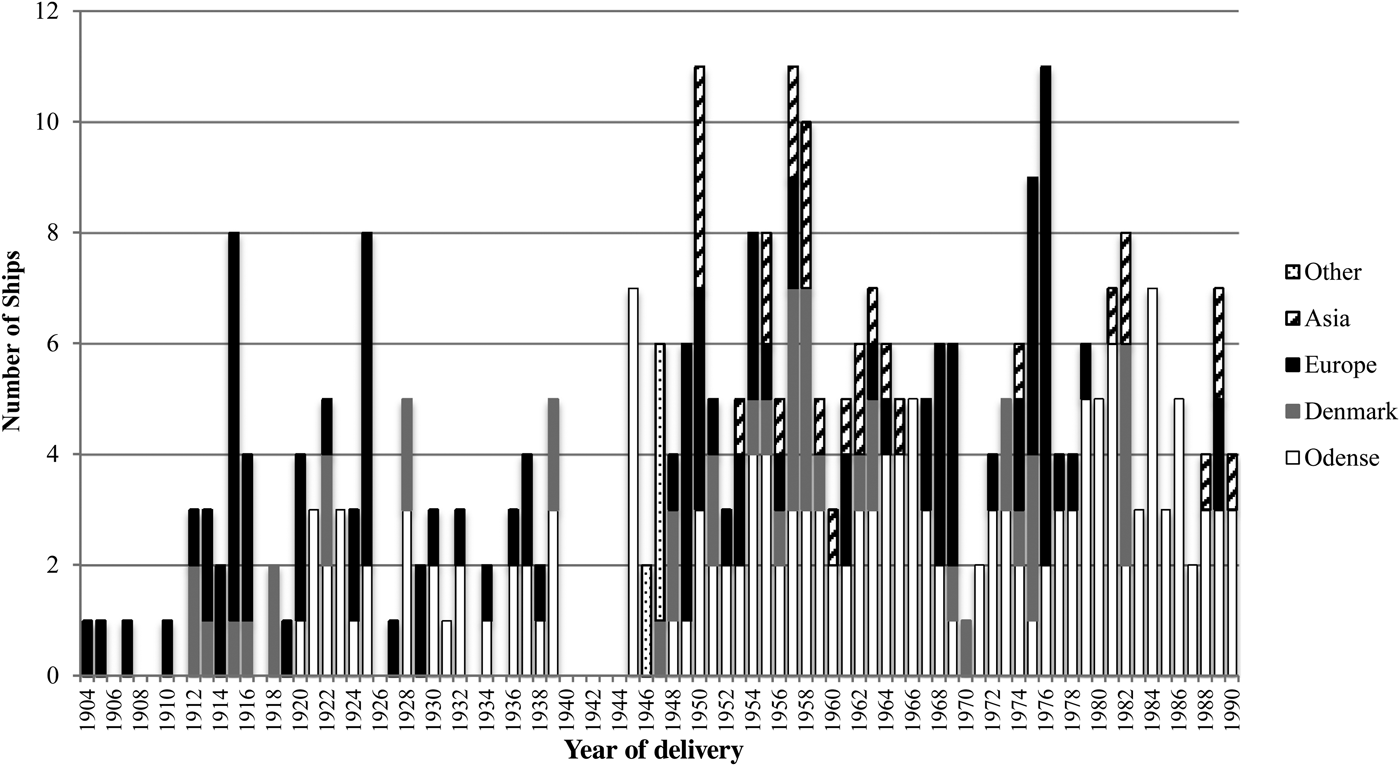
Meanwhile, the two Maersk shipping companies developed into a diversified conglomerate and followed general patterns of diversification among international conglomerates of the period.Footnote 58 In 1962 they entered oil and gas exploration in the North Sea, starting production in 1972.Footnote 59 They also diversified into aviation, retailing, and other manufacturing industries with a simultaneous expansion of the fleets of tankers, dry bulk carriers, and liner vessels as well as niche supply vessels and car carriers.Footnote 60 Maersk built tankers mainly at Odense, whereas orders for other types of ships and oil platforms were placed in Norway, Japan, and elsewhere (Figure 3). In keeping with the global segmentation strategy, Odense was tailored for supertankers.
Number of new vessels delivered for Maersk shipping companies by country of build and delivery year, 1904–1990. (Sources: Ove Hornby, Ved rettidig omhu: skibsreder A. P. Møller 1876–1965 [Copenhagen, 1987] translated as “With Constant Care . . . ” A. P. Møller Shipowner, 1876–1965 [Copenhagen, 1999]; Ole Stig Johannesen, Mærskbådene – rederiernes skibe gennem de første 50 år [Maersk Ships: The shipowners’ ships during the first fifty years] [Roskilde, 2006]; Ole Stig Johannesen, Mærskskibene II, skibene i årene 1955–1975 [Maersk Ships II: The ships 1955–1975] [Roskilde, 2007]; Ole Stig Johannesen, Mærskflåden, Skibene i årene 1976–1990 [The Maersk fleet: The ships 1976–1990] [Roskilde, 2010]).

The growth of the Odense Steel Shipyard and the Maersk shipping companies coincided with a period of very rapid Danish growth after 1957. While the Danish economy had grown more slowly than other European economies in the early and mid-1950s, it then entered into a phase of accelerated growth. In 1961, Danish industrial exports finally exceeded the value of agricultural exports. The high growth has been attributed to Danish export-oriented industries, as well as domestic institutional factors.Footnote 61
Global Differentiation
In 1973, after a public referendum, Denmark joined the European Economic Community (EEC)—a move that coincided with an economic downswing. Although no immediate “Europeanization” of the Danish economy occurred, EEC membership gradually opened new European export opportunities for Danish companies. With the agreement creating a European Single Market, European economic integration gathered momentum to the benefit of Danish exports from the late-1980s onward.Footnote 62
While the EEC gradually provided new export opportunities for Danish manufacturing companies, the global shipbuilding industry descended into one-and-a-half decades of recession. Demand for oil tankers collapsed as a consequence of the 1973 oil crisis, and shipbuilders had to fundamentally reconsider their businesses. Within approximately one decade, numerous yards and major shipbuilding nations, such as Sweden, exited entirely from the industry.Footnote 63 While also experiencing global competitive pressures, South Korea gained market share, relying on cost-leadership and segmentation strategies, and Japanese yards managed to pursue global differentiation strategies, as identified by Cho and Porter.Footnote 64
Odense Steel Shipyard was placed in a vulnerable position, with high labor costs and productivity concerns.Footnote 65 Mærsk Mc-Kinney Møller argued that Danish shipbuilding wages exceeded those in “the world with which we compete.”Footnote 66 He emphasized how “our competitors located in the Far East build strength on the fact that everybody puts all efforts into their work—every day, every week, every month—in all working hours, and they are seldom absent.”Footnote 67 According to the Odense Steel Shipyard board meeting minutes, “every day 400–500 people are absent—and the management does not know who will be absent in advance.”Footnote 68 The yard could buy steel at attractive prices in Sweden. However, with regard to marine equipment the yard suffered a cost disadvantage compared to Japanese competitors.Footnote 69 In the search for new markets and ship types, the Danish yard also required new shipbuilding and naval architecture competencies.Footnote 70
In most major shipbuilding nations, state support was a regular feature of the 1970s. In some instances, such as Sweden and the United Kingdom, governments nationalized shipbuilding, while in other cases governments resorted to other support measures.Footnote 71 Danish government support came in the form of cheap credit for shipowners, who were encouraged to order ships from Danish yards. Various tax incentives under the so-called K/S limited partnership scheme (kommanditselskab) were also granted to private Danish investors to stimulate demand for Danish shipbuilding.Footnote 72 On the whole, Danish government support could not fully compensate for advantages that other governments provided to their shipbuilders, and the first K/S financed orders for Odense Steel Shipyard came only in the early 1980s via the Maersk shipping companies.Footnote 73 In international trade negotiations, Danish delegations spoke out against further subvention and deemed global subsidies a race that was impossible to win in the long run.Footnote 74
Abandoning the global segmentation strategy, Odense Steel Shipyard embarked on a global differentiation strategy, as identified by Cho and Porter. It started building a broad range of vessels for the world market, from small to large and simple to sophisticated. These included several small, advanced offshore supply and anchor handling vessels, medium-sized roll-on/roll-off ships and container carriers, offshore platforms, and gas tankers, as well as simple barges and large bulk carriers (Figure 2). This transformation was a difficult one for a yard that had been designed for building large tankers.Footnote 75
While orders were sought in the global market, the vast majority came from the Maersk shipping companies (Figure 1). The Maersk shipping companies’ experiences with ships built at other shipyards allowed Mærsk Mc-Kinney Møller to benchmark Odense Steel Shipyard. In 1978 he conceded that “since 1976 it has been impossible for the shipyard to secure any order . . . apart from those coming from the Maersk Group.”Footnote 76 In the 1970s, the workforce at Odense Steel Shipyard was reduced by approximately 50 percent, and further layoffs occurred in the 1980s. During this period, however, the shipyard outperformed other northern European shipyards, most of which were closed.Footnote 77 The explanation for the yard's survival was closely related to the perspective of its key decision maker. Like his father, Mærsk Mc-Kinney Møller was a patient owner, endorsing the search for a new market and strategy. This patience was possible due to the strong position of the expanding and diversified conglomerate of Maersk.Footnote 78
National Responsiveness
From the mid-1980s to the early 2000s, what has been termed “the global breakthrough of export-oriented Danish corporations” occurred.Footnote 79 In response to the new business opportunities following from economic globalization and European economic integration, several large Danish corporations shifted from home-market to international orientation. Their very rapid expansion also reflected a general internationalization of the Danish economy at the time. A few exceptions from the internationalization trend were observed within mainly Danish retail and agricultural products, where a few large companies continued to have “a domestic orientation and exploitation of small but protected home markets.”Footnote 80
In the shipbuilding sector, the two shipbuilding cycles in the 1970s and 1980s appeared as one long and deep crisis. Japan remained a productivity leader, and South Korea continued to benefit from cost leadership and global segmentation, as argued by Cho and Porter in 1986. Odense Steel Shipyard, however, successfully pursed a unique strategy. It adopted a national responsiveness strategy, which Cho and Porter had ruled out in a global industry. The yard relied entirely on the home market. In doing so, it differed fundamentally from all other major yards and most other Danish export-oriented manufacturing corporations. In its reliance on the home market, the yard also differed from its owners, the Maersk shipping companies and the Maersk oil and gas company. During this period, the parent companies expanded globally.Footnote 81
The starting point for Odense Steel Shipyard's new, unique strategy was very problematic. In Europe, only German wages exceeded those paid in Denmark, while South Korean wages were significantly below Danish levels. Danish shipbuilding also lagged behind in terms of labor productivity.Footnote 82 In 1985, Mærsk Mc-Kinney Møller engaged McKinsey, an international consulting firm, to assess the competitive position of the yard. The consultants concluded that “South Korea, Taiwan and the medium-sized Japanese yards retain a significant cost advantage.”Footnote 83 Although it was among the most efficient European yards, Odense Steel Shipyard still lagged approximately 14 to 17 percent behind its Asian competitors in terms of productivity. Moreover, Odense Steel Shipyard was disadvantaged on material and equipment costs, which constituted about 60 percent of total shipbuilding costs at the time.Footnote 84 Marine equipment sourced in Europe was more costly than similar items from Asia. According to McKinsey, Odense Steel Shipyard focused on “complex standard vessels,” but held no competitive advantage. The yard “has won only one true ‘open’ market bid in almost a decade.”Footnote 85 In order to close the productivity gap, major investments were required, and the consultants doubted that any satisfactory returns on investment could ever be generated.
Despite the McKinsey advice, Mærsk Mc-Kinney Møller kept faith in the yard and the Maersk companies lobbied for a so-called Shipbuilding Package, which the Danish Parliament agreed to in August 1986.Footnote 86 The package provided cheaper ship finance by transferring an inflation risk to the government and extending an attractive loan scheme.Footnote 87 Subsequently, McKinsey made a new assessment for the Maersk companies. The consultants concluded that the package reduced costs by 8 to 13 percent. However, they advised an “honorable yard closure,” since the package had not fundamentally altered the situation for the yard.Footnote 88
Mærsk Mc-Kinney Møller, however, held a different and broader perspective on shipyard competitiveness. He focused on the potential indirect benefits to the Maersk shipping companies, which now fully dictated the development of the shipyard. Henceforth, the yard relied almost entirely on the home market, in the form of orders from Maersk Line. In the mid-1980s, Maersk Line embarked on a global expansion program into the top league of container shipping. During the 1990s and the early and mid-2000s, annual growth rates in global container shipping markets fluctuated around 10 percent, and in this rapidly growing market, Maersk Line expanded even faster.Footnote 89 The company achieved such a scale that it could fill Odense Steel Shipyard's order books for more than two decades. No other shipping line or major yard owner was able to do this.
Maersk Line could fill the order books, and Mærsk Mc-Kinney Møller accepted prices above world market levels. In a board meeting in 1986, Mærsk Mc-Kinney Møller said that, when placing new orders,
If you consider the prices for the new-buildings, they are high—too high—seen in relation to the price levels elsewhere. Yet the yard makes a loss. . . . The ambition must now be to increase efficiency in order to close the gap with world leading yards.Footnote 90
The ambition was to raise productivity and build ships at world market prices, while making a modest profit. However, Mærsk Mc-Kinney Møller accepted higher prices in Odense. In a later interview, Kurt Andersen, shipyard manager in the 1990s, said,
The yard received a premium—of that I am sure—compared to world market prices, because it could deliver exactly what the shipping company wanted and keep secret the information about the ships until they entered service.Footnote 91
The yard delivered container ships with innovative designs to Maersk Line from 1988 to 2009. In 1988, it set a new capacity standard for container ships that could sail through the locks of the Panama Canal (called Panamax), and in the 1990s and 2000s, it pushed the boundaries of container ship size and design further. The vertical integration between shipping company and shipyard was seen as a major advantage for Maersk Line, because the shipyard could provide commercial secrecy for longer than other yards. Through close and unique cooperation between the commercial and technical departments in Maersk Line and the shipyard, innovative ship designs and information on vessel capacities and the size of Maersk Line's new build program were concealed from competing lines. The owner saw innovative ship designs and the potential for lower costs per transported container on large vessels as important competitiveness factors for Maersk Line, and the yard could provide this advantage. It was also a global first when Odense Steel Shipyard delivered a double-hulled very large crude carrier to Maersk's tanker shipping business in 1992, but container ships remained the main product until 2009.Footnote 92
Although Mærsk Mc-Kinney Møller disregarded McKinsey's advice, he shared the firm's focus on productivity. In this regard, Odense Steel Shipyard found inspiration in Japan. In 1982 a close technology partnership with Japanese shipbuilder Hitachi Zosen was initiated, and Mærsk Mc-Kinney Møller was strongly involved. In his eyes, the Japanese were “industrially better and more hard working” than Danes and Hitachi held a remarkable lead in terms of advanced computer systems (i.e., CAD/CAM systems).Footnote 93 During the 1980s and 1990s, process innovation was highly prioritized. In 1989, Odense Steel Shipyard launched a five-year plan for investments of approximately DKK 590 million, with further investments of DKK 500 million following in the mid-1990s. Moreover, it initiated an R&D collaboration with the University of Odense regarding welding robots.Footnote 94 Results were promising and around the year 2000, Odense Steel Shipyard's management regarded the yard as a global leader in shipbuilding automation technologies.Footnote 95 This view was widely shared in the global shipping community.Footnote 96 The yard made a profit every year through the 1990s, with an annual result ranging from DKK 43 million in 1994 to a high of DKK 119 million in 1997.Footnote 97
Wage levels remained a key concern, but the breakup of the Communist bloc provided new cost-cutting opportunities in this regard. From 1994 to 1998, the Maersk Group acquired three shipyards in the new Baltic states of Estonia and Lithuania and in the former German Democratic Republic, thus gaining access to qualified and relatively cheap labor. While the German yard built complete small and medium-sized vessels, the Baltic yards served as suppliers, building hull sections for assembly in Odense.Footnote 98
Demise
In the early 2000s, Odense Steel Shipyard continued to build high-quality container ships for its sole customer, Maersk Line. The shipping world responded with awe when the Emma Maersk, another record-breaking container ship, was delivered in 2006. Lloyd's List, the leading shipping newspaper, noted that “Maersk has smashed the world record with a new container ship that is at least 10% larger than anything else on the high seas.”Footnote 99
However, new competitive pressures had emerged, in particular from South Korea and China, and the national responsiveness strategy could not conceal these pressures. Danish wages exceeded the South Korean and Chinese levels, and the use of Eastern European subsidiaries and automation technologies could not fully compensate for this disadvantage.Footnote 100 In 2002, Choong-Hooy Cho, former president of South Korean shipbuilder Hyundai Heavy Industries, acted as a consultant for the management at Odense Steel Shipyard.Footnote 101 He found a problem in the company culture: “The problem is not the high wages, but the fact that workers are not working hard enough and become too bureaucratic and demanding in terms of equipment, machinery etc.”Footnote 102 According to Cho, Asian yard workers ran, while Danes walked. Another challenge related to the yard's procurement costs. In the 1970s and 1980s, Odense Steel Shipyard had been among the top twenty largest yards; however, by the early 2000s numerous Asian yards outsized Odense Steel Shipyard. Therefore, the Danish yard did not enjoy the same bargaining power when negotiating prices with steel mills and engine and marine equipment manufacturers.Footnote 103
After 2000, government support still played an important role in the global shipbuilding industry, but arguments for government support weakened, as European shipyard employment decreased. In 2002, a Danish government report showed how yard employment had dropped from eight thousand to four thousand between 1996 and 2001 despite annual support of between DKK 553 and 772 million. Further government support was not recommended.Footnote 104
At the same time, a fundamentally new perception of shipyard competitiveness emerged in the Maersk Group, as new managers took over. In the twentieth century, the top management of the Maersk Group was remarkably stable. For almost nine decades, A. P. Møller and Mærsk Mc-Kinney Møller remained the only top executives. In 1993, however, a shift away from family leadership had started, when Jess Søderberg was appointed CEO of the Maersk shipping companies. Ten years later, Mærsk Mc-Kinney Møller handed over the chairmanship of the board of the A.P. Moller-Maersk Group, as the Maersk shipping companies were now known, to Michael Pram Rasmussen. In 2007 a new group CEO, Niels Smedegaard Andersen, was appointed. For decades, the group had expanded into a diversified conglomerate, but from the early 2000s the new group management reversed the trend, focusing increasingly on container shipping, oil and gas exploration, drilling, container terminals, and tanker and offshore shipping. While maintaining a conglomerate ambition, A.P. Moller-Maersk divested from some of the unrelated businesses in manufacturing, IT, and aviation in this period.Footnote 105 In this respect, it followed general developments among conglomerates, already observed elsewhere in the 1980s and 1990s.Footnote 106 These decisions were also in line with the management literature on “core competences,” which had already gained international popularity a decade earlier.Footnote 107
The new Maersk Group management held a different view on shipyard competitiveness, while still relying on advice from Mærsk Mc-Kinney Møller. They focused on the direct results of the shipyard, instead of its indirect benefits to the shipping companies. They saw the yard as an isolated profit center and focused on return on investment, and they were concerned about escalating losses from 2004 onward.Footnote 108 The losses, which occurred during a global shipbuilding boom, reflected a reduced willingness in the group to pay premium prices for the ships from Odense Steel Shipyard. Despite efficiency improvements, productivity remained significantly below the aspiration of the owner.Footnote 109 Odense Steel Shipyard's innovative ship designs and commercial secrecy were no longer sufficient arguments for Maersk Line orders. The container-shipping market had become commoditized and Maersk Line's focus was on reducing unit costs and ship prices. In October 2006 the board of directors informed yard management that no further orders were to be expected from Maersk Line, and in February 2007 six container ships already ordered by Maersk Line were canceled.Footnote 110
The owner of Odense Steel Shipyard had been patient during earlier shipbuilding crises and proved to be so again in the early 2000s. Although the yard was irrelevant to Maersk Line after 2006, the group management encouraged yard management to find new customers for the yard outside the group. Now pursuing a global differentiation strategy, the yard gained orders for bulk carriers from Greek owners and for roll-on/roll-off ships from Hong Kong and U.K. owners (Figures 1 and 2). However, orders were loss making, despite the fact that they were made at the peak of the shipbuilding cycle.Footnote 111 The search for external customers proved futile, as the 2008 financial crisis caused a substantial decrease in global shipbuilding demand. For more than nine decades the Maersk shipping companies had dictated the development of Odense Steel Shipyard. When the group could no longer see any benefits from the yard, its unique position disappeared. The decision to exit shipbuilding was made by the group's management with the consent of Mærsk Mc-Kinney Møller in August 2009 and announced immediately.Footnote 112 Remaining orders were finished between 2009 and 2012. The 2008 shipbuilding crisis catalyzed the closure decision, but the fundamental reason lay in the group management's new perspectives on shipyard competitiveness. The combination of conditions that had allowed the yard to compete successfully with a unique strategy from the 1980s to the early 2000s was no longer present.
Conclusion
All companies need to adapt strategically to changes in their environments, but the key question is how to do so. Thirty years ago, in an influential study of the dynamics of competition in global industries, Cho and Porter showed how shipyards have adapted global strategies in response to changes in their environments. They demonstrated a clear relationship between the location of shipyards and appropriate global strategies at different points in time. Yards would first compete on cost leadership and subsequently adopt global segmentation or differentiation strategies. Protected market strategies, based on government support, belonged to the last development stage, before yards were closed. This study of Odense Steel Shipyard has challenged Cho and Porter's observations, showing greater diversity in possible global strategies. It has also documented more room for human agency in relation to competitiveness than Cho and Porter's study would have led us to expect.
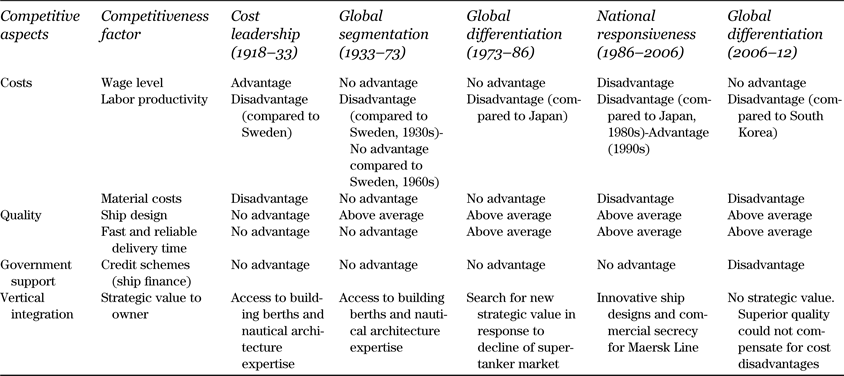
From 1918 to the early 1980s, the Odense Steel Shipyard followed a trajectory from cost leadership over global segmentation to global differentiation—one that resembled Cho and Porter's analysis (Table 2). However, from the mid-1980s, the yard successfully applied a national responsiveness strategy, which Cho and Porter had ruled out in a global industry. They argued that ships are homogenous and mobile products that can be sourced globally and therefore saw national responsiveness as impossible. However, Mærsk Mc-Kinney Møller, the key decision maker at Odense Steel Shipyard, did not see ships as homogenous products, but rather believed strongly in differentiated ship designs. For two decades, the yard catered almost entirely to the special needs of Maersk Line, which expanded so rapidly that it could fill the order books. Despite disadvantages of location and strong global competitive pressures, Odense Steel Shipyard became a unique company in shipbuilding in the last two decades of the twentieth and the early twenty-first centuries. It also differed fundamentally from other Danish corporations that experienced a breakthrough in global exports during the same time. A combination of market conditions in container shipping and the yard owner's distinctive views on competitiveness allowed Odense Steel Shipyard to shape competitiveness in a unique way and counteract the broader forces of global competition for two decades.
Competitiveness of Odense Steel Shipyard, 1918–2012

Source: Authors’ compilation of article's findings.
The concept of competitiveness itself is a historical notion. What constitutes a competitive shipyard in the view of key decision makers changed over time. The mixed fortunes of Odense Steel Shipyard cannot be understood separately from owner priorities. Though fundamentally challenged during the major shipbuilding crisis of the twentieth century, the yard managed to adapt with the help of A. P. Møller and Mærsk Mc-Kinney Møller. A. P. Møller's use of his Norwegian network allowed the yard to gain orders during the difficult interwar years, even though it was not a technological leader. In the early twenty-first century, when the yard mastered advanced production technology and built unique ships, the group management adopted a profit-center logic. The yard could not deliver an acceptable return on investment and lost its relevance to the group from 2006. It closed in 2012.
Such conclusions have broader implications for strategic management. Unorthodox responses to global competition demonstrate a greater diversity of effective strategies than strategic management literature predicts. Odense Steel Shipyard's successful national responsiveness strategy shows that appropriate strategy in a globally competitive industry does not depend only on a firm's location and its ability to adapt to external changes. An owner's views on competitiveness can also shape strategies effectively and influence their appropriateness. While shedding new light on such strategic diversity, business history can temper the use of overarching global strategic management theories.