

Ruminal acidosis is one of the most common nutritional disorders in feedlot and dairy cattle, and its economic impact is estimated to be $US 500–1000 million annually (Stone, Reference Stone1999). High-producing dairy cows require large amounts of high-energy feeds to meet nutritional requirements for maintenance, milk synthesis and reproduction. These energy requirements are often met by increasing dietary non-fibre carbohydrates (NFC) which are mainly starch (Van Soest et al. Reference Van Soest, Robertson and Lewis1991). Starch is broken down by α-amylases and the resulting glucose is rapidly fermented by rumen bacteria increasing the production of VFA and occasionally lactate, thereby increasing the risk of rumen acidosis. Acarbose is an inhibitor of α-amylase and glucosidase that slows the rate of degradation of starch to glucose, subsequently reducing the rate of VFA production and maintaining rumen pH. In studies testing the effect of acarbose on rumen fermentation in vitro, acarbose increased pH and decreased lactate concentration in the media (Speight & Harmon, Reference Speight and Harmon2005; Speight et al. Reference Speight, Harmon and Tricarico2007). These authors hypothesized that acarbose could prevent ruminal acidosis and also increase the amount of starch flowing to the intestine. Recently, McLaughlin et al. (Reference McLaughlin, Thompson, Greenwood, Sherington and Bruce2009) tested the effect of acarbose in an acute-acidosis challenge model with steers and reported that acarbose controlled ruminal acute acidosis by modulating the rate of production of VFA and lactate. The objective of the present experiment was to study the effects of acarbose in preventing ruminal acidosis in lactating cows fed a high-NFC ration.
Materials and Methods
Animals and their treatments
Eight lactating Holstein dairy cows fitted with rumen cannulas (milk yield, 24·3±2·35 kg/d; body weight, 622±54 kg; days in milk, 183±67; 5 multiparous and 3 primiparous) were used over a 2-month period. All cows were kept at the experimental research farm of the Institut de Recerca i Tecnologia Agroalimentàries (Girona, Spain) in loose-housing conditions evenly distributed in two symmetrical pens. Cows were on straw bedding (replaced every 2 d) and were milked with an automatic milking system (AMS, VMS, DeLaval, Tumba, Sweden). Animals were maintained and handled under the supervision of the Animal Care Committee of the Institut de Recerca i Tecnologia Agroalimentàries.
The experiment was conducted following a cross-over design with two 28-d periods and two treatments. Treatments were a partial mixed ration (PMR) with no additive (CTR) or with 0·75 g acarbose-premix/cow per day (AMI), assuming a PMR daily intake of 20 kg/cow. Acarbose premix contained 10% of acarbose (Glucobay™, Bayer, Wuppertal, Germany) on a soya bean hull carrier. All cows were fed ad libitum, received the same concentrate at the AMS, and were fed the PMR twice daily at 9·00 and 17·00. Ingredient and nutrient composition of PMR and concentrate are shown in Table 1.
Ingredient and nutrient composition of the experimental diet

Measurements and sample collection
Individual feed consumption was continuously monitored throughout the study using a computerized system (Bach et al. Reference Bach, Iglesias and Busto2004). Fresh feed offered and refusal samples were collected daily and analysed for dry matter (DM) to determine DM intake (DMI). PMR samples were taken biweekly and analysed for chemical composition [DM, crude protein (CP), neutral detergent fibre (NDF), acid detergent fibre (ADF), ether extract and ash]. Individual milk production was recorded daily and milk composition biweekly. Blood was sampled to determine glucose, insulin and urea concentrations within the first hour after the morning feed on two separate days in each period (days 14 and 28). Blood was centrifuged at 1500 g at 7°C for 10 min obtain serum. Serum samples were stored at −20°C until subsequent analysis. Samples of ruminal contents were collected during 3 d (days 26, 27 and 28) in each treatment at 0, 4 and 8 h after the morning feed. Ruminal fluid was strained through two layers of cheesecloth, and four subsamples of filtrate were taken for the determination of VFA, lactate, ammonia N, enumeration of protozoa, and DNA extraction for quantitative real time PCR (qPCR) of Streptococcus bovis and Megasphaera elsdenii. Rumen pH was recorded electronically at 22-min intervals during the last 6 d of each period (from day 23 to day 28) in each treatment, using a pH meter (X-Mate Pro MX 300, Mettler-Toledo, Barcelona, Spain) as described by Bach et al. (Reference Bach, Iglesias and Devant2007).
Chemical analyses
Feed DM was determined by oven drying at 105° C for 24 h (AOAC, 1990; ID 950·01) and ash content by heating at 550°C for 4 h (AOAC, 1990; ID 942·05). Dietary NDF and ADF contents were analysed by the detergent system, using the sequential procedure described by Van Soest et al. (Reference Van Soest, Robertson and Lewis1991), with sodium sulphite, a thermostable amylase, and correcting for ash.
Enzymic determination of serum glucose and urea were conducted following the HK/G-6-PDH method (Burrin & Price, Reference Burrin and Price1985) and the urease-GLDH method (Gutmann & Bergmeyer, Reference Gutmann and Bergmeyer1974), respectively. Serum insulin was determined using ELISA (Mercodia, Uppsala, Sweden).
Samples for determination of volatile fatty acids (VFA) and lactate were prepared as described by Jouany (Reference Jouany1982). Total and individual VFA were analysed by GC (model 6890, Hewlett Packard, Palo Alto CA, USA) using polyethylene glycol nitroterephthalic acid-treated capillary column (BP21, SGE, Europe Ltd., Milton Keynes, UK) at 275°C in the injector and 29·9 ml/min gas flow rate. l-Lactate and d-lactate were analysed following the enzymic method described by Goodall & Byers (Reference Goodall and Byers1978).
Samples for determination of ammonia-N were prepared as described by Chaney & Marbach (Reference Chaney and Marbach1962) and the supernatant analysed by spectrophotometry (Libra S21, Biochrom Analytical Instruments, Cambridge, UK).
For enumeration of protozoa, 1 ml of filtered rumen fluid was mixed with 9 ml of methyl green:formaldehyde (38% w/w) solution. Entodiniomorphs and holotrichs were identified (Dehority, Reference Dehority1993) and counted as described by Veira et al. (Reference Veira, Ivan and Jui1983) using a Neubauer Improved Bright-Line counting chamber (Hauser Scientific Partnership, Horsham PA, USA). Protozoa counts were transformed to a base 10 logarithm before statistical analysis.
For DNA extraction, rumen fluid samples were aliquoted in sterile eppendorfs of 1·5 m and frozen at −20°C. DNA from rumen fluid was extracted by physical disruption using a bead-beating method (Mini-Beater; Biospec Products, Bartlesville OK, USA) following the protocol described by Whitford et al. (Reference Whitford, Forster, Beard, Gong and Teather1998) with modifications proposed by Blanch et al. (Reference Blanch, Calsamiglia and Castelló2007). Rumen fluid (0·6 ml) was mixed with an equal volume of pH-8·0 buffered phenol (USB® 75829, Cleveland OH, USA) in a 2-ml tube with 0·5 g of 0·1-mm glass beads (Biospec Products, Inc., Ref. 11079101, Bartlesville OK, USA). After adding 40 μl of 10% SDS (Sodium dodecyl sulphate, Sigma® L4522, St. Louis MO, USA) the tubes were shaken three times for 2 min on a Mini-Beater (BioSpec Products Bartlesville, OK). The tubes were placed on ice for 2 min between each bead-beating step, and then spun at 11 600 g for 5 min in a microfuge. The aqueous phase was transferred to a new tube, extracted with buffered phenol and precipitated with ethanol. Samples were suspended in 100 μl of TE 0·5X and treated with RNase (2 μl RNAse A, 10 mg/ml, 1 h at 37°C) (RNase A, Roche® 0109169000, Sant Cugat del Vallès, Barcelona), re-extracted with phenol, precipitated with ethanol and suspended in 50–200 μl of TE 0·5X. DNA concentration was measured by spectrophotometry (NanoDrop®ND-1000 Spectophotometer, Nanodrop Technologies, Wilmington DE, USA). DNA obtained was stored at −20°C in aliquots of 20 ng/μl (stock).
Primers and probes used in this study for qPCR analyses are listed in Table 2. Str. bovis specific primers and a probe to amplify a fragment of 84 bp were previously designed (Blanch et al. Reference Blanch, Calsamiglia and Castelló2007) from 16S ribosomal RNA sequence available in the Genebank database (AY442813), using the Primer Express™ Software (Applied Biosystems, Warrington, UK). For Meg. elsdenii, previously published primers specific for a 129-bp fragment of the 16S ribosomal RNA (Ouwerkerk et al. Reference Ouwerkerk, Klieve and Forster2002) were chosen to accomplish specific amplification, while a specific Taqman probe was designed with Primer Express Software (Blanch et al. Reference Blanch, Calsamiglia and Castelló2007). All samples were run in triplicate for standard curve points or in duplicate for ruminal samples in a 20-μl reaction volume containing 1× TaqMan Universal PCR Master Mix (Applied Biosystems, Warrington, UK) primers at a final concentration of 900 nm each, 250 nm probe, and 100 ng of genomic DNA (5 μl of ruminal fluid samples at 20 ng/μl). PCR was run in the ABI PRISM® 7900 HT Sequence Detection System (Applied Biosystems, Warrington, UK) using optical grade 96 well-plates using the following amplification parameters: 2 min 50°C, 10 min at 95°C, and 40 cycles of 15 s at 95°C and 1 min at 60°C. Reactions without DNA were always used as negative controls in each run.
Primers, Taqman probes-MGB, and PCR conditions used in the study

Statistical analyses
DMI, eating behaviour parameters (eating rate and time spent eating) and milk yield data were summarized by week. For blood metabolites (insulin, glucose and urea) the average within animal and period was used for the analyses. For rumen data (VFA, ammonia-N, qPCR and protozoa counts) the average among days (days 26, 27 and 28) at each sampling time within animal and treatment was used for the analyses. For rumen pH, the average within animal and treatment of each day was used for the analyses. All statistical analyses were conducted using PROC MIXED of SAS (SAS Inst., Inc., Cary NC, USA, version 8.2). Period and animal entered the models as random effects in all analyses. Degrees of freedom were corrected by Satterth's optimization. The statistical model included treatment, sequence in the cross-over, stage of lactation, time, parity, and the interactions of treatment with parity and treatment with stage of lactation (the last one only if it was significant). The stage of lactation of each cow was classified as a 4-class ordinal variable using the quartiles of the days in milk (DIM) distribution as cut-offs when the interaction treatment by stage of lactation was significant. DMI, behaviour parameters, milk yield and all rumen data were analysed using PROC MIXED for repeated measures (Little et al. Reference Littell, Henry and Ammerman1998); the variance-covariance structure with the minimum Bayes information criteria was chosen for each variable.
Results and Discussion
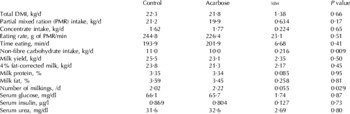
There were no interactions between main factors, therefore only main effects are discussed. Total, PMR and concentrate intakes, and milk yield were not affected by treatment (Table 3). Some authors (Vedula et al. Reference Vedula, Schnitzer-Polokoff and Tulp1991; Ramirez, Reference Ramirez1992) report a negative effect of acarbose on DMI in rats, in a dose-dependent manner (the negative effect was observed when more than 100 mg acarbose/kg diet was administrated) and it was hypothesised that the presence of incompletely digested food in the digestive tract could inhibit feed intake. No differences in blood metabolites (glucose, insulin and urea) were observed between treatments (Table 3), indicating that AMI did not affect blood metabolism within the first hour after the morning feed.
Least squares means of dry matter intake (DMI), eating behaviour, milk yield, milk composition, number of milkings and blood parameters as affected by acarbose supplementation

The hypothetical mechanism of action of acarbose is the prolonging of starch digestion, decreasing starch digestion in the rumen, and increasing the amount of starch digested in the intestine (Speight & Harmon, Reference Speight and Harmon2005; Speight et al. Reference Speight, Harmon and Tricarico2007). Therefore, if a lesser amount of starch is digested in the rumen of animals receiving acarbose, then a decrease in VFA production in the rumen might be expected. McLaughlin et al. (Reference McLaughlin, Thompson, Greenwood, Sherington and Bruce2009) observed a decrease of total VFA and lactate concentrations in animals treated with acarbose compared with control in an acute-acidosis challenge experiment in cattle. In the current experiment, acarbose increased average ruminal pH and decreased the number of hours for which pH was <5·6 compared with control (Table 4). The diurnal changes in ruminal pH over a 24-h period day are presented in Fig. 1. Ruminal pH was greater in the AMI cows for approximately 4 h after fresh feed was offered in the morning. However, no changes in lactate, total VFA concentration or VFA profile were observed between treatments in the current experiment. Perhaps the lack of difference in total VFA concentration between treatments could be due to an insufficient sampling frequency. Ruminal fluid samples for VFA analyses were taken at 0, 4 and 8 h after feeding, whereas ruminal pH was recorded at 22-min intervals for six consecutive days. Observed changes in rumen pH, in addition to potentially reflecting an effect of acarbose on rumen fermentation, could also be due in part to a lower NFC intake in the AMI (10·0±0·22 kg/d) than in the CTR (11±0·22 kg/d) cows (Table 3).
Evolution of ruminal pH during the day in control (CTR) and acarbose group (AMI): (- - -) time of feeding, (*) P<0·05, (†) P<0·10.

Least squares means of volatile fatty acids (VFA), lactate, ammonia-N, and ruminal pH as affected by acarbose supplementation

† Measured at 0, 4 and 8 hours after feeding
‡ Measured at 22-min intervals
The Str. bovis to Meg. elsdenii ratio tended (P=0·09) to be lower in AMI compared with CTR (Table 5); nevertheless no changes in ruminal lactate concentration were observed. Additionally, rumen entodiniomorphs and holotrichus counts tended (P=0·12 and P=0·06, respectively) to be lower in AMI compared with CTR (Table 5). Protozoa engulf starch very rapidly (Williams & Coleman, Reference Williams and Coleman1988) and compete with amylolytic bacteria for their substrate (Newbold et al. Reference Newbold, Williams and Chamberlain1987; Owens et al. Reference Owens, Secrist, Hill and Gill1998); thus a decrease in protozoa numbers is usually considered as a risk factor for rumen acidosis as more starch is available for fermentation by rumen bacteria. However, the current study indicates that rumen pH did not decrease despite the fact that protozoa numbers were lowered when acarbose was supplemented, and thus it would appear that acarbose effectively limited the availability of starch to ruminal bacteria as well.
Effect of acarbose supplementation on rumen microbial profile of rumen fluid

In conclusion, the decrease in the number of hours below rumen pH 5·6 and the increase in the average rumen pH in the cows that received an α-amylase inhibitor indicated that acarbose could reduce the number of hours spent at suboptimal rumen pH in dairy cattle fed a high-NFC diet.
The authors thank Pfizer Animal Health for financial support to conduct this study.