Introduction
The whitefly, Bemisia tabaci (Gennadius) (Hemiptera: Aleyrodidae), is a globally distributed cryptic species complex (De Barro and Ahmed, Reference De Barro and Ahmed2011; De Barro et al., Reference De Barro, Liu, Boykin and Dinsdale2011; Dinsdale et al., Reference Dinsdale, Cook, Riginos, Buckley and De Barro2010). A number of the species in the complex are known to damage commercially important plant species either through direct feeding (Li et al., Reference Li, Xue, Ahmed, Ren, Du, Wu, Cuthbertson and Qiu2011; Oliveira et al., Reference Oliveira, Henneberry and Anderson2001) or through the transmission of plant viruses (Brown et al., Reference Brown, Zerbini, Navas-Castillo, Moriones, Ramos-Sobrinho, Silva, Fiallo-Olivé, Briddon, Hernández-Zepeda, Idris, Malathi, Martin, Rivera-Bustamante, Ueda and Varsani2015; Czosnek et al., Reference Czosnek, Ghanim, Morin, Rubinstein, Fridman and Zeidan2001; Gautam et al., Reference Gautam, Mugerwa, Buck, Dutta, Coolong, Adkins and Srinivasan2022; Rosell et al., Reference Rosell, Bedford, Frohlich, Gill, Brown and Markham1997). As there are no morphological characters with which to distinguish the different members of the Bemisia complex (Rosell et al., Reference Rosell, Bedford, Frohlich, Gill, Brown and Markham1997), their identities have been determined primarily through the use of the mitochondrial cytochrome oxidase I (mtCOI) gene (Boykin et al., Reference Boykin, Armstrong, Kubatko and De Barro2012; Boykin and De Barro, Reference Boykin and De Barro2014; De Barro et al., Reference De Barro, Liu, Boykin and Dinsdale2011).
Most members of the Bemisia complex have well-defined phylogeographical distributions and are regarded as indigenous to the geographic areas from which they have been recorded (Boykin et al., Reference Boykin, Bell, Evans, Small and De Barro2013; Dinsdale et al., Reference Dinsdale, Cook, Riginos, Buckley and De Barro2010). However, two, Middle East-Asia Minor 1 (hereon MEAM1 or biotype B in the older literature) and Mediterranean (hereon MED or biotypes Q, J, or L in the older literature), are highly invasive and have now been recorded from a large number of countries across Africa, Asia, Europe, and the New World. According to the previous studies, MEAM1 likely originated in the region of the Middle East, Asia Minor, and Central Asia (De Barro and Ahmed, Reference De Barro and Ahmed2011; De Barro et al., Reference De Barro, Driver, Naumann, Schmidt, Clarke and Curran2000; Frohlich et al., Reference Frohlich, Torres-Jerez, Bedford, Markham and Brown1999), and after invading, MEAM1 spreads rapidly and displaces indigenous members of the complex (Liu et al., Reference Liu, De Barro, Xu, Luan, Zang, Ruan and Wan2007). MEAM1 is defined by high fecundity, broad host range, ability to induce physiological changes in some species, and capacity to develop resistance to insecticides (Liu et al., Reference Liu, De Barro, Xu, Luan, Zang, Ruan and Wan2007). While adult B. tabaci, including cryptic species MEAM1 and Mediterranean, can be spread considerable distances by wind (Byrne et al., Reference Byrne, Rathman, Orum and Palumbo1996), most long-distance global spread is through the trade in live plant material (Dalton, Reference Dalton2006).
There at least 42 species in the complex (Dinsdale et al., Reference Dinsdale, Cook, Riginos, Buckley and De Barro2010; Hu et al., Reference Hu, De Barro, Zhao, Wang, Nardi and Liu2011; Kanakala and Ghanim, Reference Kanakala and Ghanim2019; Mugerwa et al., Reference Mugerwa, Seal, Wang, Patel, Kabaalu, Omongo, Alicai, Tairo, Ndunguru, Sseruwagi and Colvin2018; Naga et al., Reference Naga, Siddappa, Kumar, Tiwari, Subhash, Verma, Buckseth, Bairwa, Sharma, Katare, Srivastava, Bansode, Sarkar and Patel2021; Whiteflybase, 2016), and 28 of these including MEAM1 and MED can be found in Asia (Boykin et al., Reference Boykin, Bell, Evans, Small and De Barro2013; De Barro and Ahmed, Reference De Barro and Ahmed2011; Dinsdale et al., Reference Dinsdale, Cook, Riginos, Buckley and De Barro2010; Hu et al., Reference Hu, De Barro, Zhao, Wang, Nardi and Liu2011; Liu et al., Reference Liu, De Barro, Xu, Luan, Zang, Ruan and Wan2007; Whiteflybase, 2016). Bemisia tabaci was first recorded in India on cotton in 1905 (Misra and Lambda, Reference Misra and Lambda1926), and MEAM1 was first identified in the southern region of India in 1999 (Banks et al., Reference Banks, Colvin, Reddy, Maruthi, Muniyappa, Venkatesh, Kumar, Padmaja, Beitia and Seal2001). Its introduction was considered an invasion and an emerging threat to Indian agriculture (Rekha et al., Reference Rekha, Maruthi, Muniyappa and Colvin2005). In the past 20 years, there has been considerable interest in the diversity of the Bemisia complex in India, but effort has not been applied evenly across the country. Most studies involved sampling small parts of India, and there has been no attempt to cross correlate records or review their accuracy (Banks et al., Reference Banks, Colvin, Reddy, Maruthi, Muniyappa, Venkatesh, Kumar, Padmaja, Beitia and Seal2001; Brown and Idris, Reference Brown and Idris2005; Chaubey et al., Reference Chaubey, Andrew, Naveen, Rajagopal, Ahmad and Ramamurthy2015; Chowda-Reddy et al., Reference Chowda-Reddy, Kirankumar, Seal, Muniyappa, Valand, Govindappa and Colvin2012; Ellango et al., Reference Ellango, Asokan and Mahmood2014, Reference Ellango, Singh, Raina, Priya, Raina, Chaubey, Naveen, Mahmood, Ramamurthy, Asokan and Rajagopal2015; Firdaus et al., Reference Firdaus, Vosman, Hidayati, Supena, Visser and Van Heusden2013; Frohlich et al., Reference Frohlich, Torres-Jerez, Bedford, Markham and Brown1999; Gupta et al., Reference Gupta, Sharma, Rakesh, Jindal and Dilawari2008; Lisha et al., Reference Lisha, Antony, Palaniswami and Henneberry2003; Maruthi et al., Reference Maruthi, Colvin, Thwaites, Banks, Gibson and Seal2004; Prasanna et al., Reference Prasanna, Kanakala, Archana, Jyothsna, Varma and Malathi2015; Qiu et al., Reference Qiu, Coats, Ren, Dris, Xu and Brown2007; Rana et al., Reference Rana, Singh, Priya, Kumar and Rajagopal2012; Roopa et al., Reference Roopa, Asokan, Rebijith, Hande, Mahmood and Kumar2015; Shankarappa et al., Reference Shankarappa, Ranpaswamy, Narayana, Rekha, Raghavendra, Reddy, Chancellor and Maruthi2007; Singh et al., Reference Singh, Priya, Kumar, Rana, Ellango, Joshi, Priyadarshini, Asokan and Rajagopal2012). As part of our study, we have combined new survey data with existing records from past surveys and additional unpublished records from GenBank to present an integrated account of the Indian B. tabaci complex diversity. For our analyses, we have chosen not to include studies that used methods other than mtCOI as they are both few in number and have no means of verification through accession records; we have though kept the data relating to records of occurrence. The mtCOI gene has already been widely used to study the haplotypes frequency, diversity, and geographical distribution for both native and non-native populations of other invertebrate species (Ahmed et al., Reference Ahmed, De Barro, Greeff, Ren, Naveed and Qiu2011, Reference Ahmed, De Barro, Olleka, Ren, Mandour, Greeff and Qiu2012; Bock et al., Reference Bock, Zhan, Lejeusne, Macisaac and Cristescu2011; De Barro and Ahmed, Reference De Barro and Ahmed2011; García-Merchán et al., Reference García-Merchán, Robainas-Barcia, Abelló, Macpherson, Palero, García-Rodríguez, De Sola and Pascual2012; Geller et al., Reference Geller, Darling and Carlton2010; Goldstien et al., Reference Goldstien, Dupont, Viard, Hallas, Nishikawa, Schiel, Gemmell and Bishop2011; Lejeusne et al., Reference Lejeusne, Bock, Therriault, Macisaac and Cristescu2011; Lejeusne and Chevaldonné, Reference Lejeusne and Chevaldonné2006; Lejeusne et al., Reference Lejeusne, Saunier, Petit, Béguer, Otani, Carlton, Rico and Green2014; Mackie et al., Reference Mackie, Darling and Geller2012; Reuschel et al., Reference Reuschel, Cuesta and Schubart2010).
India is the seventh-largest country in the world and third-largest in Asia. Of its land surface area, 60.5% is used for agriculture which contributes 14% to GDP and employs 50% of the workforce. India is a major exporter of cut and loose flowers and globally 30% of the land used for ornamental crops is found in India (Plasmeijer and Yanai, Reference Plasmeijer and Yanai2012; Van-Rijswick, Reference Van-Rijswick2015). Most of the stock material for production is sourced domestically from across India (FAO). Given invasive B. tabaci are readily redistributed through the live plant trade, the widespread distribution of sources of plant propagation across India suggests numerous pathways for pest redistribution exist. In this study, we assessed the diversity of the B. tabaci complex across India and in particular focused on the diversity and distribution of MEAM1. Given MEAM1 was first detected in India in 1999, one would expect that by now it would be well represented and distributed across the country as similar patterns of spread have been observed in other large countries, Australia (Liu et al., Reference Liu, De Barro, Xu, Luan, Zang, Ruan and Wan2007), China (Hu et al., Reference Hu, De Barro, Zhao, Wang, Nardi and Liu2011; Li et al., Reference Li, Guo, Ren, De Barro and Qiu2014), and the USA (Dickey et al., Reference Dickey, Osborne, Shatters, Hall and Mckenzie2013; Mckenzie et al., Reference Mckenzie, Bethke, Byrne, Chamberlin, Dennehy, Dickey, Gilrein, Hall, Ludwig, Oetting, Osborne, Schmale and Shatters2012), all of which also have substantial ornamental industries. We also compared the level of genetic diversity of MEAM1 in India with the diversity reported across the home and invaded ranges, particularly in Australia, China, and the USA. In addition, we analysed host plant utilisation and geographical distributions of the various Asian members of the complex.
Materials and methods
Whitefly sampling in India
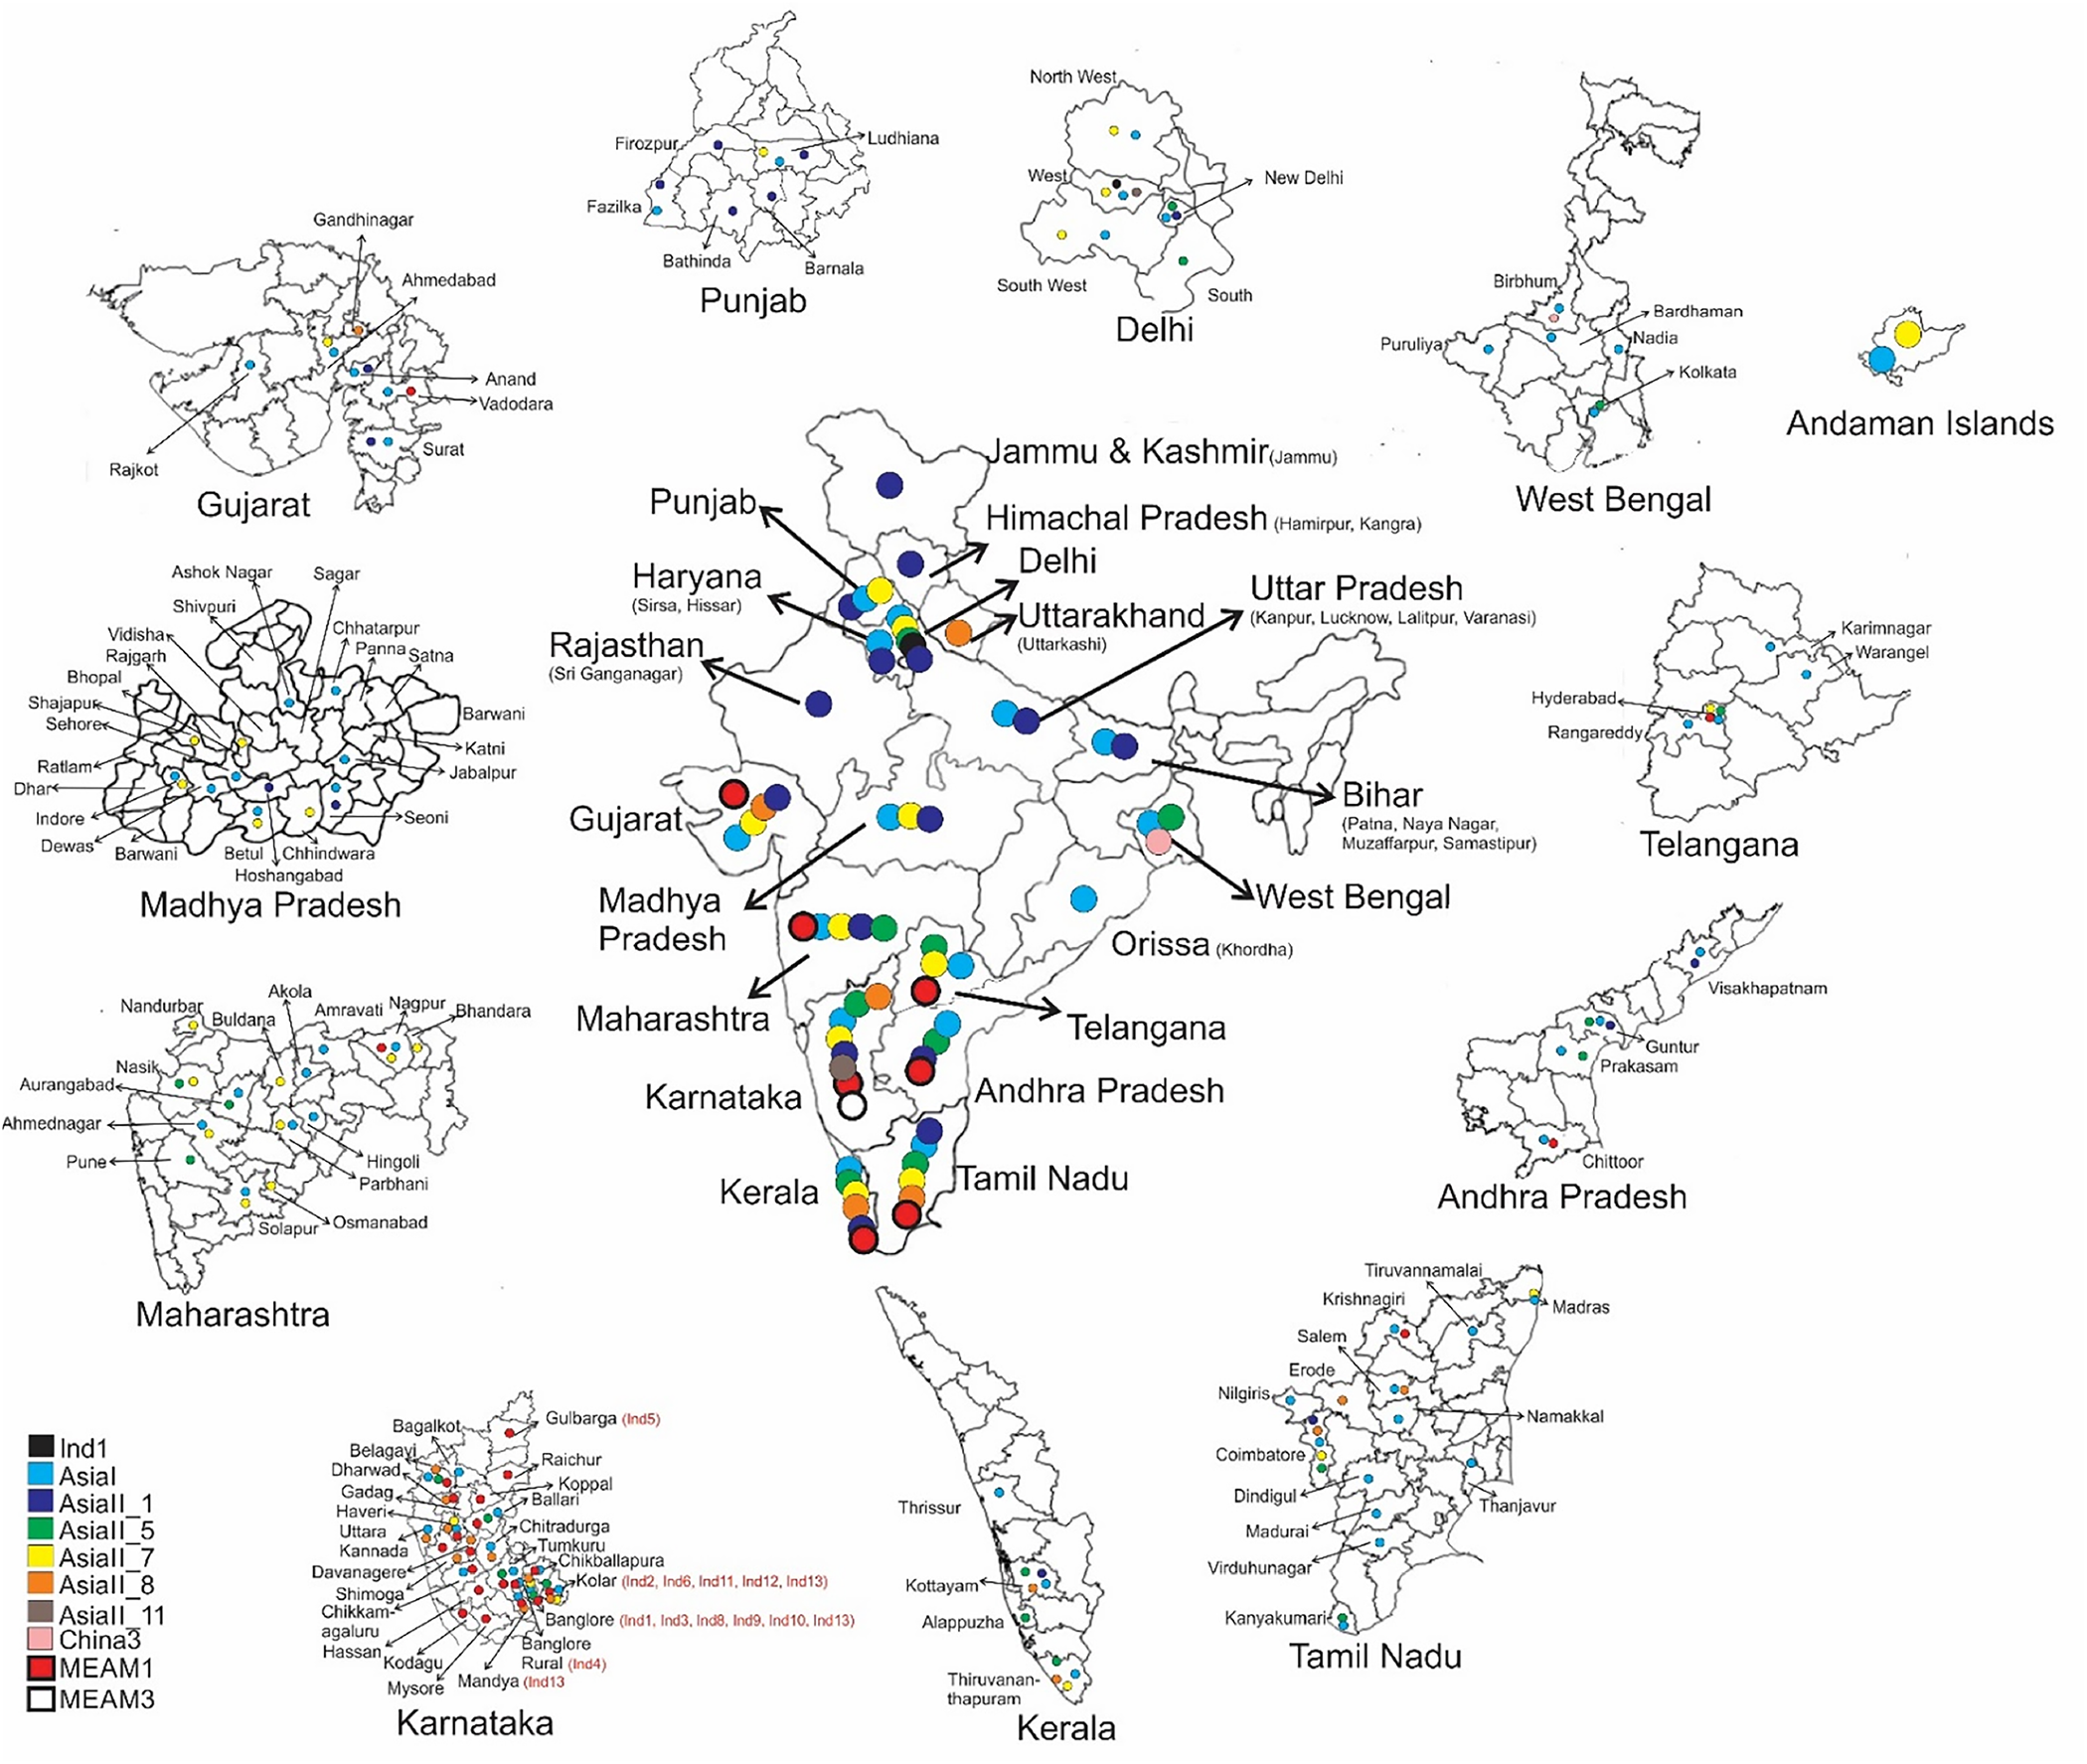
Samples were collected from March to September 2012 across four Indian states: Gujarat (representing the western part), West Bengal (representing the eastern part), Punjab (representing the northwestern part), and Karnataka (representing the southwestern part) (detail in Fig. 1, Table S1). Whiteflies were preserved in 95% ethanol. In each state, two locations were sampled. Ten adults were analysed from each location. We also surveyed all available published (including GenBank) records of B. tabaci from India. In total, 590 records were found across 20 states (Table S1). The total area represented from this combined dataset accounts for roughly 92% of India’s land area. Records used in our study came from 61 plant species across 16 plant families, from both urban and agricultural landscapes (Table 1 and S1).
Geographical distribution of members of the Bemisia tabaci cryptic species complex in India. Each state map is divided into districts. Species records are presented where such data are available. If no district-level data are available, then only the state-level distribution data are provided. Collection details are provided in Table S1. Blank world map was taken from www.freeusandworldmaps.com. The maps were adapted using CorelDRAW X6.

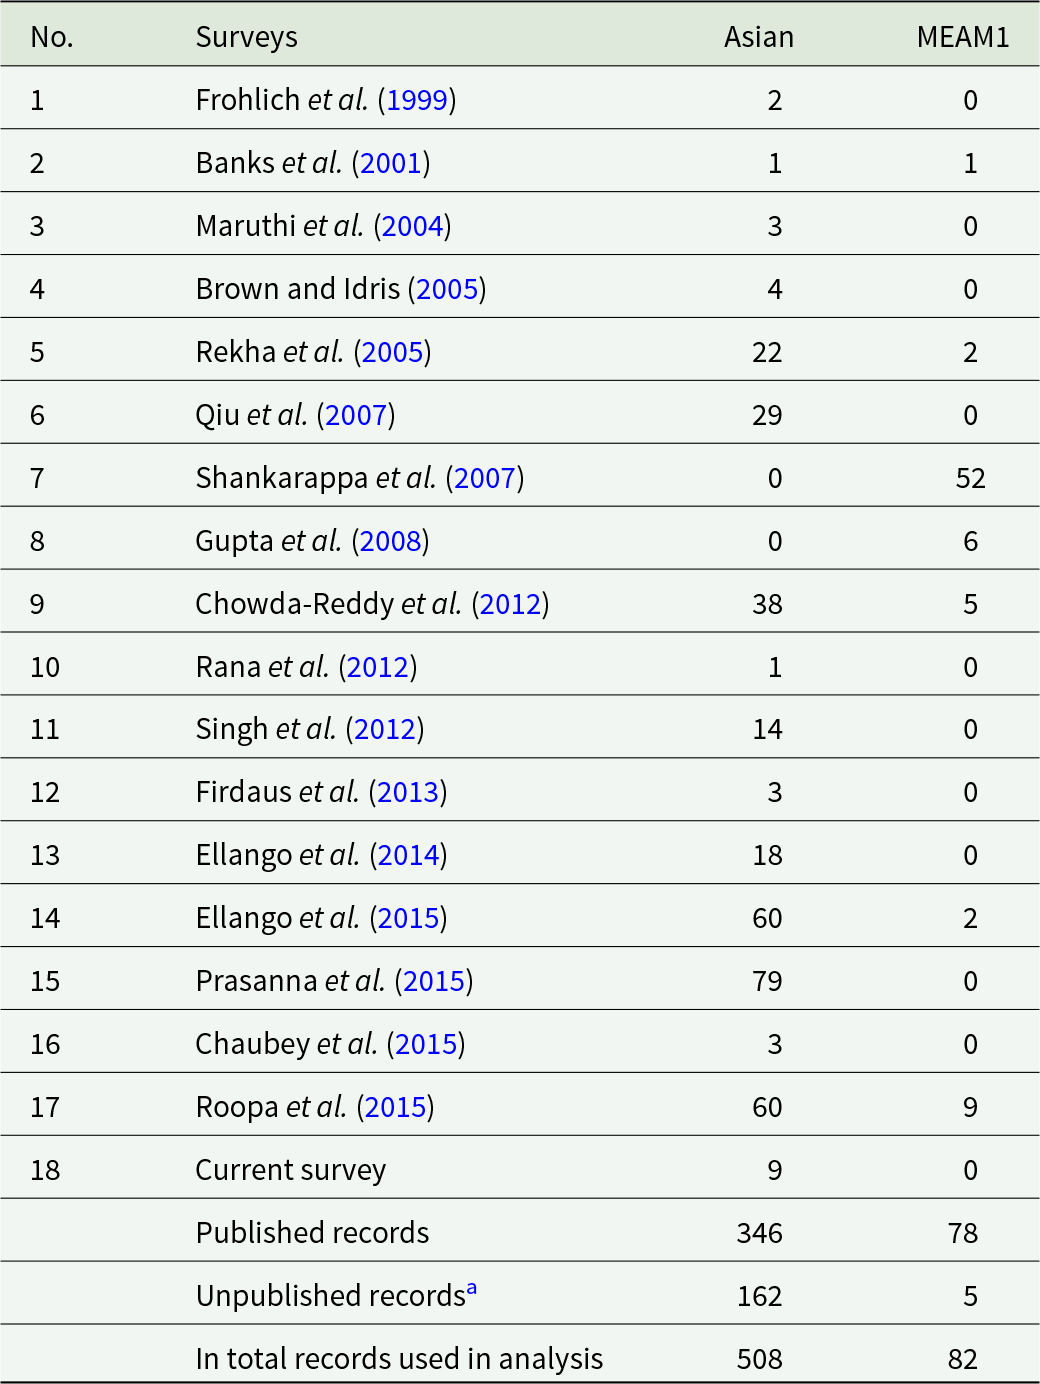
The number of Asian Bemisia tabaci species complex members (Asian) and MEAM1 records in each of 17 publications as well as new records from this study plus the additional records in GenBank which have not been published in the literature

Note: In total, there were 508 Asian and 82 MEAM1 records from India.
a Unpublished records retrieved from GenBank.
DNA extraction, PCR amplification, and sequencing
DNA was extracted, and amplification was undertaken using previously reported methodology (Ahmed et al., Reference Ahmed, De Barro, Olleka, Ren, Mandour, Greeff and Qiu2012). PCR products were separated on 1.0% agarose gels. Bands were visualised by ethidium bromide staining and viewed using ultraviolet light. The 850 bp amplicon was purified using a gel extraction kit (Qiagen, Germany) and cloned using the plasmid pTZ57R/T in the T/A cloning kit (MBI Fermentas) following manufacturer’s instructions. Clones were sequenced in both directions using universal M13 forward and reverse primers at Xcelris Labs, India. All sequences were edited for any misreads using ClustalX v.1.83 (Thompson and Quigley, Reference Thompson and Quigley1997).
mtCOI sequences from GenBank
Of the 590 records, 506 were Asian species and 84 MEAM1. Four sequences were short, between 400 and 500 bp in length. Six records used SCAR and 57 used RAPD to identify individuals. The short sequences, SCAR and RAPD records were removed from the analysis although location data was kept. The remaining mtCOI sequences were aligned using ClustalX 1.83 (Thompson and Quigley, Reference Thompson and Quigley1997). Sequences were aligned against AB204577 starting at the 5′ end with GAAAATTAGAGGTATTT and terminated at the 3′ end with TCCTTTCTTCTTCTGCGGT, a 657 bp fragment. Sequences with ambiguous bases, gaps, stop codons, or shorter than 610 bp were removed, yielding a final dataset of 523 sequences.
mtCOI haplotype network analysis of MEAM1
We used 84 MEAM1 records from India (Table S1) and all mtCOI records came from Karnataka State. There is one unpublished record in GenBank (GQ281728) from Gujarat that was identified as MEAM1. Our survey of Gujarat, West Bengal, Punjab, and Karnataka did not find any MEAM1. The remaining records of MEAM1 came from six SCARs records (Gupta et al., Reference Gupta, Sharma, Rakesh, Jindal and Dilawari2008), and 57 RAPD records (Chowda-Reddy et al., Reference Chowda-Reddy, Kirankumar, Seal, Muniyappa, Valand, Govindappa and Colvin2012) none of which have published mtCOI data (Tables S1 and S2). Unique (i.e. genetically distinct) haplotype sequences were extracted from the mtCOI alignment with DnaSP v.5.10 (Librado and Rozas, Reference Librado and Rozas2009). All Indian MEAM1 haplotypes were unique except for six records, which all belonged to the same haplotype making a total of 13 unique haplotypes (Tables S1 and S2). In addition, there were three records that belonged to an unidentified haplotype (Ind14) that was closely related to MEAM1.
A further search of GenBank plus unpublished records found 823 MEAM1 records including those from India as well as the rest of the world (Tables S2–S5). MEAM1 identity was determined using species delimitation analysis (Boykin et al., Reference Boykin, Armstrong, Kubatko and De Barro2012). Sequences were treated as above. Duplicates were removed leaving a final dataset of 108 haplotypes. The sequences were analysed by statistical parsimony using TCS v.1.21 (Clement et al., Reference Clement, Posada and Crandall2000). The network connection limit was set at 95% (Ahmed et al., Reference Ahmed, Roberts, Soto-Adames, McKenzie and Osborne2024; De Barro and Ahmed, Reference De Barro and Ahmed2011). The resulting networks identify both the relationship between the different haplotypes as well as the significant number of substitutions connecting haplotypes. The relationship between the species names used here and the former biotype terminology is detailed in Table S6.
Species delimitations and intraspecific diversity
All Indian sequences were within 2% of the derived species consensus sequences except for two which diverged by >3.5% (Boykin et al., Reference Boykin, Armstrong, Kubatko and De Barro2012). These two sequences were aligned against the global B. tabaci dataset (http://dx.doi.org/10.4225/08/50EB54B6F1042 and http://whois.domaintools.com/ white flybase.org) (Whiteflybase, 2016). We used the species delimitation plugin for Geneious to calculate Rosenberg’s reciprocal monophyly, P(AB) and Rodrigo’s (P(RD) as well as Kimura-2-Parameter using MEGA 6.0 (Boykin et al., Reference Boykin, Armstrong, Kubatko and De Barro2012; Boykin and De Barro, Reference Boykin and De Barro2014; Rodrigo et al., Reference Rodrigo, Bertels, Heled, Noder, Shearman and Tsai2008; Rosenberg, Reference Rosenberg2007). For intraspecific variation, MEGA v.6.0 (Tamura et al., Reference Tamura, Stecher, Peterson, Filipski and Kumar2013) was used to calculate the genetic diversity using the maximum composite likelihood method with nucleotide substitution (including Transitions + Transversions) of all codon positions of haplotypes within each species.
Genetic diversity
Nucleotide diversity was used to estimate the degree of variation of nucleotide sites among populations (Nei and Li, Reference Nei and Li1979). Nucleotide diversity is the average number of differences in the nucleotide sequence among individuals of a given population, compared pairwise. Haplotype diversity (Hd), nucleotide diversity (π), average number of differences in nucleotide sequence between haplotypes (k), and standard deviation were determined using DnaSP v.5.0 (Librado and Rozas, Reference Librado and Rozas2009). The haplotypes were divided into following groups (China, Egypt, Iran, India, Pakistan, Middle East, and invaded range) based on the proposed indigenous and invasive geographical ranges of MEAM1. Middle East contains 20 haplotypes [(Kuwait (4), Yemen (3), Saudi Arabia (4), Israel (5), Iraq (1), UAE (1), Jordon (1) and Syria (1)]; Invaded range contains 39 haplotypes [Argentina (1), Australia (2), Cuba (8), Dominican Republic (1), Indonesia (1), Japan (5), Malaysia (1), Morocco (2), Reunion (2), Guadeloupe (1), South Korea (1), Spain (1), Taiwan (4), Trinidad Tobago (4), Tunisia (2) and USA (3)]; China contains 18; India 13; Iran 5; Egypt 3; and Pakistan 10 haplotypes. The genetic diversities of these groups were estimated and compared with each other using ANOVA (SAS v.9.00). In addition to ANOVA, we performed an independent t-test to test the null hypothesis that nucleotide diversity of Indian and invaded countries was not significantly different.
Host plant and host geography vs Bemisia species diversity
Southern Indian states have been reported to have more species than northern states. To test whether host plants and collection location were correlated with species diversity, we used the mantel function in the ecodist package in R v.3.2.5. Geographical locations were divided into five regions: central (Madhya Pradesh); southern (Andhra Pradesh, Karnataka, Kerala, Tamil Nadu, Telangana); northern (Delhi, Haryana, Himachal Pradesh, Jammu and Kashmir, Punjab, Uttar Pradesh, Uttarakhand); western (Gujarat, Maharashtra, Rajasthan); and eastern (Bihar, West Bengal, Orissa, Andaman Islands). Host plants were divided into 16 families (Asteraceae, Acanthaceae, Apiaceae, Brassicaceae, Cleomaceae, Convolvulaceae, Cucurbitaceae, Euphorbiaceae, Fabaceae, Malvaceae, Moraceae, Musaceae, Lamiaceae, Pedaliaceae, Solanaceae, and Verbenaceae). Five families (Apiaceae, Acanthaceae, Cleomaceae, and Lamiaceae, Pedaliaceae) were excluded from the analysis because they were each represented by only one record. Whitefly diversity was the set of B. tabaci species identified by our analysis.
Number of records surveyed vs number of species reported
The records used in our study do not represent even sampling across India, and this could lead to a bias in species detection towards greater sampling effort. To test whether survey effort across either geographic location or host species influenced species detection, we performed a Spearman’s correlation analysis.
Global dataset of MEAM1 from invasive regions (Australia, China, and USA)
In addition to Indian samples, we also included MEAM1 from three similarly large countries where MEAM1 has invaded. Records came from published studies and GenBank. Our USA dataset contained 137 sequences from 15 states (Alabama, Arizona, California, Delaware, Florida, Georgia, Indiana, Michigan, Nevada, Oregon, Pennsylvania, South Carolina, Texas, and Virginia) collected between 1988 and 2015 (Table S3); 154 from 22 provinces of China (Anhui, Beijing, Fujian, Guangdong, Guangxi, Guiyang, Hainan, Hebei, Hong Kong, Hubei, Hunan, Jiangsu, Macau, Shaanxi, Shanghai, Shanxi, Xinjiang, Yunnan, and Zhejiang) collected between 2003 and –2015 (Table S4); and 132 from New South Wales, Northern Territory, Queensland, South Australia, and Western Australia in Australia collected between 1995 and 2011 (Table S5). We analysed the geographical ranges and genetic diversities to trace the prevalence of shared and unique haplotypes.
Results
Number of cryptic species of B. tabaci in India
We recovered eight species previously described from India (Asia1, AsiaII 1, AsiaII 5, AsiaII 7, AsiaII 8, AsiaII 11, China3, and MEAM1) as well as two unreported ones. One is closely related to AsiaII 1 (94.4%) and species distinctiveness analyses gave K2P > 4.5, P(RD) < 0.05 and P(AB) < 10−6, which supports species level delimitation, we named it ‘India1’. The second has MEAM1 as the closest match (94%) and species distinctiveness analyses gave K2P > 5.8, P(RD) < 0.05 and P(AB) < 10−11, which supports species level delimitation, we named it ‘Middle East-Asia Minor 3’ (MEAM3).
Ditribution of B. tabaci cryptic species in India
Of the 10 species, Asia1 and AsiaII 1 were the most widely distributed, 16 and 15 states, respectively, followed by the AsiaII 5 and AsiaII 7, were in 8 and 10 states, respectively. While AsiaII 8 was in five states, China3, India1, AsiaII 11, and MEAM3 were found in one state each. Based on mtCOI, SCAR, and RAPD data, MEAM1 was in seven states (Fig. 1, Table 1 and S1).
Misidentifications detected in earlier studies
Some records from earlier studies were misidentified, for example, the cryptic species with COI sequence in GenBank JX993215, originally identified as both Asia I and AsiaII 1, has been correctly identified as Asia1 (Ellango et al., Reference Ellango, Singh, Raina, Priya, Raina, Chaubey, Naveen, Mahmood, Ramamurthy, Asokan and Rajagopal2015). Similarly, JX993221 and JX993222 were both identified incorrectly and are now correctly identified as AsiaII 8 and Asia1, respectively (Ellango et al., Reference Ellango, Singh, Raina, Priya, Raina, Chaubey, Naveen, Mahmood, Ramamurthy, Asokan and Rajagopal2015). GQ281714, identified as a new species and named Asia1_India (Chaubey et al., Reference Chaubey, Andrew, Naveen, Rajagopal, Ahmad and Ramamurthy2015) was found to match Asia1 with >99% similarity. JN896336 was identified as AsiaII (Lisha et al., Reference Lisha, Antony, Palaniswami and Henneberry2003), our analysis correctly identifies it as AsiaII 1 (Table S1).
Correlation between cryptic species and their host plants and geographical locations
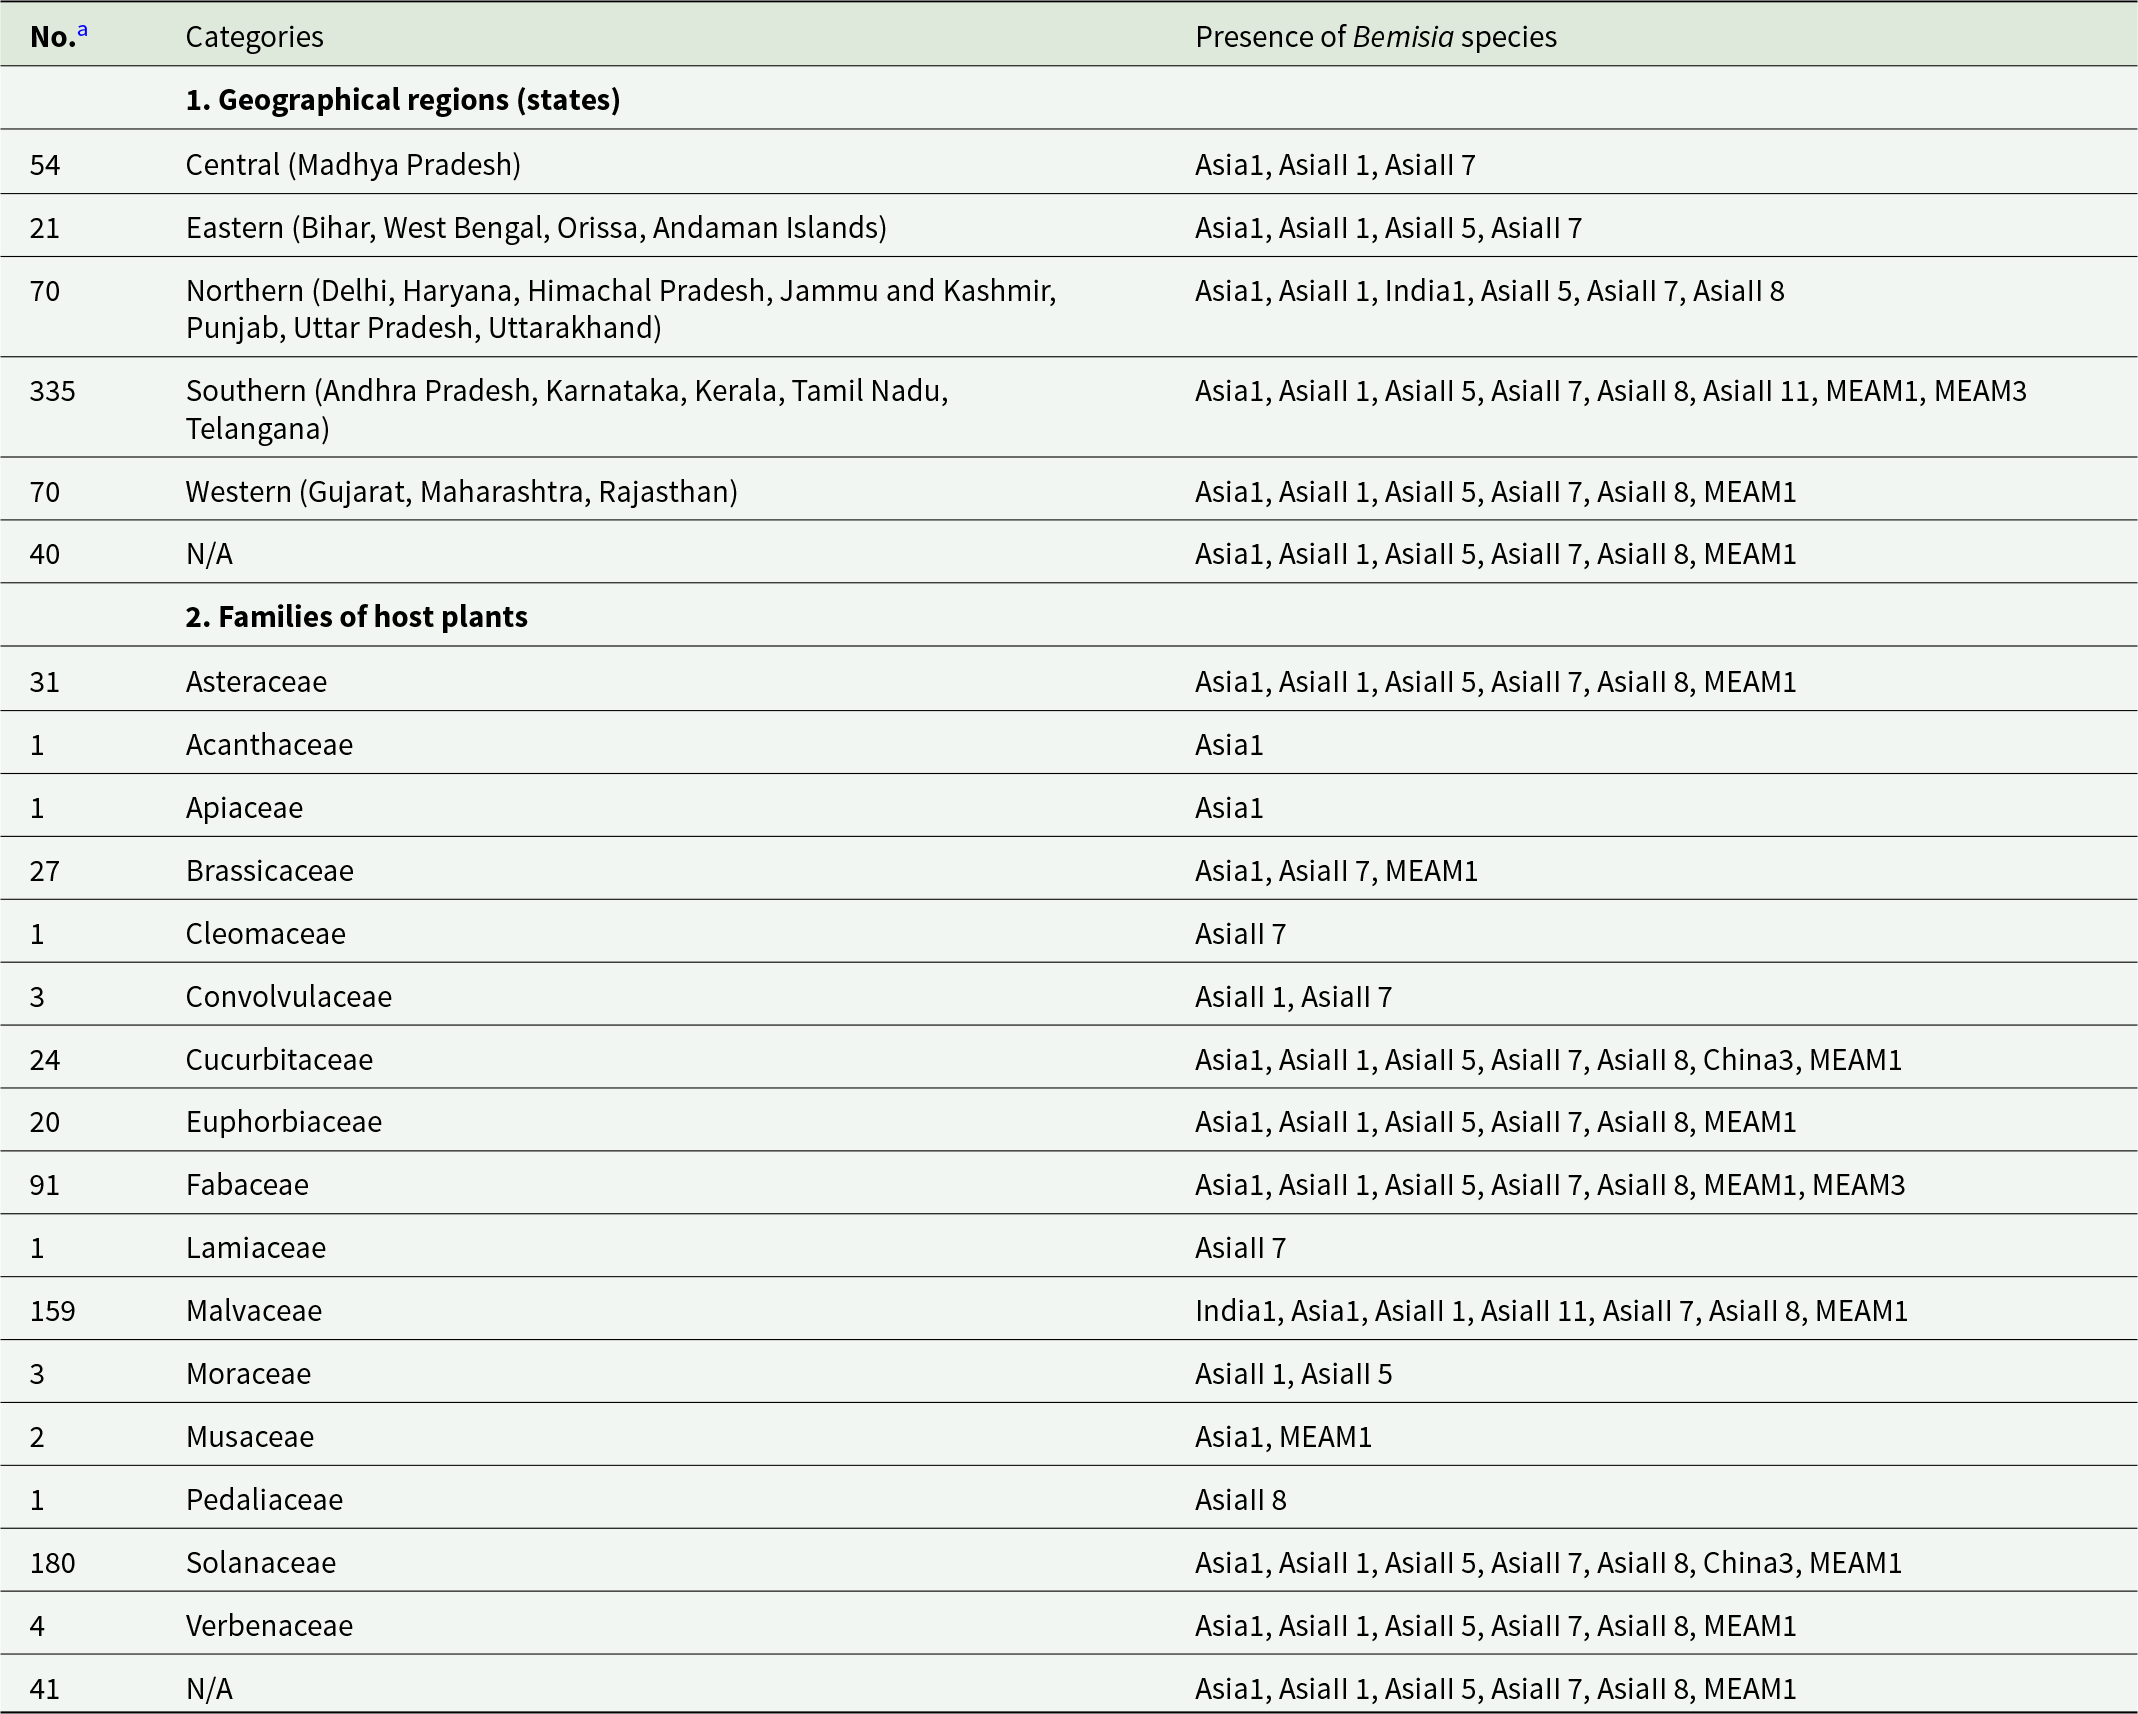
There was no correlation between host plant families and whitefly species (r = − 0.17, p = 0.08) or between host geography and host plant species (r = − 0.33, p = 0.27), suggesting that whitefly species are not restricted to geographical regions and have no association with particular plant families. This indicates that most species in our analysis are polyphagous and more than one species shares the same geographical area. There were three exceptions. China3 was recorded from only pointed gourd in West Bengal, AsiaII 11 from only cotton in Karnataka, and India1 from only cotton in Delhi. These three species are uncommon and so any assessments of distribution and host range are weak. We found that there are seven cryptic species of Bemisia in the southern region of India, the northern and western regions have six species each, while the central and eastern regions have three and four species, respectively (Table 2). Malvaceae and Solanaceae were the host families with the most species recorded (Table 2). The Spearman’s correlation analysis was positive between the number of records (an indicator of sampling effort) and the number of cryptic species identified from those records. The correlation was significant for host plant families (r = 0.78, p = 0.004), but not geographical regions (r = 0.71, p = 0.113), suggesting that the chances of finding a species increases when more species within a plant family are surveyed, regardless of geographical region. This suggests sampling bias influences findings (Table 2).
Records of different members of the Bemisia tabaci species complex in India according to geographical region and host plant family

a Total number of records.
Genetic diversity within cryptic species
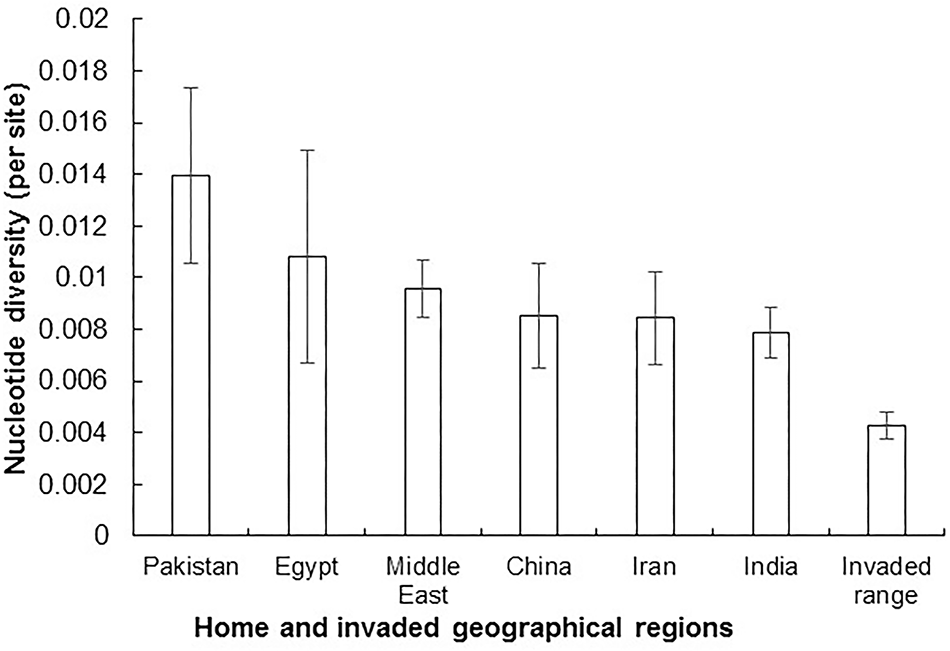
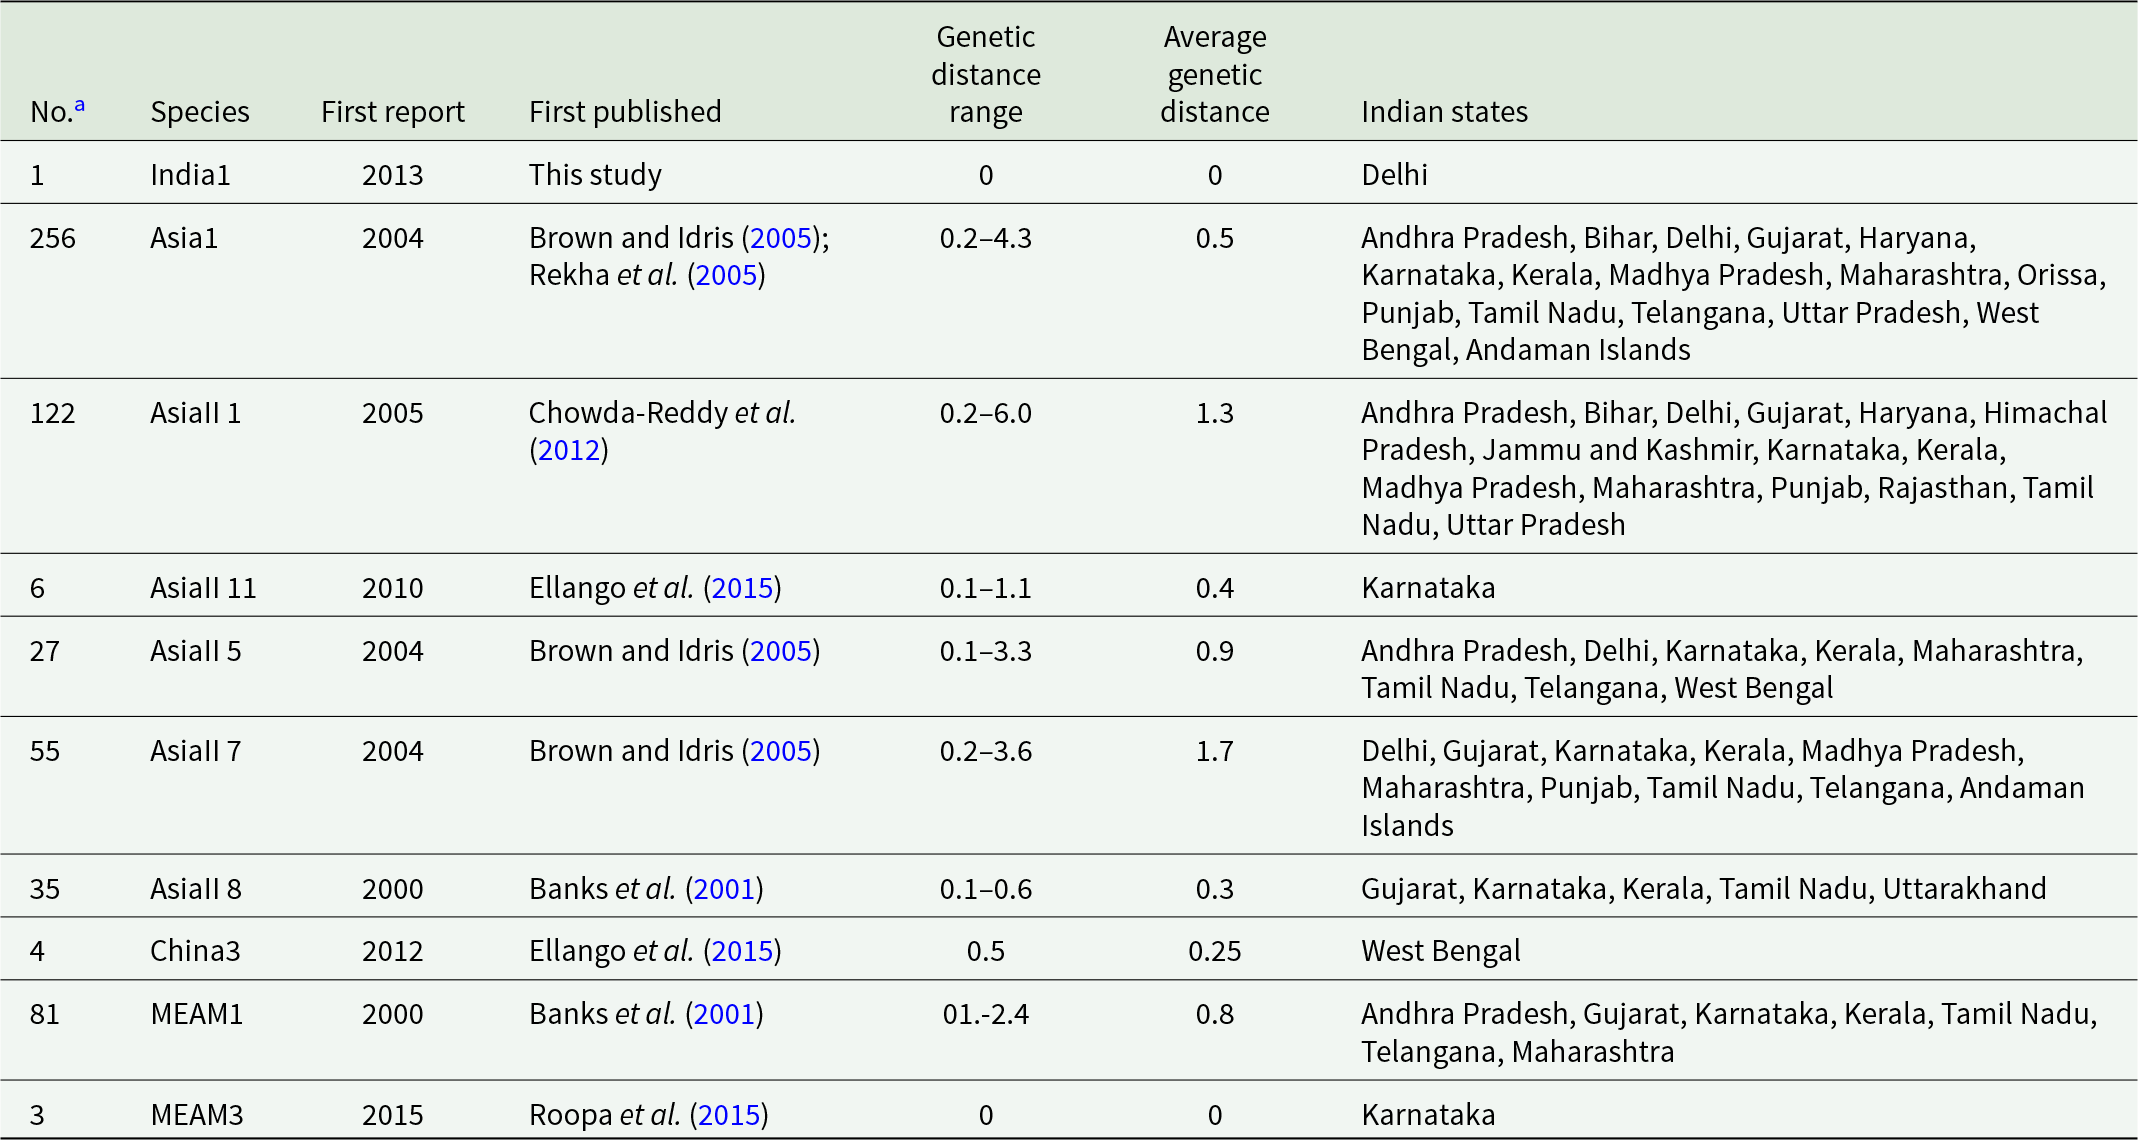
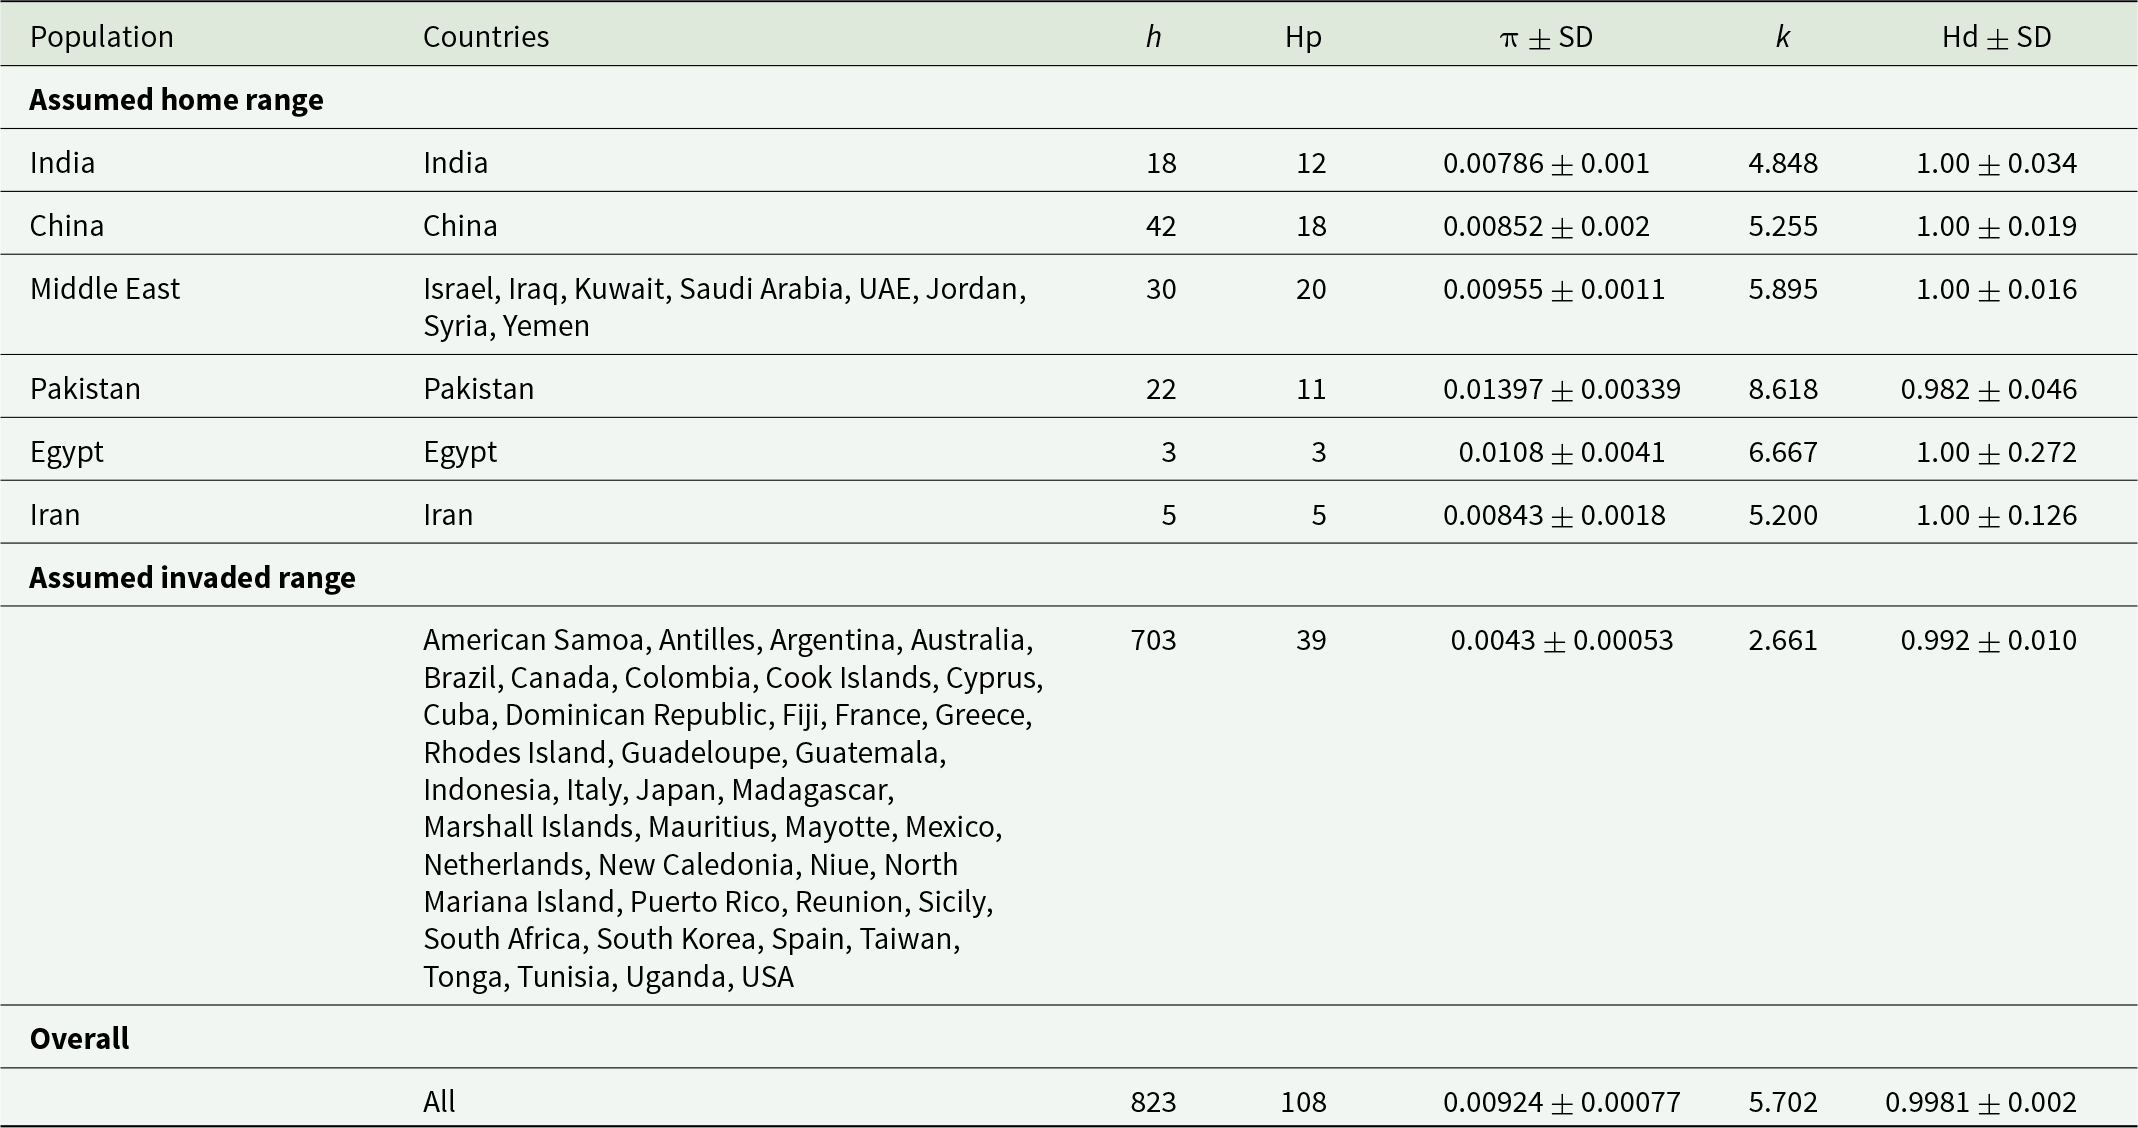
The intraspecific distances are AsiaII 7 (1.7%) > AsiaII 1 (1.3%) > AsiaII 5 (0.9%) > Asia1 (0.5%) > MEAM1 (0.8%) > AsiaI (0.5%) > AsiaII 11 (0.4%) > AsiaII 8 (0.3%) > China3 (0.25%). India1 and MEAM3 were excluded as only a single haplotype of each was recovered (Table 3). For MEAM1, the number of haplotypes records (h) ranged from 3 to 618 while the number of haplotypes per population Hp ranged from 3 to 55. Haplotype diversity (Hd) ranged from 0.800 to 0.989, and nucleotide diversity (π) ranged from 0.00711 to 0.01423. The difference in nucleotide diversity among these groups (China, Egypt, Iran, India, Pakistan, Middle East, and invaded range) was significant (F 5,112 = 7.71, p < 0.0001) (Table S7). The Pakistan haplotypes showed the most nucleotide diversity (π = 0.014 ± 0.003), followed by Egypt (0.0108 ± 0.004), Middle East (0.0095 ± 0.001), China (0.0085 ± 0.002), Iran (0.008 ± 0.001), India (0.008 ± 0.001), and then the invaded range (0.004 ± 0.0005) which showed the lowest level of diversity (Table 4, Fig. 2). The diversity in India and China was significantly higher than in the invaded range (p = 0.000) (Table 4, Fig. 2, Table S2 and Fig. S1).
The nucleotide diversities of haplotypes from the home and invaded countries of MEAM1 were calculated using sequences of mtCOI gene. Middle East contains 20 haplotypes [(Kuwait (4), Yemen (3), Saudi Arabia (4), Israel (5), Iraq (1), UAE (1), Jordon (1) and Syria (1)]; invaded range contains 39 haplotypes [Argentina (1), Australia (2), Cuba (8), Dominican Republic (1), Indonesia (1), Japan (5), Malaysia (1), Morocco (2), Reunion (2), Guadeloupe (1), South Korea (1), Spain (1), Taiwan (4), Trinidad Tobago (4), Tunisia (2), and USA (3)]; China contains 18; India 13; Iran 5; Egypt 3; and Pakistan 10 haplotypes. Error bars are standard deviations. The same lowercase letters are not significantly different (p > 0.01).

Summary of the total number of records of each species in the Bemisia tabaci complex, year of first published record, publication source, genetic distance range, average genetic distance and the Indian states in which each species has been reported

a Total number of records.
Genetic diversity parameters of MEAM1 according to the assumed home and invaded ranges as well as overall

Note: h = number of haplotype records; Hp = number of unique haplotypes; Hd = Haplotype (gene) diversity; π = Nucleotide diversity (per site), Pi; k = the average number of nucleotide differences.
MEAM1 network analysis and mtCOI haplotype frequencies
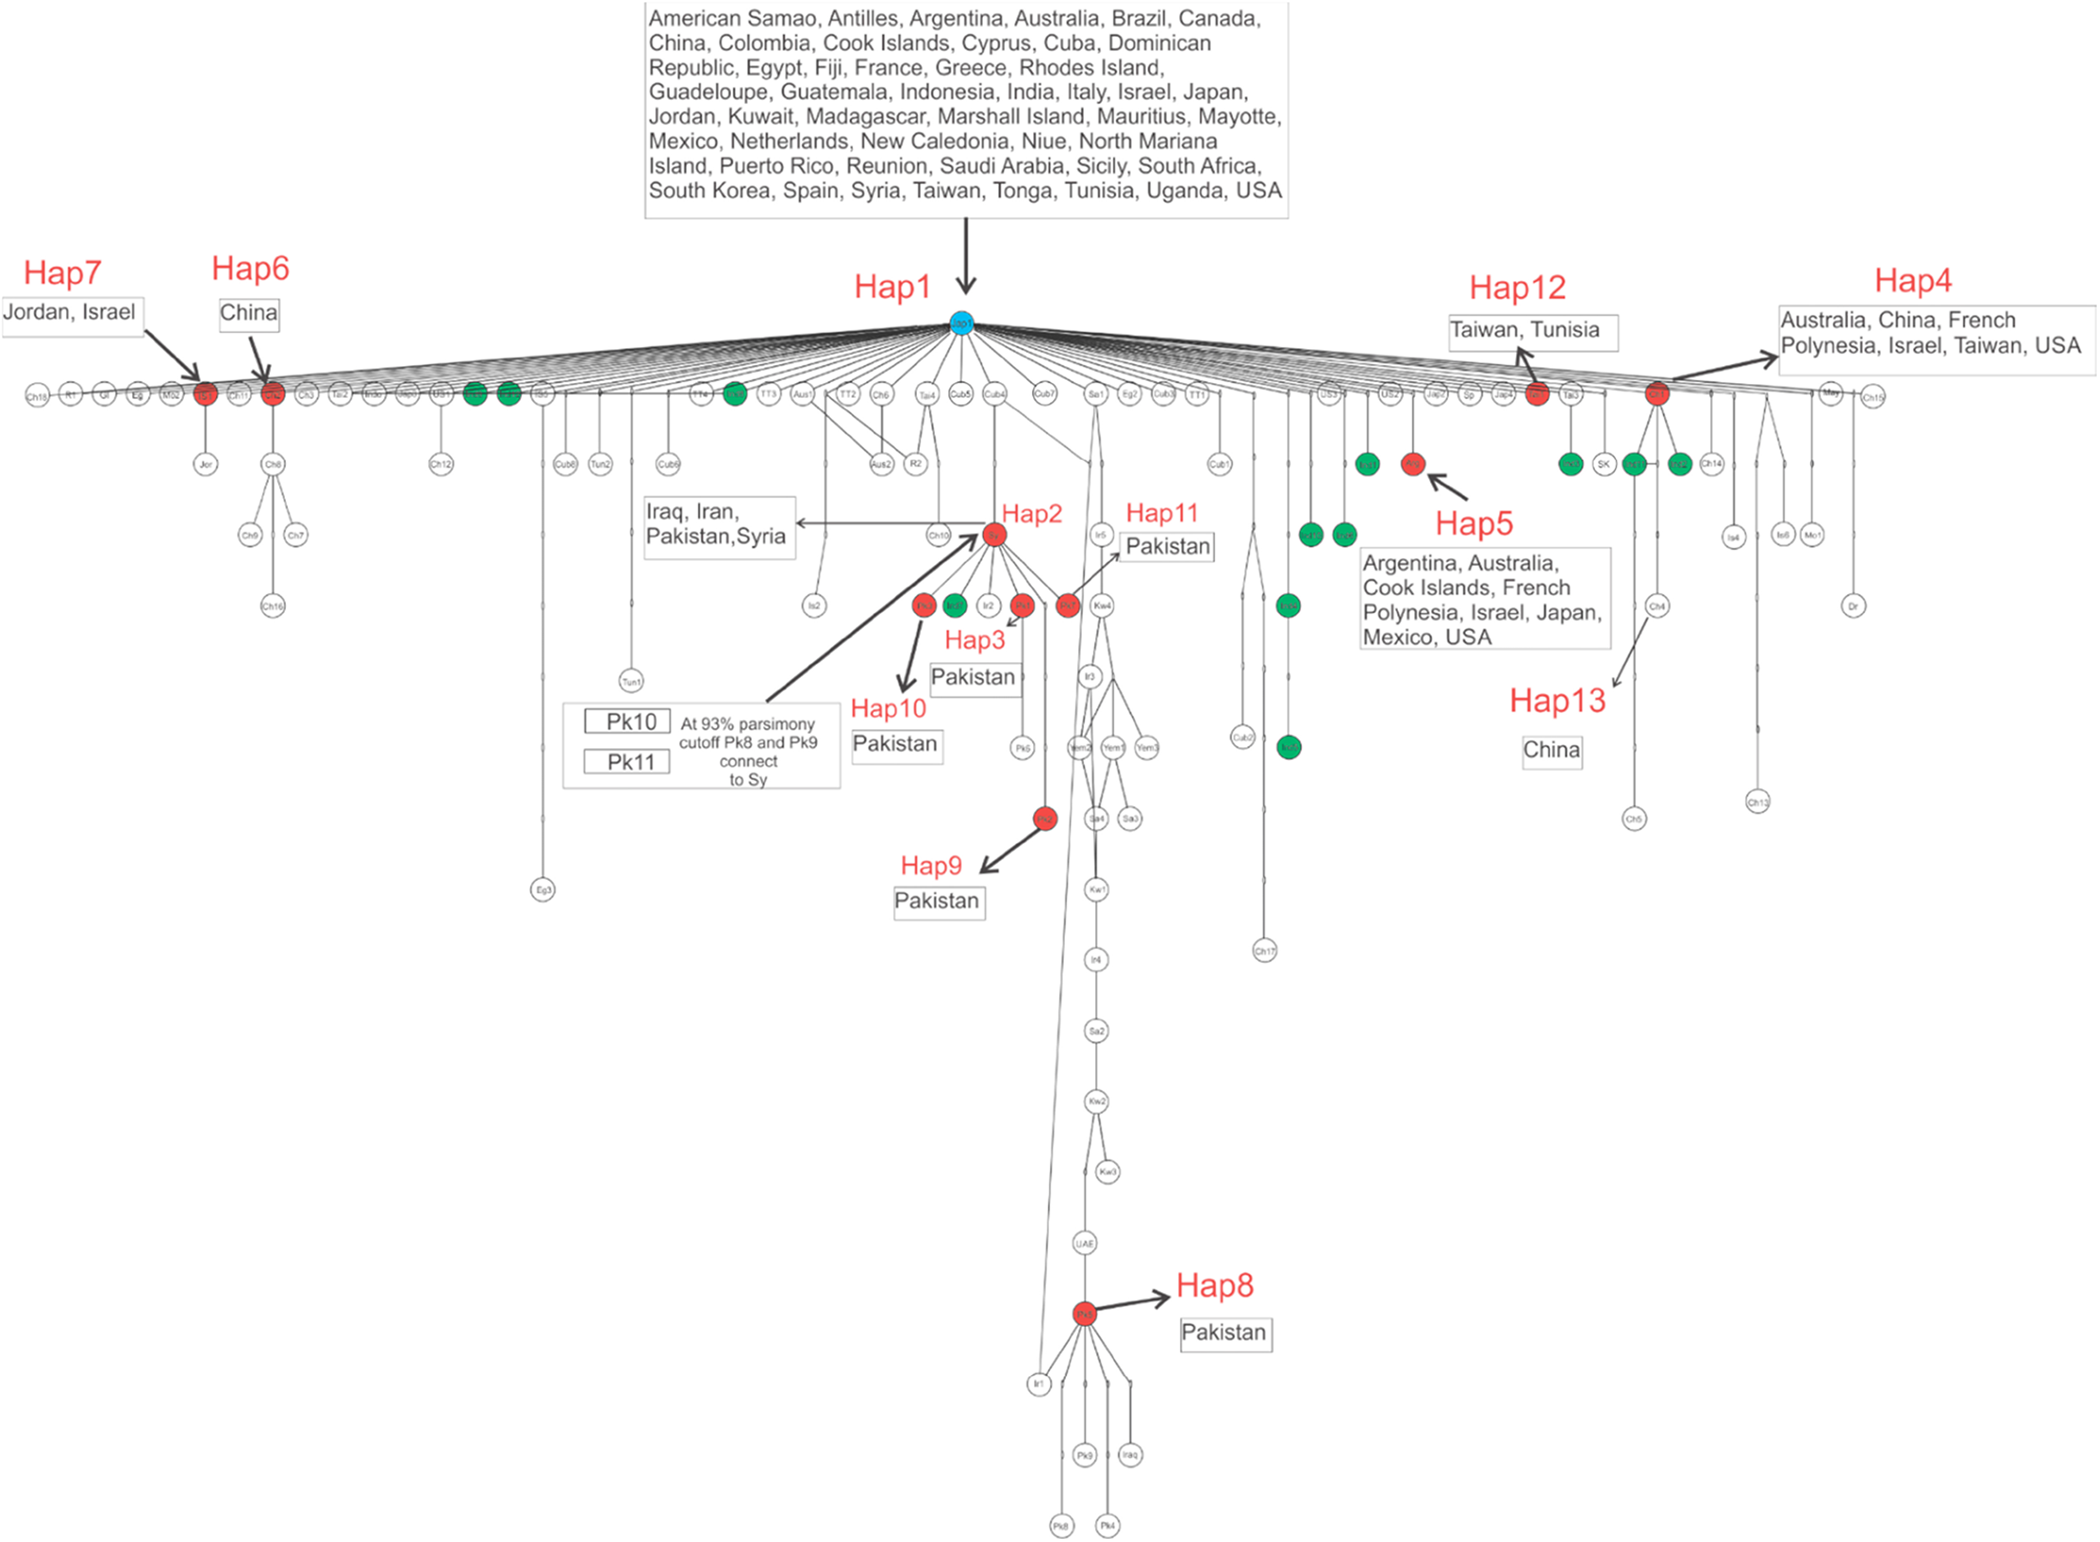
The genetic network analysis used 108 haplotypes (Fig. 3). All haplotypes were connected to each other except two from Pakistan ‘Pk10’ and ‘Pk11’ which were separated from the network at the 95% cut off value, but were connected with Hap2 at 93%. Of the haplotypes, 13, Hap1–Hap13, had at least two accession records. Of these Hap1 (e.g. AB204577) was the most frequently encountered in the invaded range (Fig. 3) accounting for 79.8% of the GenBank accessions. Hap4 (e.g. AY686063) was recorded from six countries and Hap5 (AF340215) from eight countries, 3.2% and 0.5% of accessions, respectively (Fig. 3). India had 13 haplotypes from six districts (Bangalore, Bangalore Rural, Gulbarga, Kolar, Rajanukunte, and Mandya) of two states (Karnataka and Gujarat). Of these, 12 are only from India and together represent 66.7% of the records. The 13th haplotype, Hap1 (33.3%), was found in three districts (Bangalore, Kolar, and Mandya) in the southern State of Karnataka, but nowhere else (Table S1). One Indian haplotype (Ind7) occurred in the branch containing haplotypes from the home range of MEAM1 (Iran, Iraq, Pakistan, Syria) (Fig. 3).
Genetic network based on statistical parsimony showing the relationships of the mtCOI haplotypes representing MEAM1. The name codes in the circle refer to the individual haplotypes (see Table S1 for collection details). The small circles indicate the presence of missing intermediates while the connections are based on the set of plausible solutions with a 95% of parsimony probability. Indian unique haplotypes are in green (represented by Ind1–13) and haplotypes with more than one accession record are in red (Hap1–13). The most globally invasive haplotype, Hap1, is shown by the blue circle [see Tables S1 and S2 for collection records]. The countries in which each haplotype (Hap1–13) has been recorded are shown in the boxes.

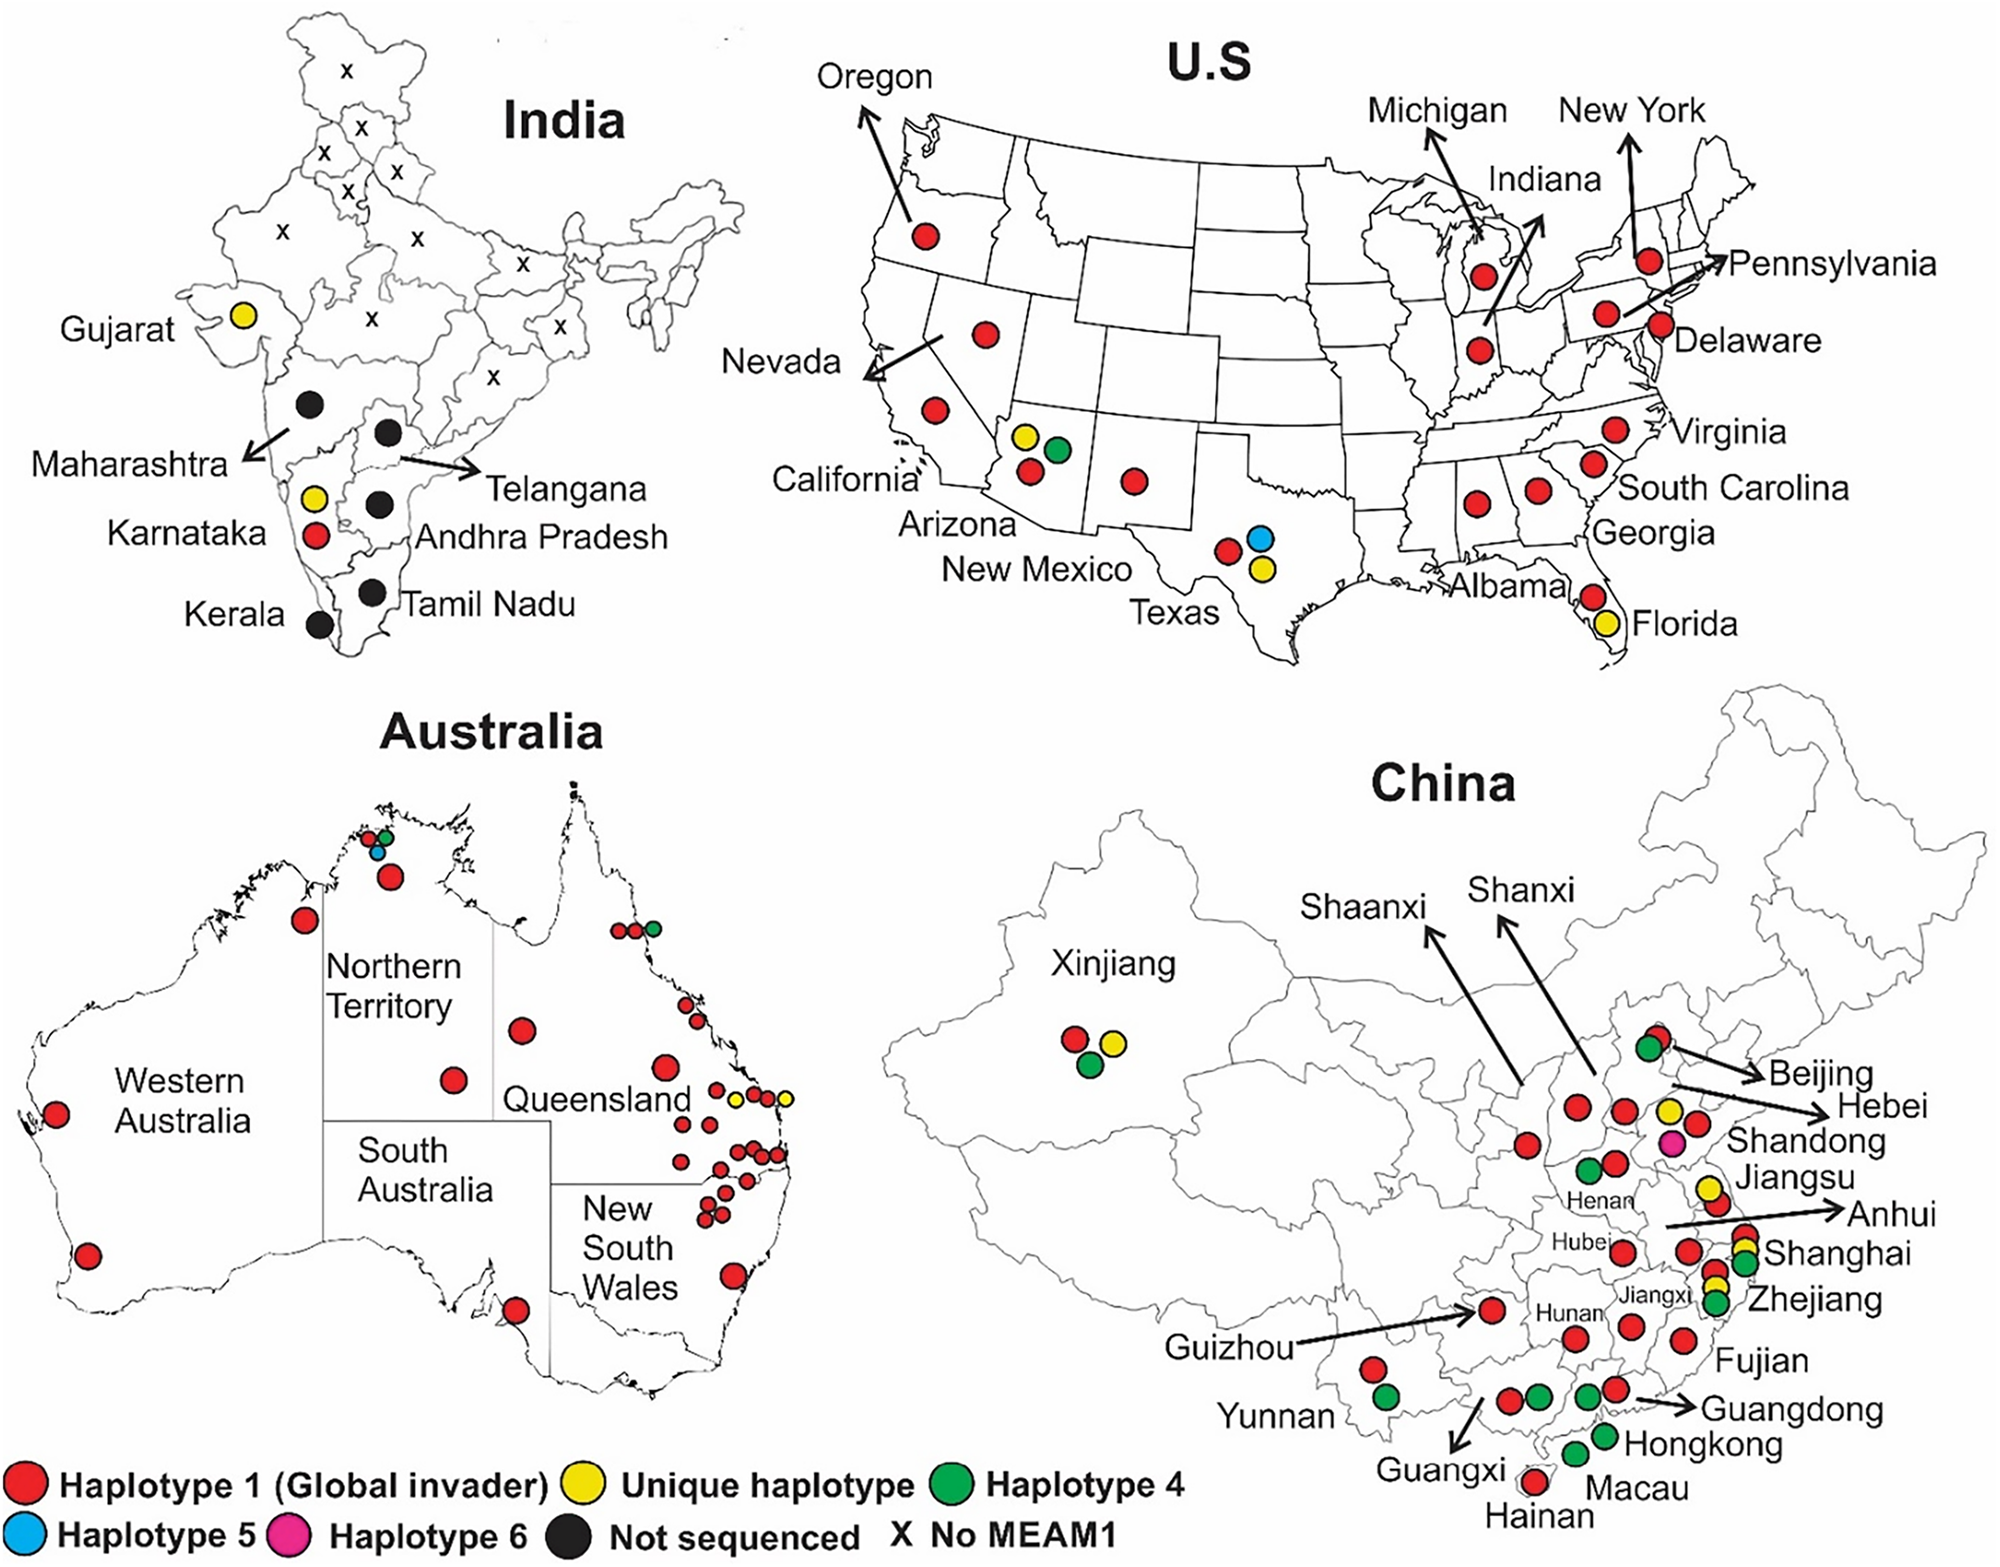
There were four haplotypes represented in 132 MEAM1 records for Australia (Table S5). Hap1, occurring in New South Wales, Queensland, South Australia, and Western Australia, and the Northern Territory, accounted for 96.18% of records (Fig. 3). Hap4 (2.29%, Cairns, QLD and Darwin, NT), Hap5 (0.76%, Cairns, QLD) and two unique haplotypes from Bundaberg, QLD (1.52%) were the other haplotypes encountered. In the USA, there were 127 accessions (Table S3). As with Australia, Hap1 was the most frequently encountered (96.06%), recorded from all 16 states (Alabama, Arizona, California, Delaware, Florida, Georgia, Indiana, Michigan, Nevada, New York, New Mexico, Oregon, Pennsylvania, South Carolina, Texas, and Virginia) where MEAM1 has been reported (Fig. 3). As with Australia, Hap4 (Arizona, 0.78%), and Hap5 (Texas, 0.78%) were also found as were three unique haplotypes, USA1 and USA2, both in Arizona and USA3 in Florida (2.36%). China was somewhat different. There were 154 records (Table S5). As with Australia and the USA, Hap1 and Hap4 were the most frequent. Hap1 was recorded from 19 provinces (Anhui, Beijing, Fujian, Guangxi, Guiyang, Hainan, Hebei, Henan, Hubei, Hunan, Jiangsu, Shaanxi, Shandong, Shanghai, Shanxi, Xinjiang, Yunnan, Zhejiang) and accounted for 75.98% of records (Figs. 3, 4) while Hap4, 12 provinces (Beijing, Guangdong, Henan, Hong Kong, Macau, Shaanxi, Shandong, Shanghai, Shanxi, Xinjiang, Yunnan, Zhejiang) accounted for 10.38% of records. However, unlike Australia and the USA, there were records of a further 16 haplotypes, Hap13, Jiangxi, and Shandong (1.29%); Hap6, Shandong (2.67%); and a further 14 unique haplotypes (9.74%) (Table S4).
Distribution of MEAM1 haplotypes in India, Australia, Greater China, and the USA. Blank world maps were taken from www.freeusandworldmaps.com. The maps were adapted using CorelDRAW X6.

Multiple introductions of MEAM1 in China and the USA, but not Australia
MEAM1 first invaded the USA in the late 1980s (Mckenzie et al., Reference Mckenzie, Bethke, Boykin, Byrne, Chamberlin, Gilrein, Ludwig, Oetting, Osborne, Schmale and Shatters2008, Reference Mckenzie, Bethke, Byrne, Chamberlin, Dennehy, Dickey, Gilrein, Hall, Ludwig, Oetting, Osborne, Schmale and Shatters2012) followed by major outbreaks in the early 1990s (Perring et al., Reference Perring, Cooper, Rodriguez, Farrar and Bellows1993). The earliest USA record from 1988 belonged to USA1, while the 1990s outbreak records were all associated with Hap1 (Table S3). Hap4 and Hap5 were first identified well after the outbreak years, 2000 and 2010, respectively, suggesting later introductions. MEAM1 was first detected in Australia in 1993 and was Hap1. MEAM1 is believed to have invaded China in the mid to late 1990s (Liu et al., Reference Liu, De Barro, Xu, Luan, Zang, Ruan and Wan2007) with Hap1 again being associated with outbreaks (Tables S4 and S5). In China, Hap4 was first reported in 2005 again suggesting a later introduction, whereas in Australia both Hap4 and Hap5 were detected in 1995 making them contemporary with the initial invasion.
Restricted distribution of MEAM1 Hap1 in India contrary to Australia, China, and the USA
MEAM1 was first reported in 1999 in association with an outbreak in the Kolar district of Karnataka State (Banks et al., Reference Banks, Colvin, Reddy, Maruthi, Muniyappa, Venkatesh, Kumar, Padmaja, Beitia and Seal2001). The haplotype associated with this record was identified as Ind11. Subsequent reanalysis of a sample from this first outbreak showed that Hap1 was also present, but the sample size was too small to determine relative abundance (Table S1). Since then, 12 haplotypes have been recorded from India and all were unique except for Hap1. Over the 16 years since the first detection of MEAM1, it has remained restricted to the southern and southwestern regions (Figs. 1, 4). In contrast, within 5 years of the first detection of MEAM1 in Australia, China, and the USA, it had spread across each country (Fig. 4).
Discussion
This study unifies our knowledge of the diversity and distribution of B. tabaci across India. There were 10 members of the complex: Asia I, Asia II 1, Asia II 5, Asia II 7, Asia II 8, Asia II 11, China3, India1, MEAM1, and MEAM3. In Asia, China has the highest diversity of species, with 16 (Hu et al., Reference Hu, De Barro, Zhao, Wang, Nardi and Liu2011; Kanakala and Ghanim, Reference Kanakala and Ghanim2019). Two cryptic species in India, AsiaII 5 and AsiaII 8, have not been found in China (Kanakala and Ghanim, Reference Kanakala and Ghanim2019). Some studies (Ahmed et al., Reference Ahmed, Yuan, Jin, Ren, Du and Qiu2009; Chowda-Reddy et al., Reference Chowda-Reddy, Kirankumar, Seal, Muniyappa, Valand, Govindappa and Colvin2012) have suggested that host plant-driven ecological niche separation was responsible for differences in geographical distributions of different members of the complex. A previous study had also suggested that there was greater diversity in southern India (Ellango et al., Reference Ellango, Singh, Raina, Priya, Raina, Chaubey, Naveen, Mahmood, Ramamurthy, Asokan and Rajagopal2015). Our reanalysis of all available data indicated that this was unlikely to be the case. Reanalysis showed a strong correlation between species diversity and the number of records surveyed. Therefore, the most likely explanation for the earlier conclusions was greater sampling effort rather than an inherently richer diversity.
Earlier studies had concluded that Asia1 was the only widely distributed species in India (Ellango et al., Reference Ellango, Singh, Raina, Priya, Raina, Chaubey, Naveen, Mahmood, Ramamurthy, Asokan and Rajagopal2015). Previously, AsiaII 1 was thought to be restricted to northern India close to Pakistan with no evidence of it in the southern states (Ahmed et al., Reference Ahmed, De Barro, Greeff, Ren, Naveed and Qiu2011; Chowda-Reddy et al., Reference Chowda-Reddy, Kirankumar, Seal, Muniyappa, Valand, Govindappa and Colvin2012); however, our reanalysis showed that it was also widely distributed. A study (Ellango et al., Reference Ellango, Asokan and Mahmood2014) reported that AsiaII 8 was confined to the northwest region of Karnataka and Asia II 5 was found only in Hospet (Ballari district). Our analysis found AsiaII 8 to not only be found across Karnataka State but also across the southern, western, and northern regions of India (Fig. 1). Similarly, AsiaII 5 was found in Karnataka as well as other States in the southern, eastern, and northern regions (Fig. 1). AsiaII 5 was also found in Bangladesh. The widespread distribution and high intra-population genetic distances of Asia1, AsiaII 1, and AsiaII 5 in India support that India is part of their respective home ranges. AsiaII 7 was first reported from India in 1998 (Ramappa et al., Reference Ramappa, Muniyappa and Colvin2008) and was later reported from India in several subsequent studies (Brown and Idris, Reference Brown and Idris2005; Chaubey et al., Reference Chaubey, Andrew, Naveen, Rajagopal, Ahmad and Ramamurthy2015; Chowda-Reddy et al., Reference Chowda-Reddy, Kirankumar, Seal, Muniyappa, Valand, Govindappa and Colvin2012; Ellango et al., Reference Ellango, Singh, Raina, Priya, Raina, Chaubey, Naveen, Mahmood, Ramamurthy, Asokan and Rajagopal2015; Hashmi et al., Reference Hashmi, Devi, Ahmad, Meshram and Prasad2019; Prasanna et al., Reference Prasanna, Kanakala, Archana, Jyothsna, Varma and Malathi2015; Rekha et al., Reference Rekha, Maruthi, Muniyappa and Colvin2005; Singh et al., Reference Singh, Priya, Kumar, Rana, Ellango, Joshi, Priyadarshini, Asokan and Rajagopal2012); it has also been reported from southern China (Hu et al., Reference Hu, Zhang, Jiang, Zhang, Liu, Li and Zhang2018; Qiu et al., Reference Qiu, Chen, Liu, Peng, Li, Ahmed, Mathur, Du and Ren2009). The Chinese population was genetically distinct (1.5%) from the one in India and both Indian and Chinese populations had a high intra-population genetic distance (1.3–1.5%) suggesting both countries form the home range.
Two records in our survey from West Bengal were identified as China3. China3 has been previously reported from China (Hu et al., Reference Hu, De Barro, Zhao, Wang, Nardi and Liu2011) and Bangladesh (AJ748382). In China, it occurred in Yunnan which is connected to India through Bangladesh and Myanmar. The genetic difference between Indian China3 and Chinese China3 is at least 0.9%, and 0.8% with Bangladeshi China3. We suggest that the home range for China3 extends across Bangladesh, China, India, and Myanmar.
Asia1 was previously reported predominantly from eggplant in China (Hu et al., Reference Hu, De Barro, Zhao, Wang, Nardi and Liu2011), but we found it to be present on eight different plant families. AsiaII 1 was previously reported from only soybean in India (Prasanna et al., Reference Prasanna, Kanakala, Archana, Jyothsna, Varma and Malathi2015), but our survey recorded it on eight different families. In Pakistan, an extensive survey of revealed only Asia1 and AsiaII 1 on cotton (Ahmed et al., Reference Ahmed, De Barro, Greeff, Ren, Naveed and Qiu2011), whereas in India a further four species, AsiaII 7, AsiaII 8, AsiaII 9, and India1 were recorded. In southern China, AsiaII 7 was only found on ornamental plants (Qiu et al., Reference Qiu, Chen, Liu, Peng, Li, Ahmed, Mathur, Du and Ren2009), but our survey found it to also cucumber, okra, and tomato as well as the ornamental hosts, ageratum, croton and morning glory. Our analysis highlights the need for and importance of detailed systematic sampling to more accurately determine host range and geographical distribution. As many of these species are associated with the transmission of begomovirus (Ahmed et al., Reference Ahmed, De Barro, Greeff, Ren, Naveed and Qiu2011; Muniyappa et al., Reference Muniyappa, Maruthi, Babitha, Colvin, Briddon and Rangaswamy2003; Pratap et al., Reference Pratap, Kashikar and Mukherjee2011) accurate interpretation of host range and geographical distributions is a critical element of interpreting epidemiological processes.
The observation that genetic diversity of MEAM1 in India is equivalent to that observed in the known home range and significantly greater than that observed in the invaded range, the presence of 13 unique haplotypes and the direct connection to haplotypes from MEAM1’s home range (Arabian Peninsula, Iran, Iraq, Israel, Pakistan, and Syria) suggests that India is an extension of the MEAM1 home range. Young et al. (Reference Young, Mitterboeck, Loeza-Quintana and Adamowicz2018) demonstrated that the intraspecific diversity of a mitochondrial gene in invasive species is markedly greater within their source geographic range compared to the ranges they have invaded. This evidence further supports the hypothesis that India is within the native range of MEAM1. In addition, the highest diversity of natural enemies, especially parasitoid species, has been reported from India (Oliveira et al., Reference Oliveira, Henneberry and Anderson2001) which further supports the home range case.
One of the consequences of the invasion of MEAM1 in Australia, China, and the USA was the rapid displacement of indigenous members of the complex (Liu et al., Reference Liu, De Barro, Xu, Luan, Zang, Ruan and Wan2007; Mckenzie et al., Reference Mckenzie, Bethke, Byrne, Chamberlin, Dennehy, Dickey, Gilrein, Hall, Ludwig, Oetting, Osborne, Schmale and Shatters2012). In India, MEAM1 was first reported in Karnataka State as an invader and it was assumed that MEAM1 would replace indigenous species in India (Banks et al., Reference Banks, Colvin, Reddy, Maruthi, Muniyappa, Venkatesh, Kumar, Padmaja, Beitia and Seal2001) and spread rapidly across the rest of India. This has not occurred. A further survey found MEAM1 to be well established across Karnataka (Shankarappa et al., Reference Shankarappa, Ranpaswamy, Narayana, Rekha, Raghavendra, Reddy, Chancellor and Maruthi2007). Two years later, a survey of eight states from western (Maharashtra), northern (Delhi, Punjab), and southern regions (Tamil Nadu, Karnataka, Kerala, Andhra Pradesh) found MEAM1 only in Andhra Pradesh, Karnataka, Tamil Nadu, and Telangana (Shankarappa et al., Reference Shankarappa, Ranpaswamy, Narayana, Rekha, Raghavendra, Reddy, Chancellor and Maruthi2007). A subsequent survey of nine states a year later found MEAM1 in the southwestern (Maharashtra and Gujarat) and southern (Andhra Pradesh and Karnataka) regions, but not in the northwestern (Rajasthan) or northern regions (Punjab and Haryana) (Gupta et al., Reference Gupta, Sharma, Rakesh, Jindal and Dilawari2008). A series of surveys over the past few years failed to find MEAM1 (Ellango et al., Reference Ellango, Asokan and Mahmood2014; Firdaus et al., Reference Firdaus, Vosman, Hidayati, Supena, Visser and Van Heusden2013; Li et al., Reference Li, Guo, Ren, De Barro and Qiu2014; Prasanna et al., Reference Prasanna, Kanakala, Archana, Jyothsna, Varma and Malathi2015; Singh et al., Reference Singh, Priya, Kumar, Rana, Ellango, Joshi, Priyadarshini, Asokan and Rajagopal2012). The reported survey of 71 locations across Karnataka found MEAM1 only at 5 locations despite its earlier widespread presence (Roopa et al., Reference Roopa, Asokan, Rebijith, Hande, Mahmood and Kumar2015). Our survey did not find MEAM1. In summary, despite MEAM1 having a confirmed presence in India of 24 years, it has failed to spread into the northern, eastern and central regions and has a very patchy distribution in the southern region. Even the highly invasive Hap1 which managed to spread across Australia, China, and the USA within 5 years has failed to spread across India or even dominate the southern region where it was first detected. There is also no evidence of displacement of other members of the complex.
Why MEAM1 has behaved so differently in India is unclear. An analysis of performance of MEAM1 from Pakistan relative to published performance from the invaded range suggested that MEAM1 from Pakistan was less fit (Ahmed et al., Reference Ahmed, Naveed, Ul Ane, Ren, De Barro and Qiu2014). The Pakistan MEAM1 haplotype investigated was not the globally invasive Hap1. It is possible that of all the MEAM1 haplotypes only a few and especially Hap1 have the necessary traits that facilitate a capacity to be a successful invader. This may help explain why the haplotypes of MEAM1 that are unique to India have not proven to be invasive. It does not though explain why the highly invasive Hap1 which was associated with outbreaks in 1999 in the Kolar district of Karnataka has not continued to spread. For this we have no explanation other than it runs counter to everything we know about this highly invasive haplotype. Could India’s very high level of parasitoid diversity be a possible contributor to the apparent suppression of MEAM1?
A final observation was the curiously high diversity of MEAM1 in China. China has a diversity that is not significantly different to that found in Egypt, the Middle East, Iran, and India, but was significantly greater than that found across the invaded range. Further, the examination of haplotype diversity revealed the presence of 18 haplotypes that were unique to China which is much greater than what one expects in the invaded range. One explanation is that as a species, MEAM1 has always been in China, but occurring at low levels and not observed due to a lack of any reason to look. It only came to notice after the invasion of Hap1 when high population levels associated with outbreaks began to be observed. If this is the case, then China could well form part of the home range of MEAM1 and it was the invasion of new genetic material in the form of Hap1 that led to the subsequent outbreaks. If that is the case, then it is doubly puzzling as to why a similar story has not unfolded in India. Considering the numerous instances of MEAM1 invading and displacing native species in China over recent decades, it may seem counterintuitive to classify China as part of MEAM1’s home range. Nonetheless, a similar situation is observed in the genus Thrips: the species T. palmi became a significant pest within its assumed native range in Southeast Asia, particularly in areas of intensive crop production, akin to the case of MEAM1 (Mound and Collins, Reference Mound and Collins2000).
Statistical parsimony networks connect haplotypes that differ by one or more mutations, aiding in the prediction of older versus newer haplotypes based on their arrangement within the networks. Four features characterise older haplotypes: (1) higher frequency, (2) central placement, (3) numerous connections within the network, and (4) extensive geographical distribution. Our analysis suggests that Hap1 is the most ancient haplotype, succeeded by Hap2–4,6–8. Although Hap5 is relatively prevalent (with identical sequences found across eight countries), it is positioned peripherally in our network analysis and has only two connections to Hap1. The remaining haplotypes, Hap9–13, are also peripheral; each has a single connection to Hap1. Hap1’s wide geographical distribution may be attributed to its carriers having had more time to disperse. In contrast, the newer haplotypes exhibit lower frequencies, are located on the network’s periphery, have only a single connection, and show limited geographical spread (Hap9–13). These haplotypes typically have just one connection, usually to haplotypes from the same population, indicative of their recent evolution. Their carriers have either not had sufficient time to disperse or may lack the potential for invasiveness.
Biological invasions occur due to certain invasive traits, including high fecundity (Young et al., Reference Young, Mitterboeck, Loeza-Quintana and Adamowicz2018), high population growth rates (Lee and Bell, Reference Lee and Bell1999), and shorter generation times (Sakai et al., Reference Sakai, Allendorf, Holt, Lodge, Molofsky, With, Baughman, Cabin, Cohen, Ellstrand, McCauley, O’Neil, Parker, Thompson and Weller2001). These traits enable populations to establish themselves in new, non-native environments over time and, concurrently, lead to an increased mutation rate, resulting in genetic variation. Overall, biological invasions can elevate the mutation rate through an increased substitution rate, driven by positive selection pressure on specific genes (Roman and Darling, Reference Roman and Darling2007), and may also lead to the fixation of those genes (Young et al., Reference Young, Mitterboeck, Loeza-Quintana and Adamowicz2018). However, we do not anticipate such an increase in mutation rate as a result of the MEAM1 invasion out of its home range, considering that its incursion is relatively recent (within the last 20–30 years) (De Barro and Ahmed, Reference De Barro and Ahmed2011) and due to the involvement of the COI gene, which has not been linked to adaptive changes in invasion success (Young et al., Reference Young, Mitterboeck, Loeza-Quintana and Adamowicz2018).
Morphological identification alone is limited when dealing with a cryptic species complex, which becomes unacceptable. Several molecular markers have been developed for species identification, including the mtCOI gene, as well as sections of various nuclear genes (genes encoding 18S rRNA and 28S rRNA) and internal transcribed spacers (rDNA ITSs). However, mtCOI is regarded as the better marker for species identification and genetic analyses due to its high nucleotide substitution rates (Hebert et al., Reference Hebert, Cywinska, Ball and DeWaard2003). Additionally, the publicly available sequences for Asian Bemisia species complex members, in terms of number and breadth of geographic distribution, are unfortunately limited to mtCOI. Although analysis based on mtCOI has produced fairly accurate relationships at lower taxonomic levels compared to multigene analysis (Wilson, Reference Wilson2010; Boyle and Adamowicz, Reference Boyle and Adamowicz2015), the inclusion of additional genes will further aid in our understanding of the origin of MEAM1.
Supplementary material
The supplementary material for this article can be found at https://doi.org/10.1017/S0007485324000828.
Acknowledgements
We thank three anonymous reviewers and Paul De Barro (CSIRO) for their very useful comments on earlier drafts of the manuscript.
Author contributions
Conceived and designed the experiments: MZA, VJ, and BLQ. Performed the experiments: MZA, VJ, PJ, XLL, XTR, VJ, BM, GB, and QJW. Analyzed the data: MZA, VK, CLM, and LSO. Wrote the paper: MZA and BLQ.
Financial support
This work was supported by the National Key R&D Program of China (2022YFD1401200), Natural Science Foundation of Zhejiang Province (LZ21C140001) and National Natural Science Foundation of China (32172402).
Competing interests
The authors declare no conflicts of interest.