Introduction
Reproductive traits play a major role in the efficiency of pig production. Most reproductive traits are rather difficult to improve through standard selection methods because of their low heritability and their late sex-limited expression. The development of genetic maps in livestock species over the last 10 years has allowed detecting genomic regions contributing to the genetic variation of quantitative traits. These are known as quantitative trait loci (QTL). The use of molecular marker information may then be very useful to increase rates of genetic improvement. This is particularly true for reproductive traits, since simulation studies have demonstrated that the efficiency of marker-assisted selection relative to phenotypic selection is greatest for lowly heritable and sex-limited traits (Lande and Thompson, Reference Lande and Thompson1990). Markers might also be used to introgress new favourable QTL alleles from populations with high reproductive and maternal performance such as Chinese Taihu breeds.
Marker-assisted selection or introgression programmes require QTL to be identified and their effects to be estimated in the target populations. Several QTL affecting growth and carcass traits have been mapped in pigs (Bidanel and Rothschild, Reference Bidanel and Rothschild2002). Much fewer QTL with significant effects on female reproductive traits have been identified so far (Cassady et al., Reference Cassady, Johnson, Pomp, Rohrer, Van Vleck, Spiegel and Gilson2001; Bidanel and Rothschild, Reference Bidanel and Rothschild2002). The main reasons for this limited number of results are the small number of studies reported for such traits and the size of experiments restricted to the female progeny only.
A large experiment has been conducted at INRA in order to investigate QTL for many traits of interest in a three-generation crossbreeding programme between Chinese Meishan and European Large White breeds. The two breeds are known to widely differ for a large number of traits including growth, carcass composition and reproductive performance (Bidanel et al., Reference Bidanel, Caritez and Legault1990b). Differences in reproductive performance are of particular interest, as this experiment has the potential to detect QTL alleles with favourable effects on reproductive traits originating from the highly prolific Meishan breed. Several female reproductive traits were hence recorded on more than 500 Meishan × Large White F2 gilts. The present paper reports the results of a whole-genome scan carried out to map QTL affecting these female reproductive traits.
Material and methods
Animals and data recording
A three-generation resource population was developed between 1991 and 1997 at the INRA experimental research unit of Le Magneraud (Surgères, France), by first mating six unrelated Large White boars to six lowly related Meishan sows (one boar/sow). The 12 founder animals were tested and found to be free of the mutation at the ryanodyne receptor locus, which is responsible for halothane susceptibility. One boar and four gilts were kept for breeding in each of the six litters produced (except in one litter where only three females were available). Three or four F1 females were assigned to each of the F1 boars and were mated to produce F2 families. Assignments were performed so as to minimise relationships between F1 males and females. F1 sows were allowed to produce up to 13 litters. Two of the six males were culled before the end of the experiment. Their females were reassigned to the four remaining males in order to produce new full-sib families. A total of 573 F2 female and 530 male pigs were used for QTL mapping. More details on the experimental design can be found in Bidanel et al. (Reference Bidanel, Milan, Iannuccelli, Amigues, Boscher, Bourgeois, Caritez, Gruand, Le Roy, Lagant, Quintanilla, Renard, Gellin, Ollivier and Chevalet2001).
The F1 sows were managed under a batch farrowing system, with a 3-week interval between contiguous batches. The number of morphologically normal teats was recorded on both male and female F2 piglets shortly after birth. F2 females were raised in Le Magneraud, with the exception of 68 females raised in another experimental herd (SESP, Rouillé, Vienne) in 1992, as described in Bidanel et al. (Reference Bidanel, Milan, Iannuccelli, Amigues, Boscher, Bourgeois, Caritez, Gruand, Le Roy, Lagant, Quintanilla, Renard, Gellin, Ollivier and Chevalet2001). First oestrus was checked daily from 90 to 210 days of age using the back-pressure test. To control the occurrence of first ovulation, blood samples were collected at 10- to 11-day intervals from 90 days of age and assayed for plasma progesterone as described by Prunier and Meunier-Salaün (Reference Prunier and Meunier-Salaün1989). It was considered that ovulation had occurred when progesterone concentration was higher than 5 ng/ml (positive sample). Blood sample collection was stopped as soon as a positive sample was detected. When the progesterone test was positive 2 to 13 days after the first recorded oestrus, puberty was defined as the day of this first oestrus. When a blood sample was positive before any oestrus detection, it was assumed that a ‘silent’ ovulation had occurred. In this case, age at puberty was computed by subtracting the average time-interval between oestrus and the first positive sample in this population, i.e. 6 days, from the day of progesterone increase. Cyclic gilts were then submitted to a synchronization treatment with a progestagen at 26 or 29 weeks of age, were inseminated twice within a 12 h interval on the following oestrus with semen from Piétrain boars and then weighed. They were slaughtered at 30 days of gestation and the number of viable and degenerating embryos was counted.
Traits analysed
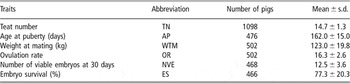
Six traits were defined and analysed from the above-mentioned measurements, i.e. teat number (TN), age at puberty (AP), weight at mating (WTM), ovulation rate (OR) defined as the number of corpora lutea on dissected ovaries, the number of viable embryos (NVE) measured on dissected uterine horns and embryo survival (ES) defined as 100*(NVE/OR). The number of records, overall means and phenotypic standard deviations of the six traits are shown in Table 1.
Overall means and phenotypic standard deviations of the six traits studied

Genotyping and map construction
All F2 pigs, their 29 parents and the 12 grandparents were genotyped for 136 microsatellite markers and the major histocompatibility complex (SLA). The markers covered all autosomes and the X chromosomes, with 3 to 12 markers on each. Genotypes were obtained as described by Bidanel et al. (Reference Bidanel, Milan, Iannuccelli, Amigues, Boscher, Bourgeois, Caritez, Gruand, Le Roy, Lagant, Quintanilla, Renard, Gellin, Ollivier and Chevalet2001). Multipoint linkage analyses were carried out with the 2.4 version of the CriMap software (Green et al., Reference Green, Falls and Crooks1990). Recombination units were then transformed to map distances using the Haldane mapping function. The average distance between adjacent markers was 22.0 cM on the sex-averaged map (Bidanel et al., Reference Bidanel, Milan, Iannuccelli, Amigues, Boscher, Bourgeois, Caritez, Gruand, Le Roy, Lagant, Quintanilla, Renard, Gellin, Ollivier and Chevalet2001).
Statistical analyses
The data  used for QTL mapping were obtained as residuals from a linear model including the fixed effects of contemporary group and age at mating (for OR, WPM, NVE and SE) as a covariate. Additional analyses were performed for NVE and SE using OR as a covariate. Litter sire was included as an additional fixed effect for NVE and ES in preliminary analyses. It appeared as non-significant (P > 0.05) and was consequently deleted from final analyses. The analyses were performed using the GLM procedure of the SAS software (SAS Institute, 1999).
Two types of interval mapping analyses were performed: (1) a line-cross (LC) analysis assuming that founder populations are fixed for different QTL alleles (referred to as LC model hereafter); (2) a model assuming that the F2 population is a mixture of full- and half-sib families, with no assumption about the number of QTL alleles and allele frequencies within the founder populations (referred to as HFS model hereafter).
Line-cross model
The LC model assumed a di-allelic QTL with alternative alleles fixed in founder breeds, Q in Meishan and q in Large White animals. Denoting the effects of QQ, Qq/qQ and qq as a, d and −a, respectively, the adjusted performance  of an F2 offspring i can be written as

where μ is the population mean, cai and cdi are the coefficients of additive (a) and dominance (d) components, respectively, for animal i at a given putative position on autosomes, and ei is the residual error. cai and cdi were computed as cai = Probi(QQ)−Probi(qq) and cdi = Probi(Qq)+Probi(qQ), where Probi(XX) is the probability of having genotype XX for animal i. A simplified model with a single parameter (allele substitution effect) was used for the X chromosome. The genotype probabilities were computed as described in Haley et al. (Reference Haley, Knott and Elsen1994). At each tested location (each centimorgan), an F ratio was computed to compare the hypothesis with one QTL (H1) v. the hypothesis of no QTL (H0) on the chromosome. Reported estimates for a and d were those obtained at the location with the highest F ratio. The analyses were carried out using the QTLExpress software (Seaton et al., Reference Seaton, Haley, Knott, Kearsey and Visscher2002).
Significance thresholds were empirically determined at the chromosome level, by performing 1000 permutations of the trait values against the genotypes, and the genome-wide levels were obtained applying an approximate Bonferroni correction (Knott et al., Reference Knott, Marklund, Haley, Andersson, Davies, Ellegren, Fredholm, Hansson, Hoyhem, Lundström, Moller and Andersson1998). Chromosome-wide thresholds slightly varied depending on chromosomes and traits but they were on average equal to F = 7.6 and 5.4, respectively, with two (autosomes) and one (chromosome X) degrees of freedom in the numerator. Genome-wide significance thresholds (0.05 false-positives per genome scan) were on average equal to F = 13.0 and 8.5, respectively, for F ratios with one and two degrees of freedom in the numerator.
Outbred model
HFS analyses with a single QTL model were carried out to better take into account the possibility that a QTL segregates in one or both founder populations. The F2 population was supposed to be structured in 24 full-sib families nested within six independent sire families. Hence, a dam mated to different sires was considered as a different dam for each sire. Test statistics were computed, at 1 cM intervals along the genome, as the ratio of likelihoods under the hypotheses of one (H1) v. no (H0) QTL at the position considered. Under H1, a QTL with a gene substitution effect (α) for each sire and each dam was fitted to the data (Bidanel et al., Reference Bidanel, Milan, Iannuccelli, Amigues, Boscher, Bourgeois, Caritez, Gruand, Le Roy, Lagant, Quintanilla, Renard, Gellin, Ollivier and Chevalet2001). Significance thresholds were determined empirically by simulating trait values under a polygenic infinitesimal model with a normal distribution of performance traits (Le Roy et al., 1998) for the F2 progeny. A total of 1000 simulations were first performed for each chromosome × trait combination to determine chromosome-wide (CW) significance thresholds. Then for CW significant chromosomic regions (P c < 0.05), 9000 additional simulations were carried out to obtain more precise distributions of the test statistics under H0 and to accurately determine genome-wide (GW) significance thresholds. These thresholds were obtained using significance levels (P c) that were computed using a Bonferroni correction, i.e. as a solution to P g = 1−(1−P c)nc, where P g is a genome-wide test probability and nc is the number of chromosomes, which gives P c = 0.0027 for P g = 0.05 and nc = 19. For each QTL reaching a chromosome-wide significance level of 5%, additional tests, with models ignoring dam effects within sire families, were performed, so the sire status for the QTL could be tested: sires whose likelihood ratio exceeded the value of a χ 2 distribution with one degree of freedom and a type I error of 5% (=3.84) were considered as heterozygous for the locus. Finally, the average substitution effect of each QTL was computed as the mean of the substitution effects estimated for the heterozygous sires.
Results
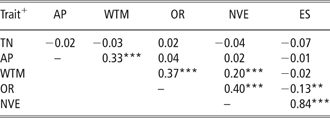
The residual correlations between traits are shown in Table 2. Teat number had close to zero correlations with the five other traits. Age at puberty had a moderate positive correlation with WTM, but was not correlated with components of litter size. OR and NVE, but not ES, tended to increase with WTM. OR had a moderate positive correlation with NVE. ES was closely correlated with NVE and had a low but significant negative correlation with OR.
Coefficients of correlation between the six traits studied (residual correlations from a fixed linear model (see text)

+See Table 1 for the definition of the traits.
*P < 0.05; **P < 0.01; ***P < 0.001.
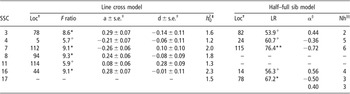
Only associations showing at least a suggestive level of significance with either line-cross (LC) and half/full-sib (HFS) models are given in Tables 3, 4 and 5, respectively, for teat number, weight at mating and reproduction traits. Four genome-wide (GW) significant (P g < 0.05) QTL were detected for TN on chromosomes 3 (in the S0372 to S0397 interval), 7 (between markers SW352 and SW632), 8 (in the S0225 to SW1551 interval) and 16 (between SW419 and S0371) using the LC model. They explained a rather limited fraction of the phenotypic variance (1.6% to 2.3%) of TN. The four QTL had mainly additive effects, with positive effects of Meishan alleles on SSC 3, 8 and 16 and a negative effect on SSC 7. Two additional QTL were suggested using LC on chromosomes 4 (S0227 to SW2547 interval) and 11 (SW1465 to SW2413 interval). They explained 1.2 and 1.3% of the phenotypic variance, respectively, with a positive effect of Large White alleles on SSC 4 and a mainly overdominant effect on SSC 11. QTL were also detected on chromosomes 3, 4, 7 and 16 using the HFS model. Their most likely position was very similar to that obtained with LC on SSC 3 and 7. The most likely position somewhat differed on chromosomes 4 and 16, but CIs of the position estimated using the Lod drop-off method largely overlapped. With the exception of the SSC 7 QTL, 1 to 4 sires were not validated for the segregation of the QTL. The average additive QTL effects of heterozygous sires had the same sign, but were larger than LC estimates. An additional QTL was detected on SSC 17, with opposite additive effects depending on the sires: three of them transmitted favourable Meishan alleles, the three others favourable Large White alleles.
Results of QTL analyses for teat number. Position and estimated QTL effects at the higher test statistic value

†Most probable location of the QTL.
♯a = additive genetic effect (Meishan-Large White alleles) ± standard error; d = dominance effect ± standard error. Effects are expressed in trait units.
‡Fraction of the phenotypic variance explained by the QTL.
§Average allele substitution effect (Meishan-Large White alleles) of heterozygous F1 sires (in trait units).
§§Number of heterozygous sires.
*; **; *** = 5%, 1% and 0.1% genome-wide significance levels, respectively. + = 5% chromosome-wide significance; LR = likelihood ratio.
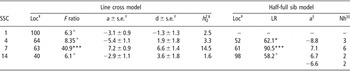
Results of QTL analyses for sow weight at mating (kg). Position and estimated QTL effects at the higher test statistic value

†Most probable location of the QTL.
♯a = additive genetic effect (Meishan-Large White alleles) ± standard error; d = dominance effect ± standard error. Effects are expressed in trait units.
‡Fraction of the phenotypic variance explained by the QTL.
§Average allele substitution effect of heterozygous F1 sires (in trait units).
§§Number of heterozygous sires.
*; **; *** = 5%, 1% and 0.1% genome-wide significance levels, respectively. + = 5% chromosome-wide significance; LR = likelihood ratio.
Results of QTL analyses for female reproductive traits. Position and estimated QTL effects at the higher test statistic value

†See Table 1 for the definition of the traits.
‡Most probable location of the QTL.
¶a = additive genetic effect (Meishan-Large White alleles) ± standard error; d = dominance effect ± standard error. Effects are expressed in trait units.
§Fraction of the phenotypic variance explained by the QTL.
§§Average allele substitution effect of heterozygous F1 sires (in trait units).
♯Number of heterozygous sires.
*; **; *** = 5%, 1% and 0.1% genome-wide significance levels, respectively. + = 5% chromosome-wide significance; LR = likelihood ratio.
One genome-wide highly significant QTL was mapped for WTM in the SLA region on SSC 7 using the LC model. It explained 14.5% of the phenotypic variance of WTN, with a positive dominant effect of Meishan alleles. Very similar location and additive effects were obtained with the HFS model, which additionally showed that the six F1 sires were heterozygous for QTL. Three additional QTL were suggested using LC, between S0396 and S0113 on SSC 1, between S0001 and SW1089 on SSC 4 and in the S0058 to S0007 interval on SSC 14. They explained 1.6% to 3.3% of the phenotypic variance of WTN, with negative additive effects of Meishan alleles on the three chromosomes, and a strong dominance effect on SSC 14. QTL were also detected with HFS analyses on chromosomes 4 and 14. The most likely position of the QTL fell within the same marker interval as that obtained with LC on SSC 4, but differed by more than 50 cM on SSC 14. Moreover, two sires with positive effects and two sires with negative effects of Meishan alleles were identified.
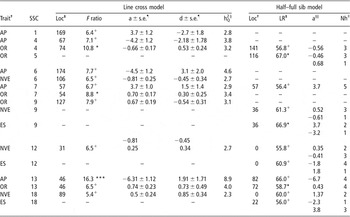
One chromosomal region was highly significant (P g < 0.001) and two more regions reached significance (P g < 0.05) at the genome-wide level for at least one reproduction trait using the LC model (Table 5). The highly significant region, located in the SWR1941 to S0222 interval on SSC 13, explained 8.9% of the phenotypic variance of AP, with negative, i.e. favourable, additive effects of Meishan alleles (−6.3 days). It also had chromosome-wide significant effects (P c < 0.05) on OR, with positive effects of Meishan alleles (+0.74 ova shed). The two other genome-wide significant QTL both affected OR. They were located on chromosomes 4 (S0001 to SW1089 interval) and 7 (SW1369 to LRA1 interval), respectively. Meishan alleles had a positive additive effect on SSC 7, and a negative additive effect on SSC 4, but with a significantly positive dominance effect (+0.53 ± 0.24 ova shed). Suggestive effects of both SSC 4 and SSC 7 QTL on AP were also detected, with a positive effect of Meishan alleles on SSC 7 and a negative one on SSC 4.
Eight additional chromosome-wide significant QTL (P c < 0.05) were detected using the LC model on SSC 1, 6, 7, 9, 12 and 18. The end of the long arm of SSC 1 (between markers SW1828 and SW1301) affected AP, with positive additive effects of Meishan alleles. Two QTL were suggested on SSC 6, one in the S0121 to SW322 interval, explaining 4% of the variance of AP, and the second one at the position of S0059, explaining 2.7% of NVE variability. Estimates of Meishan allele effects were negative in both cases. The SLA region on SSC 7 explained 2.9% and 3.4% of the variance of AP and OR, respectively, with negative effects of Large White alleles in both cases. A fourth QTL of similar magnitude affecting OR was mapped in the S0384 to SW174 interval on SSC 9, with again positive effects of Meishan alleles. Finally, two QTL affecting NVE were suggested on chromosomes 12 and 18, with positive effects of Large White alleles on SSC 12 and positive overdominant effects of Meishan alleles on SSC 18.
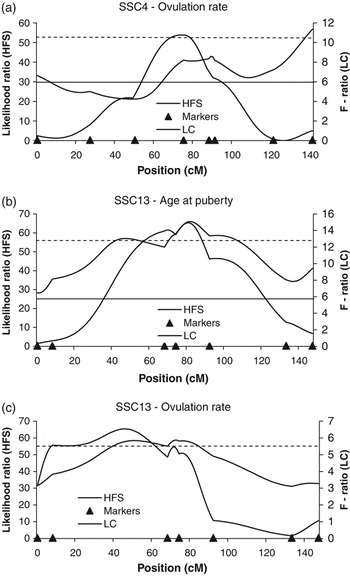
Results from HFS were at first sight quite different from LC results, the single common location being the SSC 7 QTL on AP. Yet, a more thorough insight into the results showed that: (1) in some instances, e.g. for AP on SSC 4 and 6, a similar location was obtained with LC and HFS analyses, but the likelihood ratio did not reach significance in the latter case; (2) the somewhat different position obtained with HFS on chromosomes 4 for OR and 13 for AP and OR were due to the shape of the likelihood ratio curve (LRC) obtained with the HFS model (multiple peaks or flat LCR – see Figure 1), so that LC and HFS QTL mapping intervals were largely overlapping.
Profile of F-ratio (LC = line cross model) or likelihood ratio (HFS = half–full sib model) throughout chromosomes 4 and 13 for ovulation rate and age at puberty. The horizontal lines denote the 5% chromosome-wide thresholds for LC (solid line) and HFS (dashed line), respectively.

Discussion
Two complementary models were used to detect QTL affecting pig reproduction traits. The line-cross model assumed different alleles to be fixed in grand-parental populations. It is a very simple model that uses a limited number of parameters and easily allows additive and dominance effects, but also additional parameters such as parent-of-origin effects (de Koning et al., Reference De Koning, Rattink, Harlizius, Van Arendonk, Brascamp and Groenen2000). The HFS model is more complex, as it assumes the population to be structured in a set of independent sire families with a hierarchical structure, i.e. with offspring from a given sire distributed in several full-sib families. An allele substitution effect was then estimated for each of the six F1 sires and of the 23 F1 dams. This higher number of parameters results in a loss of power as compared to the LC model when the QTL alleles in grand-parental populations are different and fixed, as illustrated by the lower significance levels obtained with HFS in several cases (e.g. see TN results on chromosomes 3 and 16 and AP results on chromosome 4). Moreover, dominance effects were not estimated with HFS, as it would have doubled the number of parameters. Conversely, the HFS model is more robust to departures from the simple situation described here above. Indeed, some HFS results clearly show that most QTL alleles do not segregate in the six sire families, which means that they are not fixed in grand-parental populations. In this situation, the LC model tends to underestimate QTL effects, whereas unbiased estimates can be obtained with the HFS model by considering only heterozygous families. Moreover, the HFS model allowed additional QTL whose effect was opposite in different families to be detected (e.g. see TN results on SSC 17).
Our results suggest that teat number is controlled by a large number of loci with relatively small effects. This is consistent with available literature results (Hu et al., Reference Hu, Dracheva, Jang, Maglott, Bastiaansen, Rothschild and Reecy2005), where most of the numerous QTL affecting teat number (26 QTL reported on 11 different pig chromosomes) have a rather limited effect (with the exception of Wada et al. (Reference Wada, Akita, Awata, Furukawa, Sugai, Inage, Ishii, Ito, Kobayashi, Kusumoto, Matsumoto, Mikawa, Miyake, Murase, Shimanuki, Sugiyama, Uchida, Yanai and Yasue2000) who reported QTL effects of 0.7 teats, QTL additive effects are lower than 0.5 teat). The QTL we mapped on SSC 3, 7 and 8 are located in the same chromosomal regions as those reported by Rohrer (Reference Rohrer2000), in a Meishan × Large White composite resource population, by Cassady et al. (Reference Cassady, Johnson, Pomp, Rohrer, Van Vleck, Spiegel and Gilson2001) in a cross between selected lines and by Beeckmann et al. (Reference Beeckmann, Moser, Bartenschlager, Reiner and Geldermann2003) in a Wild Boar × Meishan F2 population. No QTL affecting teat number had so far been detected on chromosomes 4, 16 and 17. Cassady et al. (Reference Cassady, Johnson, Pomp, Rohrer, Van Vleck, Spiegel and Gilson2001) also reported a QTL with essentially dominance effects on SSC 11, but its most likely position was at almost 50 cM from the QTL we found on this chromosome. Unlike the total teat number, genes with large effects would affect the number of functional or non-functional teats, as suggested by the results of Sanchez et al. (Reference Sanchez, Bidanel, Zhang, Naveau, Burlot and Le Roy2003) using segregation analysis, who found a major gene with an effect of two to three teats on the number of good/false teats without any effect on total teat number. Yet, this gene has, as far as we know, not yet been mapped.
Though WTM has a positive correlation with both AP and OR, the QTL identified on this trait are more likely to be growth than sexual maturity QTL. Indeed, the four QTL affecting WTM found in the present study fell in the same marker intervals and had additive and dominance effects comparable to the growth QTL mapped by Bidanel et al. (Reference Bidanel, Milan, Iannuccelli, Amigues, Boscher, Bourgeois, Caritez, Gruand, Le Roy, Lagant, Quintanilla, Renard, Gellin, Ollivier and Chevalet2001) on the same experimental design. The same regions of SCC 4 and 7 also affected AP and OR, which may suggest that it is associated with early development and sexual maturity or that the observed effects are due to several closely linked genes.
The number of QTL affecting reproductive traits has so far been much more limited than those affecting production traits. Five QTL affecting age at puberty have been reported in only two studies (Rohrer et al., Reference Rohrer, Ford, Wise, Vallet and Christenson1999; Cassady et al., Reference Cassady, Johnson, Pomp, Rohrer, Van Vleck, Spiegel and Gilson2001). Results for ovulation rate are slightly more numerous, as 14 chromosomal regions associated with variations in OR are reported in PiqQTLdb (Rohrer et al., Reference Rohrer, Ford, Wise, Vallet and Christenson1999; Wilkie et al., Reference Wilkie, Paszek, Beattie, Alexander, Wheeler and Schook1999; Cassady et al., Reference Cassady, Johnson, Pomp, Rohrer, Van Vleck, Spiegel and Gilson2001; Campbell et al., Reference Campbell, Nonneman and Rohrer2003). Regarding litter size, 12 QTL located on 10 different chromosomes have been reported (Rathje et al., Reference Rathje, Rohrer and Johnson1997; Cassady et al., Reference Cassady, Johnson, Pomp, Rohrer, Van Vleck, Spiegel and Gilson2001; de Koning et al., Reference De Koning, Rattink, Harlizius, Groenen, Brascamp and Van Arendonk2001; Noguera et al., 2006; Tribout et al., Reference Tribout, Iannuccelli, Druet, Gilbert, Riquet, Guéblez, Mercat, Bidanel, Milan and Le Roy2008), of which only those reported by Noguera et al. (2006) reached a genome-wide significance level (P < 0.05).
Some of the QTL detected in the present study have similar positions as previously reported loci. The locus affecting AP on SSC 7 shows a most likely position close to that reported by Cassady et al. (Reference Cassady, Johnson, Pomp, Rohrer, Van Vleck, Spiegel and Gilson2001). Similarly, the OR QTL on chromosome 4 is close to that reported by Rathje et al. (Reference Rathje, Rohrer and Johnson1997). Yet, QTL effects were rather different in both cases, with mainly additive effects in the present study v. essentially (over)dominance effects in Rathje et al. (Reference Rathje, Rohrer and Johnson1997) and Cassady et al. (Reference Cassady, Johnson, Pomp, Rohrer, Van Vleck, Spiegel and Gilson2001), which suggests that they correspond to different loci or different polymorphisms. Yet, most of our results correspond to new QTL locations. For instance, no QTL had previously been reported for AP on chromosomes 4, 6 and 13, and the QTL in the telomeric region of the long arm of SSC 1 widely differs from that reported by Rohrer et al. (Reference Rohrer, Ford, Wise, Vallet and Christenson1999). Similarly, the ovulation rate QTL detected by Rohrer et al. (Reference Rohrer, Ford, Wise, Vallet and Christenson1999) on SSC 9 and Rathje et al. (Reference Rathje, Rohrer and Johnson1997) on SSC 13 have most likely positions that differ by more than 50 cM from those mapped in the present study, and no QTL for those traits had previously been detected on SSC 5 and SSC 7.
Litter size at birth could not be registered in the present study due to the lack of farrowing facilities. Gilts were slaughtered at 30 days of gestation based on the assumption that differences in litter size at birth between Meishan and Large White breeds are already present at 30 days of gestation. Indeed, results obtained in France clearly showed that the difference in number of embryos at 30 days of gestation between Meishan and Large White was similar to the difference in the number of piglets at birth (Bidanel et al., 1990a). Subsequent British results did not fully agree with French results, but discrepancies were mainly due to differences in ovulation rate (Haley and Lee, Reference Haley and Lee1992), so that the above-mentioned hypothesis can be considered as valid when adjusting for OR. Anyway, 3 of the 4 suggestive QTL detected on NVE in the present study, i.e. those located on SSC 6, 9 and 12, did not correspond to any previously described QTL. Conversely, the SSC 18 QTL detected using HFS model had the same location and rather similar effects (1.2 piglets born alive v. 1.37 embryos) as that recently detected in French Large White and Landrace pig populations (Tribout et al., Reference Tribout, Iannuccelli, Druet, Gilbert, Riquet, Guéblez, Mercat, Bidanel, Milan and Le Roy2008). The QTL detected on ES do not correspond to the single previously published QTL on prenatal survival (King et al., Reference King, Jiang, Gibson, Haley and Archibald2003). Moreover, no reproduction QTL clearly corresponds to the chromosomal regions where reproduction candidate genes have been detected (Buske et al., Reference Buske, Sternstein and Brockmann2006). Indeed, two potential candidate genes for litter size, i.e. the leptin receptor gene and the α-1,2-fucosyltransferase, are located on chromosome 6, but they are both at about 20 cM from the most likely position of the QTL affecting NVE located on this chromosome. Another candidate, i.e. the leptin gene located on chromosome 18, is close to the most likely position of the QTL affecting ES, but at more than 20 cM from that of the QTL identified for NVE.
Though the Meishan breed is known to have better reproductive performances than Large White, several favourable Large White alleles were detected in this study. This result is not exceptional, as the so-called ‘cryptic’ alleles were also detected for several other traits in this same experiment (Bidanel et al., Reference Bidanel, Milan, Iannuccelli, Amigues, Boscher, Bourgeois, Caritez, Gruand, Le Roy, Lagant, Quintanilla, Renard, Gellin, Ollivier and Chevalet2001; Milan et al., Reference Milan, Bidanel, Iannuccelli, Riquet, Amigues, Boscher, Bourgeois, Caritez, Gruand, Le Roy, Lagant, Quintanilla, Renard, Gellin, Ollivier and Chevalet2002) or in many other experiments (Bidanel and Rothschild, Reference Bidanel and Rothschild2002). Several hypotheses, such as random drift, selection effects on pleiotropic or linked QTL, or epistatic gene interactions can be proposed to explain this phenomenon. It may be of great interest for selection if favourable Large White for both reproduction and reproduction traits can be mapped in the same chromosomal region.
Very simple genetic models were used in this first study. Additional analyses would be of interest to test more complex models such as models including parent-of-origin effects or interactions between QTL. Such interactions are very likely for traits depending on complex physiological pathways such as reproductive traits. They have recently been investigated in an F2 cross between Iberian and Meishan pig breeds by Noguera et al. (2006), who demonstrated using bi-dimensional genome-wide scan the existence of a wide array of highly significant epistatic QTL. It may also be argued that NVE and ES depend not only on the sow genotype but also on the sire/embryo genotypes. The impact of ignoring these genotypes should however be limited. Preliminary statistical analyses clearly showed that litter sire had a limited contribution on NVE and ES variation. The effect of embryo genotype could not be tested, but most studies tend to show that it is much lower than the effect of sow genotype (e.g. Rothschild and Bidanel, Reference Rothschild and Bidanel1998).
Several chromosomal regions affecting reproductive traits have also been shown to affect growth and carcass traits (i.e. SSC 1, 4, 6, 7 and 13). These linkages or pleiotropies are likely to have consequences for marker-assisted selection programmes, particularly in Chinese × European synthetic populations where the application of QTL results is the most straightforward. Selection will be easy if the same alleles/haplotypes have favourable effects on the different traits of interest, but much more difficult in the case of antagonistic associations. It may be of interest, particularly in this latter case, to distinguish linkages from pleiotropies in order to know whether there is any possibility of breaking down the unfavourable associations. More complex multivariate models can be used to test the hypothesis of linkage v. pleiotropy, as recently shown by Gilbert et al. (Reference Gilbert, Bidanel, Milan and Le Roy2007). Increasing the accuracy of QTL location through fine-mapping programmes using recombinant backcrosses and/or highly dense sets of SNP markers in different populations would also be helpful to answer such questions and increase the efficiency of marker-assisted selection.
Conclusions
This study demonstrates that the genetic variation of teat number and reproductive traits is governed by a large number of loci with low to moderate effects. It also shows that even in highly divergent breeds such as Meishan and Large White, most QTL alleles are not fixed in grand-parental populations. Moreover, several QTL fall in the same chromosomal regions as QTL influencing other economically important traits. This situation is likely to have important consequences on the efficiency of marker-assisted selection programmes in pig populations.
Acknowledgements
This experimental programme has been funded by the European Union (Bridge and Biotech+ programmes), INRA (Department of Animal Genetics and AIP ‘structure des génomes animaux’) and the ‘Groupement de recherches et d’études sur les génomes’.
The thesis work of A. Rosendo is funded by the Consejo Nacional de Ciencia y Tecnologia (CONACyT) and the Secretaria de Educacion Publica, Programa de Becas Complemantarias, México.