INTRODUCTION
The predominant feature of the last glacial period is its high degree of climatic variability on a millennial scale, as observed in the high-amplitude changes in temperature (Dansgaard-Oeschger [D-O] events), atmospheric circulation, and methane concentration recorded in Greenland ice cores (e.g., Dansgaard et al., Reference Dansgaard, Johnsen, Clausen, Dahl-Jensen, Gundestrup, Hammer and Hvidberg1993; Grootes et al., Reference Grootes, Stuiver, White, Johnsen and Jouzel1993; Mayewski et al., Reference Mayewski, Meeker, Twickler, Whitlow, Yang, Lyons and Prentice1997; Blunier and Brook, Reference Blunier and Brook2001). However, a lack of ice records during older ice ages in Greenland hinders our understanding of millennial-scale climatic variability during the penultimate glacial period (Marine Isotope Stage [MIS] 6). At present, temperature records derived from Antarctic ice cores span the past eight glacial cycles (EPICA Community Members, 2004; Jouzel et al., Reference Jouzel, Masson-Delmotte, Cattani, Dreyfus, Falourd, Hoffmann and Minster2007) and show a sequence of millennial-scale oscillations corresponding to D-O events during the last glacial period through a bipolar seesaw mechanism (Stocker and Johnsen, Reference Stocker and Johnsen2003; EPICA Community Members, 2006; WAIS Divide Project Members, 2015). Based on this correlation, Barker et al. (Reference Barker, Knorr, Edwards, Parrenin, Putnam, Skinner, Wolff and Ziegler2011) reconstructed a synthetic Greenland temperature record for the past 800 ka. However, that synthetic record has been challenged, because the observed regional variability in high-resolution Antarctic records cannot be explained by the seesaw model (Landais et al., Reference Landais, Masson-Delmotte, Stenni, Selmo, Roche, Jouzel and Lambert2015). In addition, the synthetic record failed to depict the details of relatively small events (Barker et al., Reference Barker, Knorr, Edwards, Parrenin, Putnam, Skinner, Wolff and Ziegler2011). Thus, precisely dated high-resolution geological records obtained in the Northern Hemisphere for the penultimate glaciation are particularly relevant. Constrained by the high-precision U-Th chronology, stalagmite δ18O records in the Asian monsoon (AM) region are widely applied to reconstruct past hydroclimatic variability (e.g., Cheng et al., Reference Cheng, Edwards, Sinha, Spotl, Yi, Chen and Kelly2016). Given the strongly coupled millennial-scale changes between the AM and the polar region climates (Wang et al., Reference Wang, Cheng, Edwards, An, Wu, Shen and Dorale2001; Burns et al., Reference Burns, Fleitmann, Matter, Kramers and Al-Subbary2003; Chen et al., Reference Chen, Wang, Cheng, Edwards, Wang, Kong and Liu2016; W. Duan et al., Reference Duan, Cheng, Tan and Edwards2016a), stalagmite archives in the AM region are potential candidates to decipher millennial-scale variability during MIS 6. Several δ18O profiles from Hulu Cave display a series of millennial-scale strong AM events during the past two glacial periods (termed Chinese interstadials, or CIS events) (Wang et al., Reference Wang, Cheng, Edwards, An, Wu, Shen and Dorale2001; Cheng et al., Reference Cheng, Edwards, Wang, Kong, Ming, Kelly, Wang, Gallup and Liu2006). However, due to relatively low signal-to-noise ratios, CIS events in MIS 6.3 are expressed with muted amplitudes (Cheng et al., Reference Cheng, Edwards, Wang, Kong, Ming, Kelly, Wang, Gallup and Liu2006). Subsequent studies from several caves in the AM region also show a muted amplitude of δ18O oscillations (Kelly et al., Reference Kelly, Edwards, Cheng, Yuan, Cai, Zhang, Lin and An2006; Wang et al., Reference Wang, Cheng, Edwards, Kong, Shao, Chen, Wu, Jiang, Wang and An2008; T. Li et al., Reference Li, Shen, Huang, Jiang, Yang, Mii, Lee and Lo2014; Cai et al., Reference Cai, Fung, Edwards, An, Cheng, Lee and Tan2015; Kathayat et al., Reference Kathayat, Cheng, Sinha, Spötl, Edwards, Zhang and Li2016). Thus, new cave records are needed to provide insights into millennial-scale variability during MIS 6.
Compared with a proxy of δ18O, δ13C has often been neglected or underutilized in interpreting paleoenviroments in many studies of Chinese stalagmites. However, the δ13C proxy is likely more sensitive to climatic changes (Frappier et al., Reference Frappier, Sahagian, González and Carpenter2002). For example, the sequence of D-O events is more clearly depicted in the stalagmite δ13C than in the δ18O record in western Europe (Genty et al., Reference Genty, Blamart, Ouahdi, Gilmour, Baker, Jouzel and Van-Exter2003). The calcite δ13C is primarily controlled by changes in δ13C of soil CO2, which is mainly derived from microbial and vegetation activity (e.g., soil organic matter decomposition and root/rhizosphere respiration). Thus, different plants (C3 or C4 plants) and vegetation density changes will significantly influence δ13C values of soil CO2 (Dorale et al., Reference Dorale and Gonzalez1992, Reference Dorale, Edwards, Ito and González1998; Genty et al., Reference Genty, Blamart, Ouahdi, Gilmour, Baker, Jouzel and Van-Exter2003). Stalagmite δ13C values are also influenced by inorganic processes in the vadose zone. In situations where soil-water residence time is relatively short, the percolating water may not reach complete isotopic equilibrium with soil CO2 (isotopically lighter) and may retain a component of atmospheric CO2 (isotopically heavier), which likely results in higher stalagmite δ13C values (Baker et al., Reference Baker, Ito, Smart and McEwan1997). If this mechanism dominates, the high δ13C values are likely related to wetter periods with significantly increasing rainfall (Bar-Matthews et al., Reference Bar-Matthews, Ayalon, Kaufman and Wasserburg1999, Reference Bar-Matthews, Ayalon and Kaufman2000; Plagnes et al., Reference Plagnes, Causse, Genty, Paterne and Blamart2002). In addition, disequilibrium isotope effects also affect stalagmite δ13C values. Evaporation, active ventilation and low drip rate may favor CO2 degassing when calcites are deposited, causing elevated δ13C values (Spötl et al., Reference Spötl, Fairchild and Tooth2005; Deininger et al., Reference Deininger, Fohlmeister, Scholz and Mangini2012; Dreybrodt and Deininger Reference Dreybrodt and Deininger2014; Meyer et al., Reference Meyer, Feng, Breecker, Banner and Guilfoyle2014).
Kong et al (Reference Kong, Wang, Wu, Cheng, Edwards and Wang2005) reported stalagmite δ13C profiles spanning the last glacial period from Hulu Cave that show millennial oscillations individually corresponding to CIS events imprinted in the δ18O profiles. Thus, the stalagmite δ13C record from Hulu Cave may be a candidate to capture millennial-scale variability during MIS 6.3. Here, we present new continuous δ18O and δ13C profiles of multidecadal time resolutions on average from a stalagmite sample in Hulu Cave that was deposited during the late MIS 6. We suggest the significance of the δ13C of stalagmite as a potential climatic proxy that bring insights into millennial-scale variability during MIS 6.3. In addition, we perform global comparisons among paleoclimatic records to infer possible intraregional linkages of abrupt climatic fluctuations surrounding Termination II.
REGIONAL SETTINGS
Hulu Cave (32°30′N, 119°10′E) is located ~28 km east of Nanjing City in eastern China (Fig. 1a), and its geological setting has been described in previous studies (e.g., Wang et al., Reference Wang, Cheng, Edwards, An, Wu, Shen and Dorale2001; Cheng et al., Reference Cheng, Edwards, Wang, Kong, Ming, Kelly, Wang, Gallup and Liu2006; F. Duan et al., Reference Duan, Wu, Wang, Edwards, Cheng, Kong and Zhang2015). The area is strongly influenced by a subtropical monsoon climate, and the current meteorological conditions are dominated by distinct seasonal changes in temperature and precipitation. Based on 30 yr (1981–2010) meteorological data from Nanjing City (Fig. 1b; http://data.cma.cn), the mean annual precipitation at the site is 1090 mm, with ~50% falling between June and August, and the mean annual surface temperature is 15.9°C, with the maximum temperature observed in July (28.1°C) and the minimum temperature observed in January (2.7°C).
Locations of Hulu, Sanbao, and Dongge Caves (a), monthly precipitation and average air temperature at Nanjing City from 1981 to 2010 (http://data.cma.cn) (b), and schematic map of Hulu Cave (c). The positions of drip sites (black dots) and stalagmite HL162 (black star) are shown in (c).

Hulu Cave is overlain by 30–40 m of Ordovician limestone, and the overlying vegetation is predominantly woody perennial plants and shrub grass. Currently, the cave has two entrances, with an artificial entrance opened in 1995 when it became a tourist attraction (Fig. 1c). Modern monitoring data from January to June 2016 show that the CO2 concentration, temperature, and relative humidity inside the cave range from 396 to 515 ppm, 9.7°C to 18.6°C and 60.8% to 100%, respectively.
MATERIALS AND METHODS
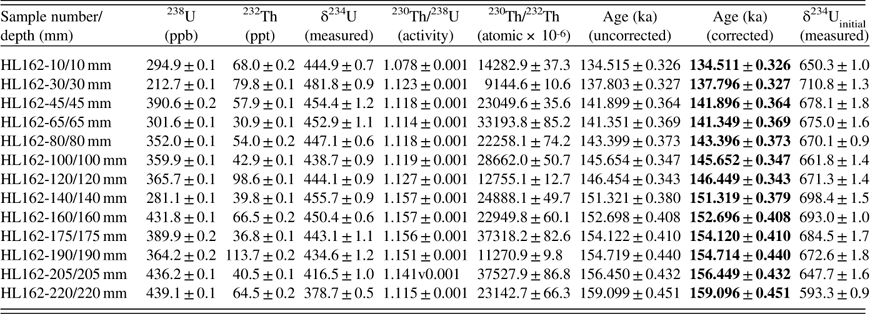
Stalagmite HL162, approximately 232 mm in length, was found broken in Hulu Cave, and its original position is only approximately known (Fig. 1c). After the stalagmite was halved and polished, 13 subsamples of 70–140 mg each were collected for U-Th dating. The positions where subsamples were collected for U-Th dating are shown in Figure 2a. The procedures employed for chemical separation and purification of uranium and thorium are similar to those described in Shao et al. (Reference Shao, Pons-Branchu, Zhu, Wang, Valladas and Fontugne2017), and the uranium and thorium contents and isotopic compositions were determined via multicollector inductively coupled plasma mass spectrometric techniques using a Fisher Thermo-Neptune spectrometer at the College of Geography Science, Nanjing Normal University, China (Shao et al., Reference Shao, Pons-Branchu, Zhu, Wang, Valladas and Fontugne2017). The dating results are listed in Table 1 with typical analytical errors (2σ).
(color online) Polished section (a) and age model (b) of stalagmite HL162. The black bars in profile (a) represent the positions of U-Th dates. In b, the black line shows the age model using the algorithm method of MOD-AGE (Hercman and Pawlak, Reference Hercman and Pawlak2012) with 95% confidence intervals (dashed lines).

230Th dating results for sample HL162 from Hulu Cave, eastern China.Footnote a

a Errors are 2σ analytical errors. Decay constant values are λ230 = 9.1705 × 10⁻⁶/yr, λ234 = 2.82206 × 10⁻⁶/yr, and λ238 = 1.55125 × 10⁻¹⁰/yr. The 230Th ages were corrected with assumption of an initial 230Th/232Th atomic ratio of (4.4 ± 2.2) × 10−6. The corrected ages are indicated in bold and are given at the “cal BP” scale, before AD 1950.
A total of 456 subsamples were collected for the stable isotopic analysis along the growth axis. The spatial resolution varied from 0.5 mm to 1 mm. The analysis was conducted using a Finnigan-MAT 253 mass spectrometer fitted with a Kiel Carbonate Device at the College of Geography Science, Nanjing Normal University, China. Isotopic results were reported relative to the Vienna Pee Dee Belemnite (VPDB). The internal standard samples were calibrated by an international standard (NBS 19) and analyzed every ~12 samples, and the precision was better than 0.06‰ for δ18O and 0.05‰ for δ13C at the 1-sigma level.
To help interpret the stalagmite stable isotope records from Hulu Cave, we collected cave water samples under several stalactites monthly from January to July 2016, and the drip sites are shown in Figure 1c. Due to the restrictions of the tourist attraction, we had to stop collecting drip-water samples after July 2016. Drip-water samples were collected in a 500 ml high-density polyethylene bottle that was placed under the drip site for 1 or 2 days to collect sufficient water for analysis. Subsamples for δ18O and δD analysis were stored in precleaned 8 ml glass-sealed bottles. The bottles were filled to the top to avoid headspace. To minimize evaporation before analysis, all drip-water subsamples were refrigerated. The δ18O and δD analyses of the rainwater and cave drip water were performed using a Finnigan-MAT 253 plus mass spectrometer fit with a Gasbench II and a Flash EA/HT at Beijing Createch Testing Technology, China. The water isotope results are reported relative to the Vienna Standard Mean Ocean Water. The national standard samples (GWB04401–GWB04404) were analyzed every ~10 samples, and the precision was better than 0.1‰ for δ18O and 1.0‰ for δD at the 1-sigma level.
RESULTS
Age model
The calcite shows 238U concentrations of 210–440 ppb and low 232Th concentrations of 30–115 ppt (Table 1). For all subsamples, correction for detrital thorium resulted in only small shifts in the ages (1–7 yr) (Table 1). The age versus depth plot shows all 230Th ages are in stratigraphic order within typical errors ranges of 320–450 yr (Fig. 2b; Table 1). The modeled age, developed using an algorithm approach (MOD-AGE; Hercman and Pawlak, Reference Hercman and Pawlak2012), was applied in this study, revealing that sample HL162 grew during the late MIS 6 (160.6–132.5 ka) (Fig. 2b). The temporal resolution of the final modeled stable isotope interval averages 62 yr (within a range of 15–154 yr).
Stable isotope results
The δ18O variability of HL162 (Fig. 3a), ranging from −8.5‰ to −4.0‰, is characterized by an abrupt negative transition at the beginning (~159.5 ka) and presents an amplitude of ~1.5‰, which corresponds to the onset of MIS 6.3. After this jump, the δ18O values become persistently lighter until they reach a peak at ~145.0 ka. The subsequent dramatic shift toward heavier values by ~3‰ is coeval with the transition to MIS 6.2. The δ13C profile varies from −7.4‰ to −3.1‰ (Fig. 3b), and the transition between MIS 6.3 and 6.2 is characterized by positive shifts with an amplitude of ~1.5‰ from 142.1 to 141.5 ka.
(color online) δ18O (a) and δ13C (b) profiles of stalagmite HL162 from Hulu Cave. The dating errors are also indicated. The δ18O scale is reversed for comparison.

Superimposed on the long-term trend, the δ18O and δ13C profiles generally show antiphase millennial-scale oscillations (Fig. 3). The δ18O profile is relatively stable with weak millennial-scale oscillations during the early MIS 6.3 (160–152 ka), whereas millennial-scale negative shifts are significant with amplitudes of ~0.5‰ to 1‰ from 152 to 142 ka. During MIS 6.2, the δ18O shows a negative plateau with high-frequency (several hundred years) oscillations from 139 to 136 ka and an abrupt negative shift with an amplitude of >2‰ at ~134 ka. In the δ13C profile, millennial-scale oscillations are also relatively weak with positive shifts of ~0.8‰ during early MIS 6.3 and have larger amplitudes of ~1‰ to 2‰ and a pattern of an abrupt onset following a relatively slow ending from 150 to 142 ka. During MIS 6.2, the high-frequency oscillations from 139 to 136 ka in the δ18O profile are also recorded by δ13C but have relatively weak amplitudes, and an abrupt positive shift at ~134 ka is also significant with an amplitude of >2‰, which corresponds to the δ18O negative shift at the same time.
The δ18O values for 27 drip-water samples range from −9.7‰ to −6.5‰ (Fig. 4). Based on δ18O and δD data from 1987 to 1992 in Nanjing City (http://www.iaea.org), the local meteoric water line (LMWL) is established using the following equation: δD = 8.5 × δ18O + 17.7. The stable isotopic compositions of all drip water from Hulu Cave plot close to or slightly below the LMWL (Fig. 4a), which implies that their oxygen isotopic compositions reflect the composition of meteoric water above the cave (Caballero et al., Reference Caballero, Jiménez De Cisneros and Reyes1996; Cruz et al., Reference Cruz, Karmann, Viana, Burns, Ferrari, Vuille, Sial and Moreira2005; Pape et al., Reference Pape, Banner, Mack, Musgrove and Guilfoyle2010; W. Duan et al., Reference Duan, Ruan, Luo, Li, Tian, Zeng and Zhang2016b). The cave drip water plotting slightly below the LMWL may have experienced evaporative effects before collection (Pape et al., Reference Pape, Banner, Mack, Musgrove and Guilfoyle2010; W. Duan et al., Reference Duan, Ruan, Luo, Li, Tian, Zeng and Zhang2016b). The meteoric water δ18O data between 1987 and 1992 from the Global Network for Isotopes in Precipitation were averaged monthly, and the averaged values show significant seasonal variability (Fig. 4c). The most negative values of the meteoric water δ18O are observed during June, July, and August, and they are synchronous with the highest precipitation (Fig. 4c and d). The most predominant δ18O decrease of 5.1‰ occurs from May to June (Fig. 4c), when the AM significantly strengthens. The drip-water δ18O is relatively static from January to June 2016 (Fig. 4b) and has an average value of −7.4‰ for all drip sites. From June to July 2016, the drip-water δ18O of drip sites 1-3, 2, and 3 decreased abruptly by 0.8 to 3.1‰ (Fig. 4b). This abrupt shift likely corresponds to the predominant meteoric water δ18O decreasing from May to June, suggesting that the drip-water δ18O in Hulu Cave will inherit the seasonal variability of the meteoric water δ18O with a lag of less than 1 month.
(color online) Drip-water stable isotopic compositions from Hulu Cave plotting on the local meteoric water line (LMWL) (red) with 95% confidence intervals (dashed lines) based on δ18O and δD data from 1987 to 1992 in Nanjing City from the Global Network for Isotopes in Precipitation (GNIP; http://www.iaea.org) (a), and comparison among the drip-water δ18O (b) from this study and monthly average δ18O (c) and precipitation (d) from GNIP data. The global meteoric water line (GMWL) is also shown (gray). The gray bar indicates the most predominant δ18O decrease in the drip-water δ18O profile from Hulu Cave and the monthly average δ18O profile from GNIP data. VSMOW, Vienna Standard Mean Ocean Water. (For interpretation of the references to color in this figure legend, the reader is referred to the web version of this article.)

DISCUSSION
Interpretation of the δ18O and δ13C signals
A high degree of similarity between the δ18O records from Hulu Cave and other caves (Fig. 5) indicates that strong kinetic isotopic effects did not occur when the calcite was deposited (Dorale and Liu, Reference Dorale and Liu2009). Because of the fidelity of drip water to meteoric water δ18O signals, the key to interpreting stalagmite δ18O records of Hulu Cave is understanding the factors controlling the rainwater δ18O signals. Figure 5 shows that the δ18O from Hulu Cave has a more sensitive response to rainwater δ18O signals. For example, the millennial-scale events are more clearly depicted in Hulu records when compared with those from Sanbao and Dongge Caves (Fig. 5). In particular, events depicted in Hulu records show high-frequency oscillations from 139 to 133 ka, while those in Sanbao and Dongge are relatively muted (Fig. 5). Following the reasoning of Wang et al. (Reference Wang, Cheng, Edwards, An, Wu, Shen and Dorale2001), Cheng et al. (Reference Cheng, Edwards, Wang, Kong, Ming, Kelly, Wang, Gallup and Liu2006), and F. Duan et al. (Reference Duan, Wu, Wang, Edwards, Cheng, Kong and Zhang2015), we interpret the lighter δ18O values of HL162 to reflect stronger AM intensity, and vice versa. This interpretation is also supported by the climatic model (Liu et al., Reference Liu, Wen, Brady, Otto-Bliesner, Yu, Lu and Cheng2014). However, the δ18O is likely influenced by more complicated factors (e.g., Dayem et al., Reference Dayem, Molnar, Battisti and Roe2010) such as moisture sources (Maher, Reference Maher2008; Pausata et al., Reference Pausata, Battisti, Nisancioglu and Bitz2011; Maher and Thompson, Reference Maher and Thompson2012), atmospheric circulation (Tan, Reference Tan2014), and winter temperature (Clemens et al., Reference Clemens, Prell and Sun2010).
(color online) Comparison of the HL162 δ18O record with other stalagmite records from the Asian monsoon region. (a) δ18O record for HL162 (this study) with summer (July 21) insolation at 65°N (gray) (Laskar et al., Reference Laskar, Robutel, Joutel, Gastineau, Correia and Levrard2004). (b and c) δ18O records for MSP (b) and MSX (c) from Hulu Cave (Cheng et al., Reference Cheng, Edwards, Wang, Kong, Ming, Kelly, Wang, Gallup and Liu2006). (d and e) δ18O records for SB11 from Sanbao Cave (d) (Wang et al., Reference Wang, Cheng, Edwards, Kong, Shao, Chen, Wu, Jiang, Wang and An2008) and D4 from Dongge Cave (e) (Kelly et al., Reference Kelly, Edwards, Cheng, Yuan, Cai, Zhang, Lin and An2006). The labels indicate Chinese interstadials (CIS events). The dating errors of all records are also indicated. (For interpretation of the references to color in this figure legend, the reader is referred to the web version of this article.)

In our δ13C record, one of the most significant features is the positive shift (~1.5‰) from 142.1 to 141.5 ka at the transition between MIS 6.3 and MIS 6.2; after this shift, the δ13C maintained relatively high values (Fig. 3b). During the transition, the δ18O is also dramatically enriched (~2.5‰) (Fig. 3a), indicating a weakening of the AM intensity. In addition, the global ice volume reached its maximum (Rohling et al., Reference Rohling, Hibbert, Williams, Grant, Marino, Foster and Hennekam2017) and global temperature significantly decreased (Jouzel et al., Reference Jouzel, Masson-Delmotte, Cattani, Dreyfus, Falourd, Hoffmann and Minster2007) during this period. All of these could cause changes in vegetation, that is, a transition from C3 plants to C4 plants and/or a decrease in vegetation density around Hulu Cave. More C4 plants would cause elevated δ13C values of soil CO2. A decrease in vegetation density would depress microbial and vegetation activity, resulting in a relatively low contribution of biogenic CO2 and consequently higher δ13C values of soil CO2. Thus, the positive shift of stalagmite δ13C at the transition from MIS 6.3 to MIS 6.2 indicates vegetation changes around Hulu Cave.
In addition, the δ13C record shows a sequence of millennial-scale positive excursions, which are concurrent with negative excursions in the δ18O profile (Fig. 3), especially for MIS 6.3 (Fig. 6a and b). Vegetation changes above the cave would be ruled out as the primary cause for the high-frequency variation in δ13C and the negative correlation between δ13C and δ18O. A negative correlation on a millennial scale between δ13C and δ18O is also observed during the last glaciation in different stalagmite records from Hulu Cave (Fig. 6c and d), suggesting that this relationship is a universal phenomenon for Hulu Cave records associated with the specific cave environment. We observe that (1) Hulu Cave is covered by relatively thin soil zone (~30 cm); (2) monitoring site 1-1 only drips on rainy days; and (3) the drip-water δ18O inherits the seasonal variability of the meteoric water δ18O with a lag of less than 1 month (Fig. 4). These observations indicate that cave drip water can quickly respond to precipitation outside the cave. Thus, the increased precipitation amount allows rainwater to infiltrate the cave rapidly, thereby preventing an isotopic equilibrium between the water and the 13C-depleted soil CO2 and resulting in an increase in δ13C in drip water and deposited calcite. This model is also observed in other caves (Baker et al., Reference Baker, Ito, Smart and McEwan1997; Bar-Matthews et al., Reference Bar-Matthews, Ayalon, Kaufman and Wasserburg1999, Reference Bar-Matthews, Ayalon and Kaufman2000; Plagnes et al., Reference Plagnes, Causse, Genty, Paterne and Blamart2002). Thus, we suggest that millennial-scale positive excursions in our δ13C record are linked to increasing summer monsoon rainfall.
(color online) Comparison of Hulu Cave stalagmite δ18O with δ13C records during MIS 6.3 and MIS 3, respectively. (a) δ18O records for HL162 (red; this study) and MSP (gray; Cheng et al., Reference Cheng, Edwards, Wang, Kong, Ming, Kelly, Wang, Gallup and Liu2006). (b) δ13C record for HL162 (this study). (c) δ18O records for MSL (red) and MSD (gray) (Wang et al., Reference Wang, Cheng, Edwards, An, Wu, Shen and Dorale2001). (d) δ13C records for MSL (green) and MSD (gray) (Kong et al., Reference Kong, Wang, Wu, Cheng, Edwards and Wang2005). (e and f) Detrended δ18O and δ13C records for MSL and HL162. The light orange bars indicate Chinese interstadials (CIS events). Three extra CIS events (B.4.1, B.8.1, and B.10.1) centered at 154.8 ka, 150.3 ka, and 143.5 ka are identified in the δ13C record for HL162. Note that the scale ranges of detrended δ18O and δ13C records are the same for MSL and HL162, respectively, and the δ18O scale is reversed for comparison. (For interpretation of the references to color in this figure legend, the reader is referred to the web version of this article.)

Furthermore, when comparing detrended δ18O and δ13C profiles, we find that on a millennial scale (CIS events), the amplitudes of δ13C variability (~0.8 to 2‰ for MIS 6.3 and ~2 to 3‰ for MIS 3) are ~1.5 to 2 times those of δ18O (~0.5 to 1‰ for MIS 6.3 and ~1 to 2‰ for MIS 3) (Fig. 6e and f). This relationship is likely reliable due to the evidence from multiple stalagmites and different periods (Fig. 6). Thus, in Hulu Cave, the δ13C can be used as a proxy to reflect CIS events. The higher amplitudes of the δ13C values imply that the δ13C is more sensitive to increasing amounts of precipitation, while the δ18O values are also influenced by other factors (e.g., Dayem et al., Reference Dayem, Molnar, Battisti and Roe2010). Although CIS events during MIS 6.3 have been identified in the Hulu δ18O records, which have a more sensitive response to climatic signals than other cave δ18O records (Fig. 5), our δ13C record further enlarges the climatic signals, allowing clearer characterization of those events (Fig. 6b). In addition, compared with previously published records, the stable isotope records presented here are controlled by a chronology with relatively small uncertainties (Fig. 5). Except for the events previously identified in the δ18O profiles (Cheng et al., Reference Cheng, Edwards, Wang, Kong, Ming, Kelly, Wang, Gallup and Liu2006; Wang et al., Reference Wang, Cheng, Edwards, Kong, Shao, Chen, Wu, Jiang, Wang and An2008; Fig. 5), the δ13C record of HL162 shows three extra positive excursions (CIS B.4.1, B.8.1, and B.10.1) centered at 154.8, 150.3, and 143.5 ka and with amplitudes of >0.8‰ (Fig. 6b).
Millennial-scale AM variations are closely coupled with temperature changes in southern high latitudes through the cross-equatorial airflow (An, Reference An2000; Rohling et al., Reference Rohling, Liu, Roberts, Stanford, Rasmussen, Langen and Siddall2009; Chen et al., Reference Chen, Wang, Cheng, Edwards, Wang, Kong and Liu2016). Thus, we would expect to find equivalents of CIS events in our δ13C record in temperature records from the Southern Hemisphere. Indeed, the weak monsoon event in the δ18O record of HL162, which ended at ~159.5 ka, can be correlated to the corresponding Antarctic warming interval (Fig. 7). Based on this correlation, the eight CIS events in the δ13C profile during MIS 6.3 are concurrent with Antarctic cooling intervals recorded by the Vostok ice core (Fig. 7c). The EPICA (European Project for Ice Coring in Antarctica) Dome C (EDC) ice core also seems to show such variations, albeit with more secondary-order oscillations (Fig. 7d). However, several CIS events have no counterparts in Antarctic ice records. For example, CIS B.10 and CIS B.8.1 are concurrent with the warmest intervals recorded by the Vostok and EDC ice cores, respectively, instead of the cooling intervals (Fig. 7). These offsets may be ascribed to the single δ13C record, which should be further validated, and the differences in Antarctic ice records at this time scale. Nevertheless, the relationship between the CIS events and Antarctic temperature variability further supports the δ13C record from Hulu Cave as a climatic proxy.
(color online) Comparison of stable isotope records of HL162 with Antarctic ice-core records during MIS 6.3 and wavelet analysis of the δ13C record for HL162. (a and b) δ18O (red) and δ13C (green) records for HL162 (this study). (c and d) δD records for the Antarctic Vostok (light blue) and EDC (dark blue) ice cores (Jouzel et al., Reference Jouzel, Masson-Delmotte, Cattani, Dreyfus, Falourd, Hoffmann and Minster2007; Petit et al., Reference Petit, Jouzel, Raynaud, Barkov, Barnola, Basile and Bender1999) at the Antarctic Ice Core Chronology 2012 (AICC2012) time scale (Bazin et al., Reference Bazin, Landais, Lemieux-Dudon, Kele, Veres, Parrenin and Martinerie2013). (e) Wavelet analysis of the δ13C record for HL162. The blue bar indicates a weak monsoon event. The δ18O scales for HL162 and Antarctic ice cores are reversed for comparison. A main cycle of 1.5–2.5 ka is observed in the δ13C record. The data are calculated using the MATLAB wavelet coherence package available at http://noc.ac.uk/marine-data-products/cross-wavelet-wavelet-coherence-toolbox-matlab.VSMOW, Vienna Standard Mean Ocean Water. (For interpretation of the references to color in this figure legend, the reader is referred to the web version of this article.)

Character of CIS events and the forcing mechanisms
CIS events in our δ13C record show a periodicity of 1.5–2.5 ka during MIS 6.3 (Fig. 7e), which is similar to that of the D-O cycles in Greenland ice-core records during the last glaciation (e.g., Grootes and Stuiver, Reference Grootes and Stuiver1997). This observation indicates that the millennial-scale variability is likely reproducible for the older ice ages with a similar frequency (Wang et al., Reference Wang, Cheng, Edwards, Kong, Shao, Chen, Wu, Jiang, Wang and An2008; Y. Li et al., Reference Li, Su, Liang, Ma, Yan and Sun2015). It is suggested that Greenland warmings during the last glaciation were caused by changes in intensity of Atlantic meridional overturning circulation (AMOC) (Lynch-Stieglitz, Reference Lynch-Stieglitz2017), which transports heat from the tropics to the high latitudes. A strong AMOC likely decreases North Atlantic sea-ice cover (C. Li et al., Reference Li, Battisti, Schrag and Tziperman2005), which would result in a northward shift of the Intertropical Convergence Zone over the Atlantic and the Pacific (Chiang and Bitz, Reference Chiang and Bitz2005) and a strengthening of the East Asian summer monsoon through air–sea interactions (Zhang et al., 2005). Although the origin of the climatic cycle remains controversial (Alley et al., Reference Alley, Anandakrishnan and Jung2001; Braun et al., Reference Braun, Christl, Rahmstorf, Ganopolski, Mangini, Kubatzki, Roth and Kromer2005; Lohmann and Ditlevsen, Reference Lohmann and Ditlevsen2018), our data suggest that a common mechanism likely operated during the penultimate glacial period.
From 150 to 142 ka, CIS events in the δ13C record are characterized by an abrupt onset and a relatively slow ending (Fig. 7b). The rapid transitions at the onset of CIS events, which are delimited by annually laminated stalagmites, are also observed during the last glacial period (F. Duan et al., Reference Duan, Liu, Cheng, Wang, Wang, Kong and Chen2014; W. Duan et al., Reference Duan, Cheng, Tan and Edwards2016a). In monsoon dynamics, a rapid transition can be achieved by positive moisture-advection feedback when the AM system reaches a critical threshold (Webster et al., Reference Webster, Magaña, Palmer, Shukla, Tomas, Yanai and Yasunari1998; Lenton et al., Reference Lenton, Held, Kriegler, Hall, Lucht, Rahmstorf and Schellnhuber2008; Levermann et al., Reference Levermann, Schewe, Petoukhov and Held2009; Schewe et al., Reference Schewe, Levermann and Cheng2015).
The pattern of CIS events presented here is reminiscent of Greenland warmings in ice-core records (e.g., Wolff et al., Reference Wolff, Chappellaz, Blunier, Rasmussen and Svensson2010). Given that the abrupt AM changes are forced by climates in North Atlantic regions (Wang et al., Reference Wang, Cheng, Edwards, An, Wu, Shen and Dorale2001; F. Duan et al., Reference Duan, Liu, Cheng, Wang, Wang, Kong and Chen2014; W. Duan et al., Reference Duan, Cheng, Tan and Edwards2016a), our results imply that rapid warming in Greenland would occur during MIS 6.3, most likely through changes in AMOC state when crossing a critical threshold in heat balance between the North and South Atlantic (Ganopolski and Rahmstorf, Reference Ganopolski and Rahmstorf2001; Schmittner et al., Reference Schmittner, Yoshimori and Weaver2002; Cimatoribus et al., Reference Cimatoribus, Drijfhout, Livina and Gerard2013). For the last glacial period, ice-core studies have revealed strong coupling of D-O events in Greenland and the millennial-scale variations in Antarctica through the AMOC (Stocker and Johnsen, Reference Stocker and Johnsen2003; Knutti et al., Reference Knutti, Fluckiger, Stocker and Timmermann2004; EPICA Community Members, 2006; WAIS Divide Project Members, 2015). Based on this thermal bipolar seesaw model, Barker et al. (Reference Barker, Knorr, Edwards, Parrenin, Putnam, Skinner, Wolff and Ziegler2011) reconstructed millennial-scale temperature variability in Greenland for the past 800 ka from Antarctic temperature records, implying a ubiquitous association between bipolar millennial-scale oscillations. Our data support this reconstruction and decipher additional smaller events that were not predicted by Barker et al. (Reference Barker, Knorr, Edwards, Parrenin, Putnam, Skinner, Wolff and Ziegler2011).
Sequence of events surrounding Termination II
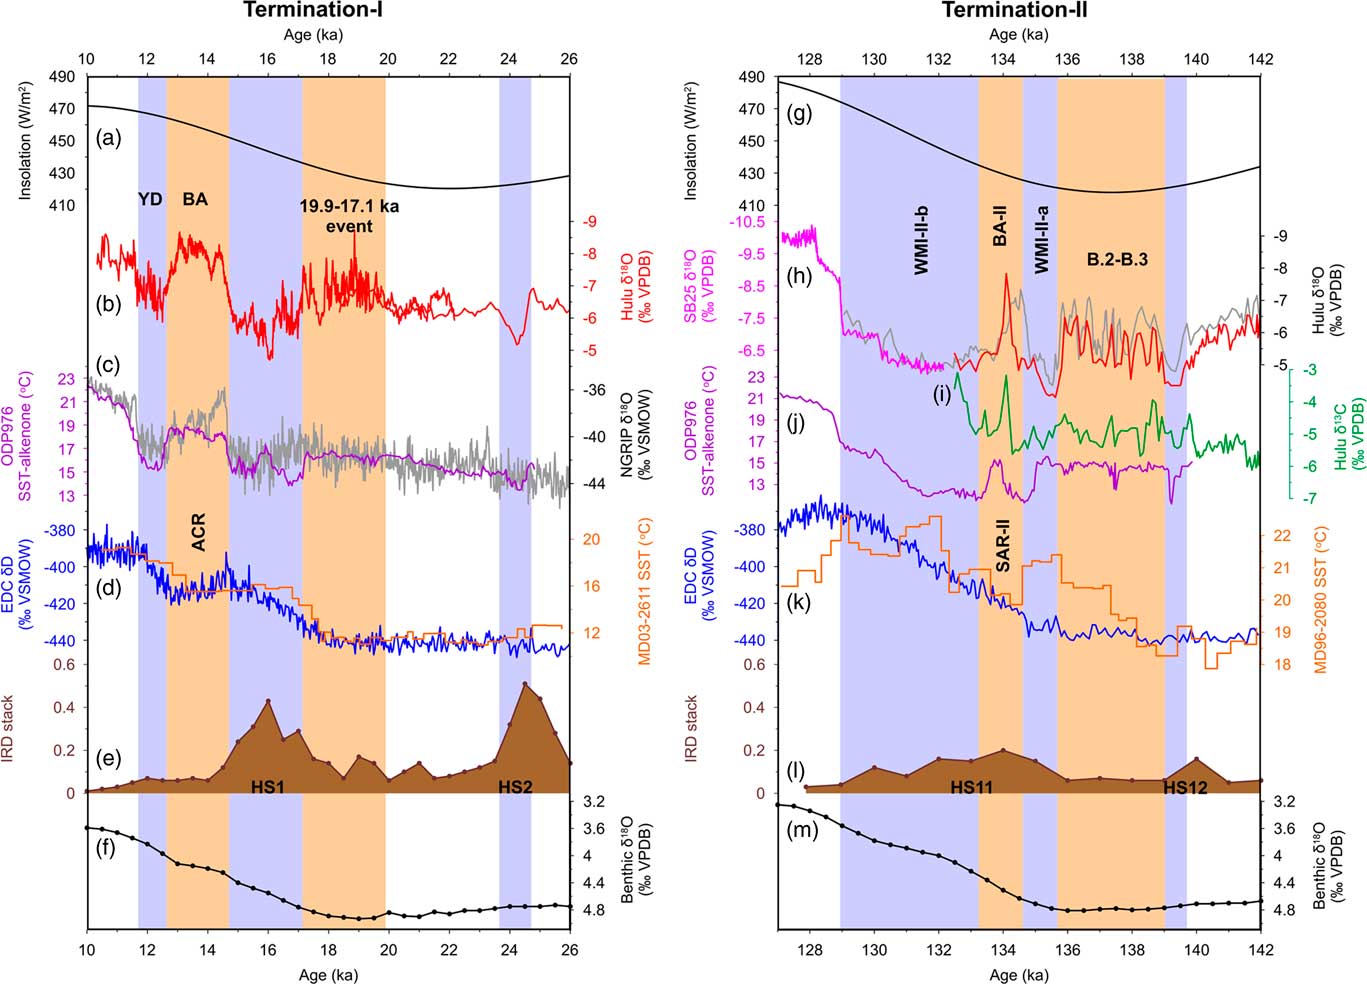
The stalagmite δ18O records in the AM region show two weak monsoon intervals at 139.7–139.0 ka and 135.5–129.0 ka (Fig. 8h), which are concurrent with Heinrich stadial 12 (HS12) and HS11, respectively, identified in ice-rafted-debris (IRD) records from the North Atlantic (Lisiecki and Stern, Reference Lisiecki and Stern2016; Fig. 8l). The IRD events likely resulted in the collapse of the AMOC (Deaney et al., Reference Deaney, Barker and van de Flierdt2017) and an ensuing reduction in the northward heat transport and a southward shift of the ITCZ (Jacobel et al., Reference Jacobel, McManus, Anderson and Winckler2016), consistent with a decrease in sea-surface temperature (SST) in the North Atlantic region (Martrat et al., Reference Martrat, Jimenez-Amat, Zahn and Grimalt2014; Fig. 8j), an increase of temperatures in the Southern Hemisphere (Jouzel et al., Reference Jouzel, Masson-Delmotte, Cattani, Dreyfus, Falourd, Hoffmann and Minster2007; Marino et al., Reference Marino, Zahn, Ziegler, Purcell, Knorr, Hall, Ziveri and Elderfield2013, Reference Marino, Rohling, Rodriguez-Sanz, Grant, Heslop, Roberts, Stanford and Yu2015; Scussolini et al., Reference Scussolini, Marino, Brummer and Peeters2015; Fig. 8k), and weakening of the AM (Fig. 8h). Between HS12 and HS11, the Hulu δ18O records show a strong AM interval with a series of secondary-order oscillations (several hundred years) (CIS B.2–B.3; Fig. 8h). As observed during MIS 6.3, this strong AM interval correlates to a low-temperature interval in Antarctica and a relatively warm period in the North Atlantic region, suggesting an active AMOC, a northward shift of the ITCZ, and a strengthening transfer of cross-equatorial flow to the AM region during this period. Surrounding Termination I, a similar strong AM interval with high-frequency secondary oscillations is also observed between 19.9 and 17.1 ka (Fig. 8b) (Wu et al., Reference Wu, Wang, Cheng and Edwards2009), suggesting a quite unstable monsoon climate before the ice age termination.
(color online) Comparison of paleoclimatic records surrounding Terminations I and II. (a and g) Insolation variability during summer (July 21) at 65°N (Laskar et al., Reference Laskar, Robutel, Joutel, Gastineau, Correia and Levrard2004). (b and h) Stalagmite δ18O records from Hulu Cave (red and gray; this study; Cheng et al., Reference Cheng, Edwards, Wang, Kong, Ming, Kelly, Wang, Gallup and Liu2006; Wang et al., Reference Wang, Cheng, Edwards, An, Wu, Shen and Dorale2001; Wu et al., Reference Wu, Wang, Cheng and Edwards2009) and Sanbao Cave (magenta; Cheng et al., Reference Cheng, Edwards, Broecker, Denton, Kong, Wang, Zhang and Wang2009). (c and j) δ18O record for the North Greenland Ice Core Project (NGRIP) ice core (gray; Andersen et al., Reference Andersen, Svensson, Johnsen, Rasmussen, Bigler, Röthlisberger, Ruth, Siggaard-Andersen, Peder Steffensen, Dahl-Jensen, Vinther and Clausen2006) and SST record from ODP976, western Mediterranean Sea (purple; Martrat et al., Reference Martrat, Jimenez-Amat, Zahn and Grimalt2014). (d and k) δD record for the Antarctic EDC ice core (blue; Jouzel et al., Reference Jouzel, Masson-Delmotte, Cattani, Dreyfus, Falourd, Hoffmann and Minster2007) at an AICC2012 time scale (Bazin et al., Reference Bazin, Landais, Lemieux-Dudon, Kele, Veres, Parrenin and Martinerie2013; Veres et al., Reference Veres, Bazin, Landais and Kele2013) and the sea-surface temperature (SST) records for MD03-2611 from the Murray Canyons area, offshore South Australia (brown; Calvo et al., Reference Calvo, Pelejero, De Deckker and Logan2007) and for MD96-2080 from Agulhas Bank (brown; Marino et al., Reference Marino, Zahn, Ziegler, Purcell, Knorr, Hall, Ziveri and Elderfield2013). (e and l) North Atlantic ice-rafted-debris (IRD) stack in arbitrary units (Lisiecki and Stern, Reference Lisiecki and Stern2016). (f and m) Global benthic δ18O stack (Lisiecki and Stern, Reference Lisiecki and Stern2016). (i) Stalagmite δ13C record from Hulu Cave (this study). Light orange bars indicate Bølling-Allerød (BA) and 19.9–17.1 ka events (Wu et al., Reference Wu, Wang, Cheng and Edwards2009) during Termination I and the BA-like (B-II) and Chinese interstadials (CIS events) B.2–B.3 (Cheng et al., Reference Cheng, Edwards, Wang, Kong, Ming, Kelly, Wang, Gallup and Liu2006) during Termination II. BA is concurrent with the Antarctic cold reversal (ACR). B-II punctuated the weak monsoon interval (WMI; Cheng et al., Reference Cheng, Edwards, Broecker, Denton, Kong, Wang, Zhang and Wang2009) and divided it into WMI-II-a and WMI-II-b, concurrent with the South Atlantic reversal (SAR-II) identified in the SST records from the South Atlantic (Scussolini et al., Reference Scussolini, Marino, Brummer and Peeters2015). Light blue bars indicate the weak monsoon intervals, including the Younger Dryas event (YD); HS1 and HS2 surrounding Termination I; and WMI-II-a, WMI-II-b, and HS12 surrounding Termination II. (For interpretation of the references to color in this figure legend, the reader is referred to the web version of this article.)

Cheng et al. (Reference Cheng, Edwards, Wang, Kong, Ming, Kelly, Wang, Gallup and Liu2006) reported an abrupt AM event at ~134 ka, the strength of which is more than one-half the amplitude of the transition to MIS 5 (Fig. 8h), and our δ13C record also captures this event (Fig. 8i). However, such an event in Dongge and Sanbao Caves appears with relatively small amplitudes (Kelly et al., Reference Kelly, Edwards, Cheng, Yuan, Cai, Zhang, Lin and An2006; Wang et al., Reference Wang, Cheng, Edwards, Kong, Shao, Chen, Wu, Jiang, Wang and An2008). Within dating errors, a number of synchronous changes were widely reported, including a temperature rebound in the North Atlantic region (Martrat et al., Reference Martrat, Jimenez-Amat, Zahn and Grimalt2014; Marino et al., Reference Marino, Rohling, Rodriguez-Sanz, Grant, Heslop, Roberts, Stanford and Yu2015; Fig. 8j), an analog in flowstone δ18O profile from southern Hungary (Koltai et al., Reference Koltai, Spötl, Shen, Wu, Rao, Palcsu, Kele, Surányi and Bárány-Kevei2017), and an SST decrease in the South Atlantic (termed the South Atlantic reversal) (Scussolini et al., Reference Scussolini, Marino, Brummer and Peeters2015; Fig. 8k). According to a common forcing mechanism for ice age terminations (Cheng et al., Reference Cheng, Edwards, Broecker, Denton, Kong, Wang, Zhang and Wang2009; Broecker et al., Reference Broecker, Denton, Edwards, Cheng, Alley and Putnam2010), this AM event, characterized by a high amplitude and a short duration (300–400 yr), could be regarded as a BA-like event (BA-II; Fig. 8h), supporting the idea that the past two ice age terminations (Terminations I and II) would be of similar structure (Cheng et al., Reference Cheng, Edwards, Broecker, Denton, Kong, Wang, Zhang and Wang2009; Broecker et al., Reference Broecker, Denton, Edwards, Cheng, Alley and Putnam2010). To date, its counterpart has not been seen to be clearly expressed in the Antarctic ice records (Fig. 8k), probably because this event is relatively minor and largely linked to transient oceanic changes (Cortese and Abelmann, Reference Cortese and Abelmann2002).
CONCLUSIONS
A U-Th-dated high-resolution reconstruction based on a stalagmite (HL162) from Hulu Cave in eastern China was used to establish an AM history during the late MIS 6. The positive shift (~1.5‰) in the δ13C profile during the transition from MIS 6.3 to MIS 6.2 is likely caused by changes in surface vegetation (i.e., more C4 plants and/or a decrease in vegetation density), which are associated with the weakening AM and decreased global temperature when the global ice volume reached its maximum. On a millennial scale, the higher δ13C values are concurrent with lower δ18O values, indicating incomplete isotopic equilibrium between percolating water and soil CO2 due to increasing rainfall associated with the stronger AM. Thus, we interpret the millennial-scale positive excursions of δ13C to reflect a stronger AM state. Based on this interpretation, the strong AM events during MIS 6.3 could be one-to-one correlated to low-temperature intervals in Antarctic ice cores. The character of D-O events in ice-core records during the last glacial has been well expressed in our δ13C record, with a periodicity of 1.5–2.5 ka. Thus, abrupt warmings at Greenland predicted by the bipolar seesaw model would extend back to the penultimate glacial period. Our data suggest that the millennial-scale AM events during the penultimate glacial period are likely forced by high northern latitude climate via north–south shifts in the ITCZ associated with the thermal bipolar seesaw model. We further suggest that an abrupt, strong AM event (~134 ka) surrounding Termination II is likely analogous to the Bølling-Allerød event, and the past two ice age terminations may share a similar structure.
ACKNOWLEDGMENTS
We are grateful to Ming Tan and Wu-hui Duan for their help in sampling the drip water in Hulu Cave. We are also grateful to the two anonymous reviewers for their detailed and very helpful comments, which have helped improve this paper substantially. This work was supported by grants from the National Nature Science Fund of China (grant no. 41571102, 41572151, 41672164, and 41130210), the Priority Academic Program Development of Jiangsu Higher Education Institutions (no. 164320H116), the Jiangsu Center for Collaborative Innovation in Geographical Information Resource Development and Application, and the Postgraduate Research and Practice Innovation Program of Jiangsu Province (nos. KYCX17_1063 and KYLX15_0750).