Nanoporous Pt is a common electrode material for research on low-to-moderate temperature (e.g. ≤550 °C) solid oxide fuel cell (SOFC) devices. However, a major difficulty associated with nanoporous Pt electrodes, even at low temperatures, is the tendency for grain coarsening and film break-up on the surface of electrolytes such as yttria-stabilized zirconia (YSZ).[Reference Kim, Hsu, Connor, Gür, Cui and Prinz:1–Reference Ryll, Galinski, Schlagenhauf, Elser, Rupp, Bieberle-Hutter and Gauckler6] These morphological changes can result in severe loss of triple-phase boundaries (TPBs – regions where gas, electrolyte, and electrode coexist), which in turn increases the activation loss and overpotential required to run the fuel cell. At low-to-moderate temperature, slow cathode kinetics tend to limit the performance of SOFCs, and high TPB area is a key structural feature for efficient O2 reduction and oxygen ion incorporation into the electrolyte at the cathode side of the cell.[Reference Ryll, Galinski, Schlagenhauf, Elser, Rupp, Bieberle-Hutter and Gauckler6–Reference Ryll, Galinski, Schlagenhauf, Rechberger, Ying, Gauckler, Mornaghini, Ries, Spolenak and Döbeli8]
We fabricated SOFCs with nanoporous Pt electrodes and investigated the evolution of electrode morphology during operation. Device performance was correlated with changes in Pt morphology during SOFC testing. To the best of our knowledge, this is the first study presenting the time-evolution and performance of nanoporous Pt electrodes at various SOFC operating temperatures. In addition, a simple gas pretreatment was found to lead to immediate, significant, and repeatable enhancement of SOFC power density.
YSZ SOFC devices were fabricated using commercially available polycrystalline 8-YSZ substrates (8 mol% Y2O3 Ceraflex by Marketech Intl., Inc.) and DC-sputtered, nanoporous platinum electrodes. Prior to electrode deposition, each 100-μm-thick, 25 mm × 25 mm YSZ substrate was treated with oxygen plasma for 1 min on each side to remove any carbonaceous residue left over from the original substrate fabrication process. Immediately thereafter, the substrate was placed in a DC sputtering system for electrode deposition. Each cathode and anode consisted of a 115-nm-thick layer of nanoporous Pt, and was sputtered at room temperature under 10.0 Pa of argon pressure and 50 W power for 150 s. While the anode was blanket-deposited, the cathode was 11 mm × 11 mm in area, positioned at the center of the YSZ substrate, and thus defined the active area (and the reported current densities) of the SOFCs. Details of the electrochemical measurements performed on the SOFCs are described in Section I of the Supporting Information.
A set of SOFCs was subjected to stability tests in order to observe current density changes resulting from continuous fuel cell operation. Ambient air served as the cathode-side atmosphere and flowing forming gas (FG: 5% H2, 95% N2) served as the fuel on the anode side. Stability tests involved operating each device at a constant temperature for greater than 12 h and a constant voltage of +0.5 V (applied to the cathode, relative to the grounded anode) to measure the resulting current density. Because the manufacturer's process for YSZ substrate preparation involves thermal steps at temperatures far above the SOFC test temperatures (≤550 °C) employed in these experiments, the electrolyte microstructure and effective yttria doping are not expected to change during the tests. Time-dependent changes in current density were thus associated exclusively with morphological or chemical changes of the Pt electrodes. In some stability-tested SOFCs, the anodes were exposed in situ to cycles of flowing FG and flowing air in 2-min intervals for a total duration of ~30 min (i.e. 7–8 FG/air cycles) immediately prior to stability testing (a pretreatment).
In addition to stability-tested SOFCs, a second, identically prepared, set of devices was used to evaluate the influence of the FG/air cycling pretreatment on device performance by examining current density output in response to a voltage sweep (producing J–V and J–P relations) and by electrochemical impedance spectroscopy (EIS). Some of these devices were tested conventionally (no FG/air pretreatment). For the untreated devices, after an initial 30-min thermal equilibration period, J–V, J–P, and EIS measurements were performed on as-deposited devices at decreasing test temperatures of 550, 450, and 350 °C; a 2.5-h thermal equilibration period took place between testing at each temperature. The performance test protocol for the pretreated devices was identical to that for the untreated SOFCs except that the last 30 min of each 2.5 h equilibration period was used for FG/air cycling (7–8 FG/air cycles) just prior to measurements at each test temperature of 550, 450, and 350 °C.
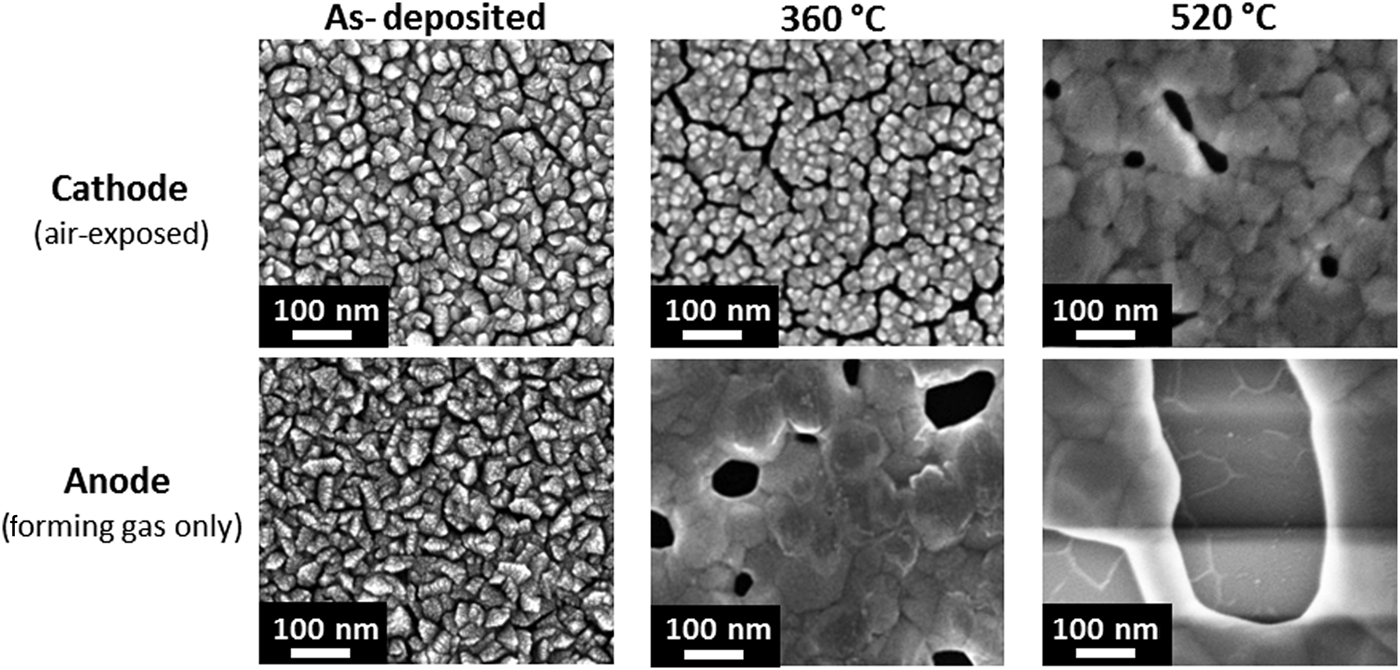
Figure 1 presents scanning electron microscope (SEM) images of SOFC cathodes (top row) and anodes (bottom row) as-deposited and after stability testing at 360 °C for 48 h and 520 °C for 25 h. Immediately apparent is the change in both the Pt grains and intergranular porosity for both electrodes, compared with the as-deposited Pt morphology. Coarsening of both the Pt grain size and the pore size was especially pronounced on the FG-exposed Pt anodes, compared with the air-exposed cathodes. In severe cases, after extensive stability testing, disconnected Pt islands on the anode surfaces of the YSZ electrolyte were observed, rendering the electrodes ineffective for charge transport and the device inactive. Similar break-up of a two-dimensional percolative network of Pt grains in porous thin films on YSZ substrates has been reported previously, after annealing of sputtered Pt films in air at significantly higher temperatures than those shown in Fig. 1.[Reference Ryll, Galinski, Schlagenhauf, Elser, Rupp, Bieberle-Hutter and Gauckler6, Reference Toghan, Khodari, Steinbach and Imbihl9] In addition to Pt grain growth, densification of the initially nanoporous Pt film (Fig. 1, top row) appeared to take place in the cathodes. One expected effect of densification of the pore structure is to reduce the triple-phase boundary area per unit electrode area, leading to reduced current density.
SEM images of as-deposited and conventionally operated nanoporous Pt cathodes (top) and corresponding anodes (bottom) after isothermal stability tests.

Simultaneous with the Pt morphology changes shown in Fig. 1, substantial reductions in current density delivered by the fuel cells were measured. The red data curve in Fig. 2 shows decreasing current density output of an SOFC under continuous stability testing at 550 °C and +0.5 V, with ambient air at the cathode and flowing FG at the anode. Under these conditions, the partial pressure of oxygen, P(O2), is greater on the cathode side (~0.21 atm) than on the anode side (~ zero). Owing to this imposed electrochemical potential gradient, oxygen ions drift from the positively biased cathode to the anode, and the measured current is positive; this is illustrated schematically in the top right diagram of Fig. 3. The typical open-circuit voltage (OCV) in this case was between 1.04 and 1.08 V. On the other hand, as illustrated in the bottom right diagram of Fig. 3, when compressed air was passed through the anode compartment of the SOFC test chamber, the P(O2) was greater on the anode side (~0.43 atm) than on the cathode side (~0.21 atm). At +0.5 V bias, the net flux of oxygen ions occurs from the anode to the cathode, and the measured current is negative. Figure 3 shows the current density response during a pretreatment prior to the start of stability testing in which FG and airflow are alternated in the anode compartment. Such “FG/air cycling” rapidly boosts current density which, after several cycles of air, reaches 31 mA/cm2, more than double the steady-state current density of 12 mA/cm2 for this sample prior to cycling treatment.
Stability test of SOFC current density at 550 °C and 0.5 V bias. Additional FG/air cycling at end of air-cycled curve resulted in a current increase at t ≈13.5 h.
Temporal response of current density to cycling FG and air over the SOFC anode at 550 °C at +0.5 V bias.
In Fig. 2, the black data curve shows the resulting current density after FG/air cycling pretreatment. Compared with the control device (red data curve), it is clear that FG/air cycling results in a higher SOFC current density, with a slower rate of decay during stability testing. A stability test duration of ~3 h was required to reduce the output current of the FG/air cycled sample by a factor of two, whereas a similar relative reduction of output current occurred in ~1 h for the (no pretreatment) control sample tested at this temperature. Additional FG/air cycling, similar to pretreatment cycling, at the end of stability test shown with the black data curve in Fig. 2 resulted in an additional current increase. The rapid current increase after FG/air cycling suggests that additional redox reaction sites become available after periodic change in oxygen ion flow direction across the electrolyte.
The Pt morphologies of SOFC electrodes were compared after stability testing at 550 °C, with and without FG/air cycling pretreatment. In contrast to the similarity in appearance of the two types of Pt anodes after stability testing (see Figure S4 in the Supporting Information), the untreated Pt cathode contained many small voids, whereas the FG/air cycled cathode exhibited a much smaller areal density of larger voids (pore coarsening). This observation suggests that the change in cathode morphology may produce greater total TPB areas after FG/air cycling, thus accounting for the observed increase in output current density compared with the untreated SOFCs. This hypothesis was tested by analysis of SEM images obtained from untreated and FG/air cycled cathodes, for a range of assumed TPB widths.
The SEM images of the cathodes shown in Fig. 4 were converted into binary images showing only the void outlines. Void-outline width, calibrated to the image scale, was varied to correspond with different assumed TPB widths. The TPB is assumed to be centered on the Pt/YSZ/gas three-phase contact line, with half of the TPB residing on the adjoining Pt and half on the exposed YSZ surface. The calculated area fraction of void-outline pixels corresponds to the equivalent TPB areal surface coverage. As the assumed TPB width was increased, voids that had been completed occluded by the TPB were assumed not to contribute to further TPB area scaling. Therefore, the TPB area fraction in Fig. 4 reaches a plateau when the TPB width approaches a value similar to the radius of the largest pores.
(a) Effect of varying the assumed TPB width on calculated TPB coverage of Pt cathodes of FG/air cycled and no pretreatment SOFCs. (b) FG/air cycled and (c) no pretreatment Pt cathode surface morphologies after stability testing at 550°C for ~14 h (Fig. 2 shows the corresponding current density data).
Figure 4 indicates a substantial difference in TPB area fraction for the two cathode void morphologies. Although it has a higher areal density of voids, cathode TPB coverage of the untreated device saturates at a far smaller value and at a relatively small assumed TPB width (~60 nm) compared with the FG/air cycled device. The very small cathode voids present in the untreated device were completely occluded by TPB area for assumed TPB widths greater than this value. In contrast, the much larger cathode voids present on the FG/air cycled device presented a TPB area fraction that saturated at an assumed TPB width of ~400 nm. These image analyses, therefore, suggest the possibility that cathode morphology differences are largely responsible for greater current density exhibited by FG/air cycling pretreated SOFCs. Their enhanced current density is consistent with a larger cathode TPB area promoted by larger-diameter voids.
The FG/air cycling pretreatment of SOFCs resulted in improved device performance, as shown in Fig. 5. Accompanying a marked increase in current density for a given voltage [shown in the semi-log plot in Fig. 5(a)] was a significant enhancement of peak power densities compared with devices that did not receive FG/air cycling pretreatment [Fig. 5(b)]. At 550 °C, cycling FG and air over the anode prior to SOFC testing tripled the peak power density compared with devices without pretreatment. Kim et al. reported a 0.7 mW/cm2 peak power density at 450 °C for a conventionally tested SOFC device with a commercial 8-YSZ substrate and 80-nm-thick sputtered Pt electrodes.[Reference Kim, Hsu, Connor, Gür, Cui and Prinz:1] It performed similarly to this study's “no pretreatment” device tested at the same temperature. This study's FG/air-cycled device, on the other hand, had a 10× higher peak power density than the literature device at 450 °C.
(a) V–Log(J) curves at 350 °C (green), 450 °C (red), and 550 °C (black) of FG/air cycling SOFCs (thick lines) and no pretreatment SOFCs (thin lines); (b) their peak power densities. Corresponding J–P data are provided in the Supporting Information.
The data in Table I indicate the temperature dependence of peak power density for both an untreated, control SOFC and a FG/air cycling pretreated device. In addition to the greater peak power observed after P(O2) cycling pretreatment, there is a clear difference in the temperature dependence of peak power for the two SOFCs. In general, increasing performance of SOFCs with increasing temperature is expected, due to more facile ion diffusion across the electrolyte and faster redox reaction kinetics on the electrodes at higher operating temperatures. Electrode polarization resistance is expected to increasingly limit the SOFC performance at lower temperatures.[Reference Adler7] However, the much greater temperature dependence of peak power for the untreated versus the FG/air cycled samples indicates that P(O2) cycling alters the contributions of the mechanisms that limit the SOFC output power.
Peak power densities of SOFCs with initially nanoporous Pt electrodes.

To examine these effects in more detail, through-thickness EIS was used to determine electrode and electrolyte resistances for each SOFC device. The Nyquist plot in Fig. 6(a) presents the 550 °C EIS data of an FG/air cycled SOFC compared with that of a device with no pretreatment. The equivalent circuit model used to analyze these data is described in the Supporting Information. The EIS curves were all characterized by a displacement on the resistance axis from the origin and a single arc. EIS results indicate that R YSZ differs only slightly (by ~10%) between the FG/air cycled and non-pretreated SOFCs for each of the measurement temperatures (350, 450, and 550 °C) studied. In contrast, R electrodes is smaller by at least an order of magnitude for the FG/air cycled devices. For example, the untreated device shown in Fig. 6(a) has R YSZ = 7.08 Ohm/cm2, Q electrodes = 1.22 × 10⁻⁴ F/cm2, and R electrodes = 181.1 Ohm/cm2. The FG/air cycling pretreated device has R YSZ = 7.80 Ohm/cm2, Q electrodes = 1.07 × 10⁻⁴ F/cm2, and R electrodes = 13.11 Ohm/cm2. The single arc is attributed to total electrode polarization resistance, based on previous literature reports.[Reference Barsoukov and Macdonald10, Reference O'Hayre, Cha, Colella and Prinz11] That only one arc is resolved suggests that the electrode resistance is dominated by a kinetic process associated with one of the two electrodes, presumably the cathode due to its reported slower reaction kinetics.[Reference Adler7]
(a) Nyquist plot comparison of EIS measurements at 550 °C on untreated and FG/air cycling SOFCs. Points represent measured data, and lines represent each fit. (b) Temperature dependences of EIS-derived ASR of Pt electrodes for FG/air cycling and no pretreatment SOFCs.
Area-specific resistances (ASRs) obtained from the electrode EIS data of both the P(O2) cycled and untreated devices fit an Arrhenius temperature dependence, as shown in Fig. 6(b) with an activation enthalpy of ~1.2 eV. The extracted activation enthalpy falls in the range of previously reported values, 0.9–1.6 eV,[Reference Muecke, Beckel, Bernard, Bieberle-Hütter, Graf, Infortuna, Müller, Rupp, Schneider and Gauckler2, Reference Ryll, Galinski, Schlagenhauf, Elser, Rupp, Bieberle-Hutter and Gauckler6, Reference Opitz, Hörlein, Huber and Fleig12, Reference Ni, Leung and Leung13] for Pt/YSZ cathode kinetics. The absolute ASR values measured differ by a factor of 10 × –20× for the 350 to 550 °C temperature range investigated, with the FG/air cycled devices showing consistently lower ASR. This indicates that the mechanism limiting electrode resistance at low overpotential is the same for the two kinds of samples, in spite of the significantly smaller area-specific electrode resistance of the P(O2) cycled SOFCs. This behavior is consistent with a greater TPB area fraction after FG/air cycling of the porous Pt cathode, as suggested by the image analyses shown in Fig. 4, producing a higher cathode exchange current density.[Reference Ni, Leung and Leung13]
Moreover, XPS analysis of the cathode surface for different pretreatments showed no significant differences in surface composition. After SOFC testing, both P(O2) cycling pretreated and untreated cathodes showed evidence of a similar extent of surficial PtOx formation that might inhibit the oxidation reaction on the cathode.[Reference Pöpkea, Mutorob, Luerßena and Janek14] The spectroscopy results, summarized in the Supporting Information, lend further support to the hypothesis that morphology changes in the Pt thin film cathode resulting from FG/air cycling are primarily responsible for the observed enhancement of ASR shown in Fig. 6(b).
The temperature dependencies of the ASR and that of the SOFC peak power (Table I) are similar for the untreated devices (200 × –300× change between 350 and 550 °C). For the FG/air cycling pretreated SOFCs, the temperature dependence of the peak power is much weaker, giving a peak power that is greatly enhanced relative to untreated SOFCs at 350 °C. This suggests that a parallel kinetic pathway for O2 reduction, distinct from reaction at TPB sites, may open up at high overpotentials and low temperatures on the FG/air cycled SOFC cathodes, enhancing the peak power output under DC testing, above the enhancement of the ASR detected in the EIS measurements. Recent studies of O2 reduction kinetics on porous Pt cathode–YSZ interfaces at higher temperatures than we have investigated[Reference Opitz, Hörlein, Huber and Fleig12] suggest the possibility of parallel reaction pathways at high cathodic overpotentials; however, further research is needed to establish whether similar phenomena are at work in the present case.
Figure 1 indicates that the oxygen potential gradient across the YSZ electrolyte has a pronounced effect on morphology evolution of nanoporous Pt electrodes. Because the maximum test temperature of 550 °C used in our experiments is well below one-half of the melting point of platinum, it is probable that the observed electrode morphology changes involve Pt surface diffusion.[Reference Srolovitz and Safran15] Our recent investigation of pore size evolution during annealing of mesoporous Pt films on YSZ substrates indicates that enhanced Pt surface diffusion under H2/N2 atmosphere increases the rates of both pore coarsening and Pt grain growth compared with oxygen annealing,[Reference Lin and McIntyre16] consistent with the much greater morphological change observed in Fig. 1 for initially nanoporous anodes compared with the cathodes. The differences in anode and cathode morphology after testing the untreated and FG/air cycled devices (Fig. 4) suggest different wetting conditions (Young's angle) for Pt thin films on the YSZ substrate under oxidizing and reducing electrochemical potentials. Some support for this hypothesis is found in reported P(O2)-dependent wetting of porous Cu catalysts on ZnO;[Reference Clausen, Schiøtz, Grhbæk, Ovesen, Jacobsen, Norskov and Topsøe17] however, further investigation is needed to establish the mechanism for the Pt/YSZ system.
In summary, a FG/air cycling treatment prior to testing of SOFCs produced significant reduction of the polarisation resistance of initially nanoporous Pt electrodes and improvements of overall SOFC performance. Cycling the oxygen partial pressure gradient to transiently reverse the direction of oxygen ion drift across the YSZ electrolyte rapidly enhanced the output power of the device and also reduced the rate of performance degradation during subsequent isothermal testing. The FG/air cycling pretreatment produced a significant increase in the average pore size and void area fraction of the Pt cathode, thus increasing the TPB coverage. This may result from an electrochemical potential dependence of the wetting characteristics of the Pt cathode on the YSZ surface. Consistent with the observed cathode morphology change, impedance spectroscopy showed a reduction in cathode resistance for the FG/air cycled SOFCs. These results suggest the importance of local oxygen activity in determining the wetting characteristics of nanoporous electrodes, which can greatly impact the stability and performance of SOFCs and, possibly, other electrochemical devices operated at low-to-moderate temperatures.
Supplementary materials
For supplementary material for this article, please visit http://dx.doi.org/10.1557/mrc.2013.25
Acknowledgments
We thank Prof. F.B. Prinz and his group at Stanford University for access to their Pt sputtering system. This research was supported in part by the Stanford Global Climate and Energy Project.