I. INTRODUCTION
KorriGaN has been the largest project about GaN technology. It was launched by EDA (European Defense Agency) in 2005 [Reference Gauthier, Mancuso and Murgadella1] for a total duration of 54 months. The main purposes of this project were:
– to establish a complete and independent European chain in GaN technology from wafer to the final transreceiver Module for Radar applications;
– to demonstrate the performances and the reliability at sub-system level of this GaN technology for defence applications.
Seven countries were involved in this huge project: France, Germany, Italy, Netherlands, Spain, Sweden and the United Kingdom. KorriGaN was splitted into six sub-projects: systems specifications, materials (wafers and epitaxies), foundry works (including the modeling aspect of the transistors), reliability, thermal integration, and final demonstrators. Several functionalities, for which GaN technology is very promising, have been designed: S, X, and broadband (2-6, 2-18) high-power amplifiers (HPAs); X band and broadband robust low-noise amplifiers (LNAs); and switches.
Four foundries were involved in the project : 3-5 Lab (F), Chalmers (Sw), QinetiQ (UK) and Selex-SI (I). Twelve designers teams worked with those foundries : 3-5 Lab (F), BAE Systems Insyte (UK), Indra (Sp), Isom (Sp), Eletronica (I), Saab (Sw), Selex SAS (UK), Selex SI (I), Thales Defence Ltd. (UK), TNO (NL) and UMS (G).
The measurement-based compact modeling activity (Workpackage WP3.3) was the interface between foundries and designers. Four labs have released transistor models for designers: Chalmers, Politecnico di Torino, University of Roma Tor Vergata and XLIM.
The KorriGaN project has released up to 29 demonstrators in different technologies (coplanar and microstrip) in two runs. The modeling part was essential in the design process of all those demonstrators.
The present paper will describe the workpackage dedicated to measurement-based modeling into the KorriGaN project as well as the main results achieved in the framework of this project. Detailed results about the various advances made in the project have been given elsewhere.
First of all, an overview of the characterization and modeling activities in KorriGaN, will be presented, then the different measurements setups. A part will be dedicated to an example of nonlinear modeling from the device to the final demonstrator. Finally, some research activities about self-heating, trapping effects, and noise modeling will be presented.
II. KORRIGAN MODELING WORKPACKAGE ACTIVITY
The modeling activities took place during 36 months. This workpackage (named WP3.3) was in charge of the characterization and the modeling of both passive (capacitors, resistors, etc.) and active (transistors) devices. This work leads to the creation of a complete PDK (Process Design Kit) and of a design guide for each foundry (Chalmers, QinetiQ, Selex-SI and Tiger).
The characterization and modeling of passive devices are based on classical [S] parameters measurements up to 40 GHz.
Regarding the active devices, several measurement methods has been used such as CW and pulsed [S] parameters measurements, DC and pulsed I–V characterizations, large-signal measurements (load-pull), and noise measurements.
The released transistor models depend on the final application: noise models for LNAs, linear models for switches, nonlinear models for HPAs and LNAs, electro-thermal models, and trapping effect models for some HPAs.
Figure 1 illustrates where the WP3.3 work package is located into the global KorriGaN project.
KorriGaN Modeling Workpackage (WP3.3) activity organization.

III. MEASUREMENT SETUPS
The first step for the HEMT compact modeling is the characterization of a representative transistor. For this purpose, several measurement setups are used such as [S] parameters, pulsed IV and pulsed [S] parameters, and noise parameters for model extraction and load-pull setup for large-signal verification of nonlinear models.
A) S parameters
CW [S] parameter measurements have been performed by foundries for testing and selecting devices on a complete wafer and by modeling partners who can extract a linear model, a table model, or the noise parameters from such measurements.
Regarding the foundries activities, the main test is to map where are the transistors on the completed wafer with typical h21, Gmax, and Ft values.
B) Pulsed measurements
The pulsed [S] parameters measurement setup is useful to extract nonlinear elements dependencies in a nonlinear model [Reference Teyssier, Bouysse, Ouarch, Barataud, Peyretaillade and Quere2]. The bench used at XLIM enable pulsed IV and [S] parameters measurements into a 500 ns pulse with a 10-µs period as illustrated in Fig. 2.
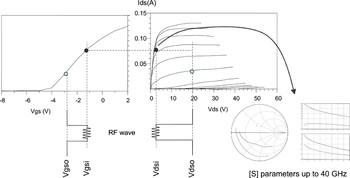
Pulsed IV and [S] parameters measurement principle.

This setup is based on the use of Agilent 8110A and 8115A pulse generators. Those generators are limited to 100 V/2 A on a 50 Ω loadline (i.e. 100 V with no current or 2 A with no voltage). This bench was sufficient for the elementary transistors characterized in the KorriGaN project but is not sufficient for larger transistors such as commercially available packaged GaN transistors from Japan or the USA and thus the upcoming large periphery packaged transistors from Europe. New pulsed IV solutions appeared recently for that purpose like the PIV system by AMCAD Engineering which enable 240 V and 10 A simultaneously.
The modeling of a transistor requires a network with a bias quiescent bias point established by the designer of the final application and which corresponds to the bias of the transistor in the real conditions. For each instantaneous bias of the network, [S] parameters are measured up to 40 GHz. Therefore, it is possible to extract a linear model for each measured point and then comes the variations of the nonlinear elements to build the nonlinear model.
C) Load-pull measurements
The load-pull measurement setup is the “Large-Signal” characterization tool used to validate a model or to check the possibilities of a given transistor in terms of output power or power-added efficiency.
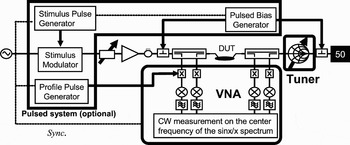
The principle of the load-pull setup is to measure the signals at the input and the output of the transistor when moving the load-impedance. There were two methods to modify the load-impedance in KorriGaN: an active and a passive system (Fig. 3).
(Pulsed) Frequency domain passive load-pull at XLIM.

The active system principle relies on applying an RF signal at the output of the transistor. This signal is synchronized with the one generated by the transistor. Thus, loading conditions at the output of the device under test are artificially created.
The passive system is based on the use of an automated mechanical tuner. The tuner is a line with a mobile resonator (stub). Moving the stub during the measurements enables to map the complete smith chart at the desired frequency.
Load-pull measurements are done on every transistor to validate the model extracted from IV and [S] parameters, in large-signal conditions.
IV. NONLINEAR MODEL FOR HPA
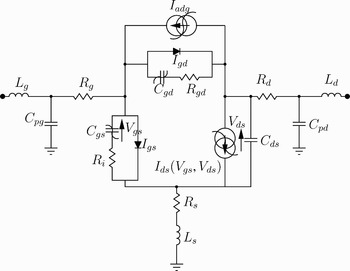
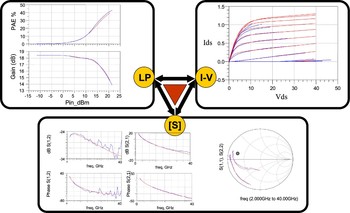
Figure 4 illustrates a classical nonlinear model (no thermal and no trapping effect) released in the frame of KorriGaN. This model has been implemented in ADS software as Software Defined Device (SDD). First of all, a linear model is extracted from a CW [S] parameters measurement. Then nonlinear elements dependencies are fitted according to pulsed IV and pulsed [S] parameter measurements (a complete pulsed network with a quiescent bias point given for the transistor's final application). The model is then validated thanks to large-signal measurements (load-pull), as illustrated in Fig. 5.
Nonlinear model of a GaN HEMT transistor in Agilent ADS.

A validated nonlinear model released in the frame of KorriGaN. Every model is released with I–V, S parameters and load-pull measurements comparison.

For HPAs, nonlinear models include electro-thermal effects (for large periphery) and trapping effects (if needed) have been released. Those two main parasitic effects have been analyzed during the KorriGaN project and modeling teams has released a new kind of model that take into account those phenomenon.
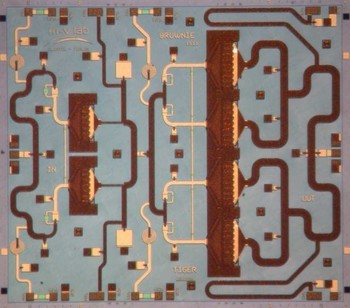
A complete process from materials to the measured X-band HPA in the frame of KorriGaN has been given with details in [Reference Piotrowicz3]. The amplifier is a two-stage amplifier. The first stage is composed of two 12 × 100 µm transistors and the second stage of four 16 × 140 µm (Fig. 6). In this case, the foundry was Tiger/3-5 Labs, the design kit has been released by XLIM from the modeling workpackage and the designers are from 3-5 Labs. The result is a 58 W, 38% PAE MMIC amplifier at X-Band.
Photograph of amplifier. Chip size is 18 mm2.

V. ELECTRO-THERMAL MODELING
The development of accurate device models for GaN-based high-power amplifiers requires to allow for a description of the device self-heating. In fact, the device peak channel temperature is affected by power dissipation, and, due to the slow thermal dynamics, memory effects arise. Three-dimensional (3D) FEM-based thermal models are typically needed to account for the large-scale thermal dynamics related to the 3D nature of heat flow (influenced by the device geometry, layout, and multilayered structure, including heat spreaders and dissipators), and for the temperature dependence of the materials' thermal conductivity and specific heat, which makes the time-dependent heat diffusion equation nonlinear. On the other hand, due to the computational intensity of the 3D heat solver, the modeling of the nonlinear, dispersive thermal behavior at a system or circuit level calls for the identification of compact models able to couple accuracy with numerical efficiency.
Within the KorriGaN project, Politechnico di Turino has developed a novel technique for the compact nonlinear dynamic thermal modeling of electron devices, based on the so-called behavioral Wiener approach. In the Wiener model, a nonlinear system with memory is approximated as the cascade of a linear system with memory and a nonlinear but memoryless system. The model can be readily extracted from 3D FEM simulations but also from thermal measurements as well; it allows for a simple and compact circuit implementation within the framework of available circuit simulators, and predicts with high accuracy self-heating dynamics over a wide range of input dissipated power levels and waveforms. Coupled with a temperature-dependent device nonlinear equivalent circuit, it allows for the thermal assessment of GaN-based power amplifiers, including the impact of thermal memory effects on the amplifier linearity [Reference Camarchia, Cappelluti, Pirola, Guerrieri and Ghione4, Reference Bonani, Camarchia, Cappelluti, Guerrieri, Ghione and Pirola5].
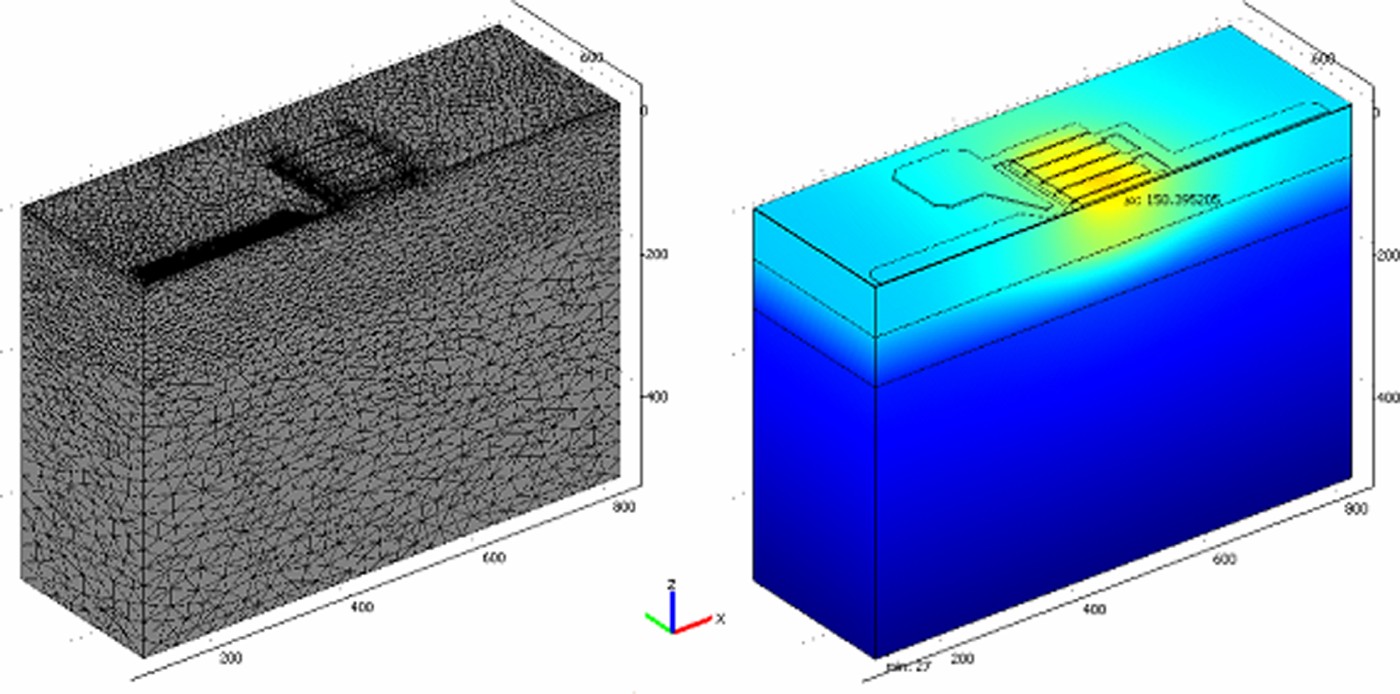
As an example of 3D FEM simulation, Fig. 7 (left) shows the mesh of a multifinger SELEX-SI GaN-HEMT (10 × 100 µm, only one-half of the device is considered) on top of a 70 µm SiC substrate. The substrated is glued to a Cu20W80 mounting through a 70-µm-thick layer of silver-filled epoxy resin (EPO-TEX H20E).
Example of layout exploited for FEM simulations. One half of a SELEX-SI 10 × 100 µm AlGaN/GaN HEMT on 70 µm SiC substrate. (Left) Mesh discretization. (Right) Temperature profile at dissipated power of 4 W. Details on material thermal models can be found in [6].
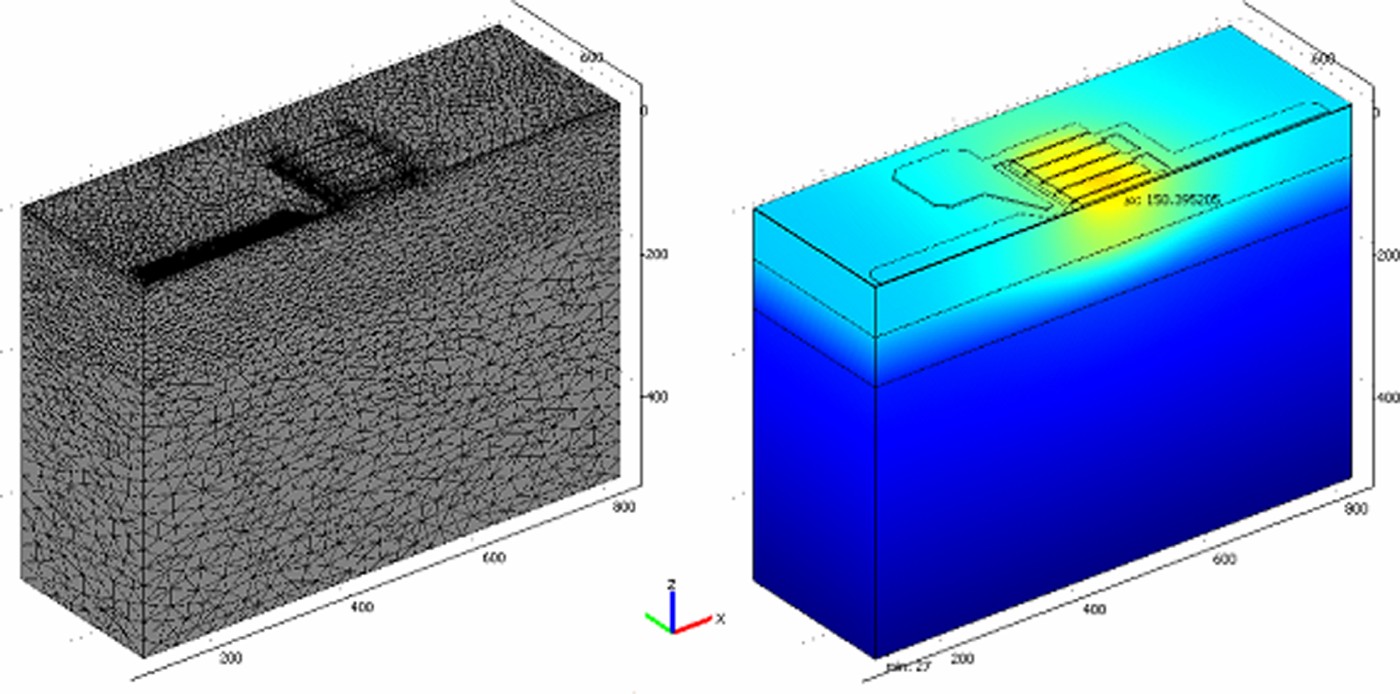
The temperature profile for a dissipated power of 4 W is shown in Fig. 7 (right).
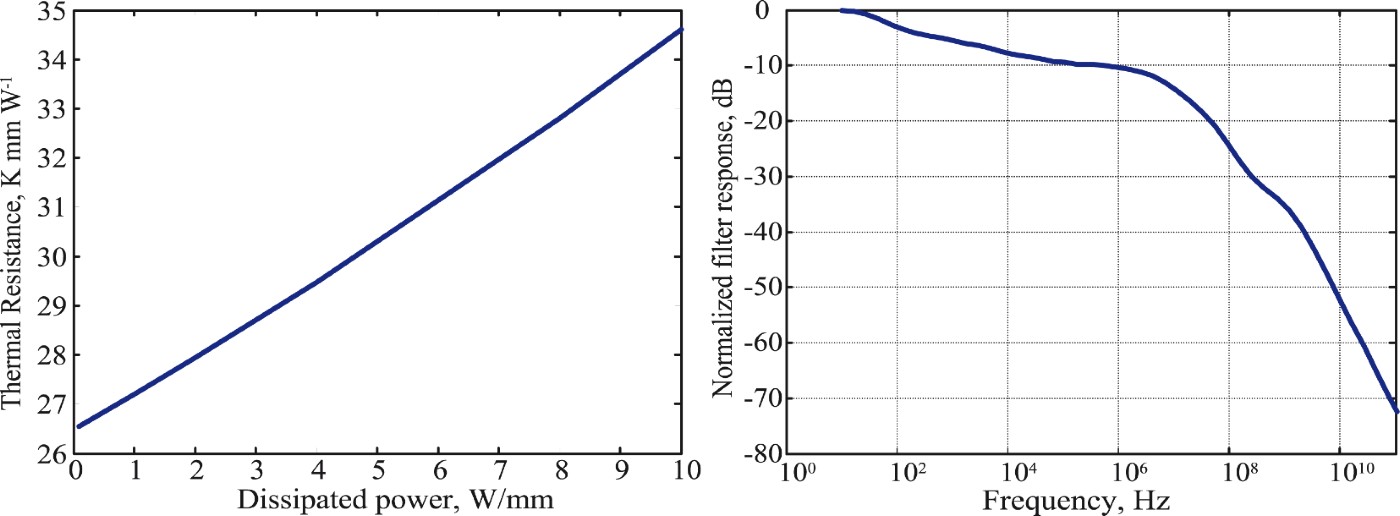
Steady-state simulations at different power levels allow one to obtain the device thermal resistance shown in Fig. 8 (left). On the other hand, the dynamic thermal behavior may be extracted from the transient response to a small (linear case) input power step and transformed into the frequency domain, yielding the device frequency-dependent thermal impedance (Fig. 8 (right)). Following the Wiener behavioral approach, the large-signal (LS) compact model is then built-up as the cascade of the linear filter in Fig. 8 (right) and the nonlinear thermal resistance in Fig. 8 (left).
Left: Thermal resistance of as a function of the dissipated power. Right: Normalized frequency response of the thermal impedance.

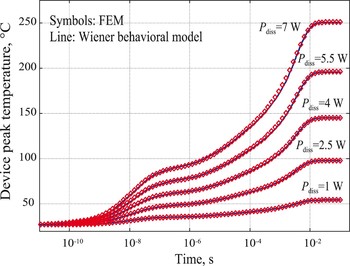
From a mathematical standpoint, such an approach corresponds to (a) applying an equivalent Kirchhoff transformation (see e.g. [Reference Joyce7] and references therein) to the nonlinear time-dependent heat diffusion equation; (b) solving the resulting equation, which is still mildly nonlinear in the coefficient of the time derivative of the temperature, by approximating such a coefficient with a constant one. As a consequence, the Wiener model turns to be exact not only in the two limiting cases of T-independent material properties, or of steady-state behavior (zero time derivative), but also when the Kirchhoff transformation yields a transformed time-dependent heat equation that is exactly linear; this occurs when the materials' thermal diffusivity may be assumed as constant. Although this condition is not usually met in semiconductor devices, such remark provides a physical justification to the choice of the Wiener topology. The approach is validated against large-signal transient 3D thermal simulations in Fig. 9 for a wide range of dissipated power levels. The proposed model predicts with high accuracy the dynamic active region temperature increase, with a relative error limited to a few percent.
Comparison between FEM solution and Wiener behavioral model.

The Wiener thermal model was coupled to a temperature-dependent equivalent circuit electrical model according to the following strategy. From a physical standpoint, we can identify two main sources of temperature dependence in the device electrical behavior: the temperature sensitivity of the threshold voltage, the mobility and saturation velocity drop with increasing temperature. Temperature effects on reactive elements (such as capacitances) were found to be negligible in the considered frequency range and therefore not included in the model. To account for the afore-mentioned T-dependence, the drain current model coefficients connected to the threshold voltage were assigned a T-polynomial variation with respect to the value at the reference temperature, whereas an exponential dependence was given to the drain current variation related to the mobility decrease with temperature. Finally, a polynomial dependence was assigned to the parasitic resistances. The T-dependent model was then implemented as an SDD Agilent ADS block, where the channel temperature is the voltage of an additional node connected to the compact thermal model, whose input current is evaluated as the instantaneous device dissipated power. The model is first fitted in the non-reactive part at a constant (reference) temperature through pulsed DC measurements; then, the reactive part is derived from S-parameter characterization. The temperature dependence is finally recovered by fitting to the static DC curves. A final refinement can be carried out by means of multibias S-parameter fitting.
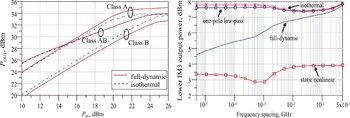
The electrothermal self-consistent model can be used to gain insight into the impact of thermal effects on power amplifiers' linearity [Reference Camarchia, Cappelluti, Pirola, Guerrieri and Ghione4]. As an example, we study the impact of different thermal modeling choices on the prediction of the nonlinear performance of a 1 mm SELEX-SI coplanar GaN-based amplifier. In particular, we compare the full-dynamic thermal model previously presented to an isothermal one, in which the temperature is kept constant to the quiescent value. Fig. 10 (left) shows the simulated Pin–Pout curves on optimum loads under class A, class AB, and class B operation (4 GHz fundamental frequency). The isothermal model underestimates the output power under class A (since it neglects the device cooling due to the RF power under LS operation), while overestimates the output power at class B operation (device heating due to the RF power under LS operation); finally at class AB the two models give comparable results. As a further example, Fig. 10 (right) assesses the impact of electrothermal feedback on the third-order intermodulation product (IMP3) under two-tone excitation. Besides the full-dynamic and isothermal model, we consider also a single-pole low-pass model (cut-off frequency of 10 Hz) and a static nonlinear model. The change of electrothermal feedback (zero for the isothermal model and increasing from single-pole, full-dynamic and static nonlinear models) causes a marked difference in the predicted IMP3 power and dependence on the tone spacing.
Left: Single tone simulation at 4 GHz on optimum power load (from [4]). Right: Two-tone simulation as a function of the tone spacing. The center frequency is 4 GHz, the total input power level is 25 dBm corresponding to 36 dBm output power (from [4]).

VI. TRAPPING EFFECTS
The modeling of the trapping effects was a research activity started thanks to the KorriGaN project [Reference Jardel8].
To evaluate the influence of gate lag and drain lag we perform characterizations on every HEMT devices.
First of all, a cold bias point IV-network is performed. In this case, the quiescent bias point is V g = V d = 0 V. The instantaneous bias point is changed in order to trace the complete IV characterization. Therefore, the gate voltage is swept from pinch off to V g = +1 or +2 V for complete drain voltage curves.
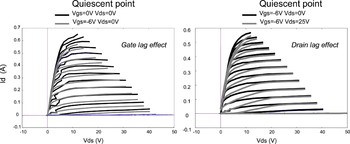
Then, we perform a GATE LAG network. The quiescent bias point is V g = pinch off and V d = 0 V. The thermal behavior is very close to the cold network because there is no drain current. Thus, the difference between this IV-network and the cold one is the lag related to the gate voltage.
Finally, a DRAIN LAG + GATE LAG network is measured with a quiescent bias point as V g = pinch off and V d on the final application value (25 V for example). There is no drain current for this bias point, so the thermal influence on the transistor is minimized. On the complete network, the difference between the GATE LAG and the DRAIN LAG + GATE LAG network is the drain lag effect.
Figure 11 illustrates gate and drain lag effects on pulsed IV measurements.
GATE LAG (left) and DRAIN LAG + GATE LAG effects (right) on a QinetiQ 8 × 75 µm transistor.

The detailed description of the nonlinear model including thermal and trapping effects is given in [Reference Jardel8]. It allowed to describe accurately a lot of experimental phenomena exhibited during the pulsed I–V measurements as well as the RF power measurements.
For designers, the gate and drain lag models are sub-circuits located before the voltage command of the main current source. These sub-circuits include several “envelope detector”. Each envelope detector has a filling time constant and a release one for trap. The principle is quite simple: basically, the detector modify, according to the RF level, the voltage command of the main current source. It means that the RF IV-network changes dynamically because of the traps. And the time constants, related to these traps are extracted from a pulsed measurement.
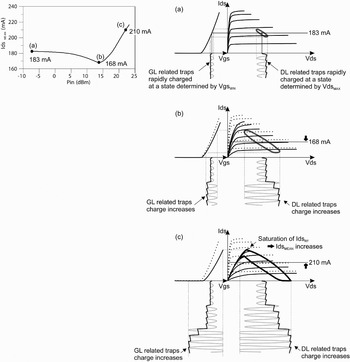
In most large-signal characterizations of KorriGaN HEMT, we can see that the DC current decrease versus the input power and then increase normally. This current slop phenomenon is due to trapping and its induced current degradation. It is taken into account by the trapping model (Fig. 12).
VII. NOISE MODELING
As it is well established, noise parameters of microwave FETs can be determined using two main approaches.
In the first one [Reference Lane9, Reference Pucel, Haus and Statz10], noise figure is measured by loading the device by a minimum of four source impedances synthesized by a tuner, and noise parameters are subsequently determined by a fitting procedure applied to the function expressing the dependence of the noise figure on source admittance. Nevertheless, to reduce the problems inherent to the measurements' uncertainties, more than four noise measurements are typically performed at each frequency. This approach has some drawbacks: apart from the cost and measurement bench complexity, the selection of the source admittances is limited by its losses; moreover, the measurement procedure is time-consuming, implying the preliminary or on-site linear characterization of the tuner; finally, the extracted noise parameters may not represent a physical device, since the selection of source admittance patterns critically affects the accuracy of the resulting noise parameters, resulting from a blind optimization.
Evolution of the drain current during a large signal characterization. This slope is taken into account by the model. On the IDS plot, gray line is the model without trapping effects, red line is the model including a trapping effect, and the crosses are the measurements.

In the second approach, the noise behavior of the intrinsic part of the active device is described by its small-signal equivalent circuit and some frequency-independent noise constants [Reference Gupta and Greiling11–Reference Krausse14]. In particular, in [Reference Tasker, Reinert, Hughes, Braunstein and Schlechtweg13] the noise of the active region of the device at microwave and higher frequencies is modeled utilizing equivalent thermal noise sources. The noise constants associated to the small-signal equivalent circuit of the device therefore typically consist in two frequency-independent equivalent noise temperatures assigned to the intrinsic gate and drain resistances. Such temperatures can be determined from the device noise figure corresponding to a matched source impedance (usually indicated by F50), measured at two different frequencies. Moreover, assuming the gate equivalent noise temperature to be equal to the ambient temperature [Reference Tasker, Reinert, Hughes, Braunstein and Schlechtweg13, Reference Krausse14], a single F50 measurement at a given frequency is sufficient to determine the complete noise model. This approach does not require a tuner, resulting in a simpler test bench and in a straightforward noise measurement, if compared with the previous one. Moreover, the total number of measurements required for the determination of the noise parameters in a broad frequency range is remarkably reduced. On the other hand, a time-consuming determination of the small-signal equivalent circuit of the device is needed: the validity of the noise temperature model is strongly related to the validity of the equivalent circuit model.
During the project, however, a complete characterization is requested for active devices that are being realized, including small- and large-signal equivalent-circuit modeling. On this basis of such premises, the F50 method was considered the most efficient and straightforward. In fact, it allows one to share the small-signal equivalent circuit extraction step with large-signal modeling, further minimizing the number of the overall required noise measurements.
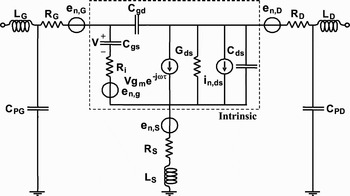
In detail, the considered noise model consists of the device small-signal equivalent circuit (depicted in Fig. 13) in which a noise source is associated to each resistive element (both intrinsic and extrinsic). Such noise sources represent the noise contribution of the device in terms of equivalent thermal noise.
Small-signal and noise equivalent circuit model of the modeled GaN HEMTs.

The mean square value of each noise source is expressed via the respective physical resistance R x and an equivalent noise temperature T x; in particular, parasitic resistances are typically assumed to be at room temperature T A. The following expressions therefore result:


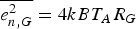
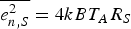
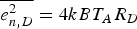
where k is the Boltzmann constant and B is the frequency band.
The noise behavior of our GaN HEMTs is therefore completely characterized by the equivalent circuit of the device and the gate and drain equivalent noise temperatures (T gs and T ds, respectively) ascribed to the intrinsic gate resistance (R i) and the drain-source conductance (G ds), respectively. Such temperatures are constant with frequency: as a consequence, the frequency dependence of the device noise parameters is strictly related to the reactive elements of the equivalent circuit.
The model is therefore extracted in two steps: firstly, the equivalent circuit of the device is determined from S-parameters measurements; secondly, T gs and T ds are extracted making use of the equivalent circuit and F50 measurements.
S parameters of the GaN HEMTs under study have been measured in the 0.1–40 GHz frequency range in Cold-FET bias conditions (parasitics extraction) and for some bias points in the active region (intrinsic parameters). F50 measurements of the considered devices have been performed in the 2–18 GHz frequency range for all the previously selected bias points. Such measurements and the small-signal equivalent circuits have been utilized to determine the equivalent noise temperatures of the devices at the selected bias points. As a final step, the noise parameters of the devices have been computed utilizing the extracted equivalent noise temperatures and the small-signal equivalent circuits. In particular, the temperatures have been assumed to be frequency-independent, thus allowing the determination of the devices' noise parameters at frequencies higher than the measured ones.
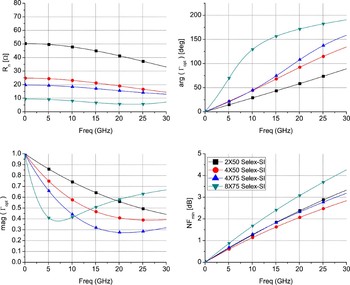
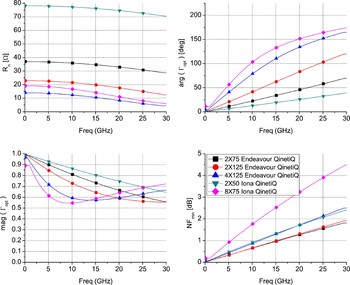
Noise modeling was performed investigating the noise properties of nine GaN HEMT geometries, from two different foundries (Selex-SI and QinetiQ); in greater detail, the considered device peripheries from each foundry are 2 × 75 µm, 2 × 125 µm, and 4 × 125 µm from QinetiQ/Endeavour 0.25 µm coplanar foundry process; 2 × 50 µm and 8 × 75 µm from QinetiQ/Iona 0.25 µm coplanar foundry process; 2 × 50 µm, 4 × 50 µm, 4 × 75 µm, and 8 × 75 µm from Selex-SI 0.25 µm microstrip foundry process.
The models' extraction was carried out considering 20 and 30% (and in some cases 40%) of the I dss current and at least two VDS voltage values (typically 10 and 20 V and in some cases 15 and 25 V).
As an example of the modeling activity, in the following two figures the four noise parameters, R n, NF min, and Γopt (amplitude and phase) for each GaN HEMT family are reported, considering a drain current equal to 20% of I dss and 10 V of VDS for QinetiQ Endeavour and 15 V of VDS for Selex and QinetiQ Iona. Fig. 14 relates to Selex-SI while Fig. 15 relates to QinetiQ GaN HEMTs.
Selex-SI GaN HEMTs noise parameters: R n (top left), ∠Γopt (top right), |Γopt| (bottom left), NF min (bottom right).

QinetiQ GaN HEMTs noise parameters: R n (top left), ∠Γopt (top right), |Γopt| (bottom left), NF min (bottom right).

Due to the inherent higher breakdown voltage, GaN devices provide at least 20 dB higher survivability level when compared to GaAs pHEMTs [Reference Krausse14, Reference Micovic15]. Use of GaN LNAs offers therefore interesting possibilities for simplified receiver front-end concepts, since an input protection limiter can be omitted, providing better overall system noise figure or better spurious-free dynamic range for increased sensitivity. Furthermore, the extracted 0.65 dB minimum noise figure exhibited by the characterized GaN technology at 10 GHz well compares with commercially available GaAs HEMT with comparable gate features.
VIII. CONCLUSION
The modeling workpackage in KorriGaN has characterized and modeled every elementary cell (active and passive) of the project. Many characterizations were carried out: from classical [S] parameter measurements to large-signal characterizations in time domains.
The characterization of the KorriGaN transistors means for more than 100 measured transistors. The activities were uniformly distributed among the various partners.
In addition, a physical modeling aspect was developed simultaneously. European GaN technologies were optimized in that way. The project provided several validations of assumptions made during the equivalent circuit modeling of KorriGaN HEMTs (regarding the temperature).
One of the main advances in the modeling activity was the creation of new electro-thermal models and the trapping effect models.
A large number of models have been produced during the project: linear models, nonlinear models, noise models, electro-thermal models, and even trapping effect models to take into account the gate and drain lag. This project, including different institutes or technology centers, provides state of the art skills. This collaboration between various European partners has helped the raise of the European GaN technology at a non-negligible level within four years.
ACKNOWLEDGEMENTS
This research activity was carried out in the KORRIGAN RPT N8 102.052 Project funded within the EUROPA framework in the CEPA 2 priority area. The authors wish to acknowledge the consortium members for their contribution and the European Defence Agency for its financial support. The authors want to thank Marco Pirola, Valeria Teppati, Mauro Furno, Simona Donati, and Fabrizio Bonani for contributing to the KorriGaN electrothermal and thermal modeling activities for Politecnico di Torino and Antonio Nanni from Selex – Sistemi Integrati regarding noise modeling.
 Tibault Reveyrand was born in Paris, France, in 1974. He received the Ph.D. degree from the Université de Limoges, Limoges, France, in 2002. From 2002 to 2004, he was Post-Doctoral Scientist with the Centre National d'Etudes Spatiales (CNES) (French Space Agency). In 2005, he became a Contractual Engineer with the Centre National de la Recherche Scientifique (CNRS), XLIM, Limoges, France. His main research interests include the characterization and modeling of RF and microwave nonlinear components.
 Walter Ciccognani was born in Rome, Italy, in 1977. He received an electronic engineering degree in 2002 and a Ph.D. degree in 2007 from the University of Roma Tor Vergata, (Rome, Italy). He is currently working in collaboration with the University of Roma Tor Vergata. His main research activities are in the field of linear microwave circuit design methodologies, linear and noise analysis/measurement techniques, and small signal and noise modeling of microwave active devices.
 Giovanni Ghione was born in 1956 in Alessandria, Italy. He graduated cum laude in Electronic Engineering from Politecnico di Torino in 1981. In 1990 he joined the University of Catania as Full Professor of Electronics, and since 1991 he was again with Politecnico di Torino. His present research interests concern the physics-based simulation of active microwave and optoelectronic devices, with particular attention to noise and thermal modeling. He is a member of the Editorial Board of the IEEE MTT Transactions.
 Olivier Jardel was born in Poitiers, France, in November 1981. He received the Engineer degree from Aix-Marseille I University, in 2004, and the Ph.D. degree from Limoges University in April 2008, in the common laboratory MITIC between XLIM and Alcatel-Thales 3-5 lab. He is currently a research Engineer at Alcatel-Thales 3-5 lab, and is working on the development of the new AlInN/GaN HEMT technology, on transistor modeling, and on the design of high-power amplifiers.
 Ernesto Limiti (M'92) is a full Professor of Electronics in the Engineering Faculty of the University of Roma tor Vergata since 2002, after being research and teaching assistant (1991) and associate professor (1998) in the same university. His research activity is focused on three main lines, all of them belonging to the microwave and millimetre-wave electronics area. The first one is related to characterization and modeling for active and passive microwave and millimetre-wave devices. The second line is related to design methodologies for nonlinear circuits. The main focus is on power amplifiers, frequency multipliers, and active mixers. Finally, the third line is in the development of extremely low-noise amplifiers and receiving subsystems in general, including beam forming networks for active receiving antennas operated at cryogenic temperatures. The above research lines have produced more than 200 publications on referred international journals and presentations at international conferences. Prof. Limiti acts as a referee or editorial board member of international journals of the microwave electronics sector and he is in the steering committee of several international conferences and workshops. He is actively involved in research activities with many research groups, both European and Italian, and he is in tight collaboration with high-tech Italian and foreign companies.
 Antonio Serino was born in Lecce, Italy, on January 7, 1967. He received the degree in Electronic Engineering, summa cum laude, from the University of Roma “Tor Vergata” in 1994. From 1998 to 2000 he had worked as graduate technician at the University of Rome “Tor Vergata” where he became assistant professor in 2001. His research activities concern small-signal and large-signal characterization and modeling of microwave and millimeter wave active devices, noise characterization and modeling of field effect transistors for microwave and millimeter wave applications, and design methodologies of millimeter wave low-noise amplifiers.
 Vittorio Camarchia was born in Turin, Italy, in 1972. He received the Laurea degree and Ph.D. degree in Electronic Engineering from the Politecnico di Torino, Turin, Italy, in 2000 and 2003, respectively. In 2001, 2002, and 2003, he was a Visiting Researcher with the Electrical and Computer Engineering Department, Boston University. In February 2003, he joined the Dipartimento di Elettronica, Politecnico di Torino. His research is focused on RF device modeling, simulation, and characterization, both linear and nonlinear. Dr. Camarchia was the recipient of the 2002 Young Graduated Research Fellowship presented by the Gallium Arsenide application Symposium (GAAS) Association.
 Federica Cappelluti received the Laurea degree in Electronic Engineering and the Ph.D. degree in Electronic and Communications Engineering from the Politecnico di Torino, Italy, in 1998 and 2002, respectively. She is currently a Research Assistant with the Dipartimento di Elettronica, Politecnico di Torino. Her main research interests concern the physics-based modeling and simulation of microwave and optoelectronic devices.
 Raymond Quéré (Fellow IEEE) was born in 1954 in St Brieuc (France). He received the Electrical Engineering degree from ENSEEIHT Toulouse, France in 1976 and the French agrégation in Applied Physics in 1978. After a teaching period of eight years for undergraduated students, he prepared and earned a Ph.D. degree (with honors) from University of Limoges in 1989. In 1992 he was appointed full professor at the University of Limoges. From 1992 to 1997 he headed the Department of Electrical Engineering at the Institute of Technology of the University of Limoges. Since 1998 he leads the Nonlinear High-frequency Devices, Circuits and Systems Research Department at XLIM-CNRS Laboratory. This department gathers 70 permanent and non-permanent researchers and is involved in high-frequency devices circuits and systems design. His main field of interest is in the area of nonlinear device and circuit modeling with a particular emphasis on nonlinear phenomena such as stability in power amplifiers. He advises more than 30 Ph.D. students and he authors or co-authors more than 100 journal articles or communications in international conferences such as IMS/MTT, EuMW,etc. He was the co-author of the book “Nonlinear Stability of Nonlinear Microwave Circuits”. Moreover he is involved in a number of technical program committees and serves as a reviewer for several journals such as Electronic Letters, IEEE Transactions on MTT, etc. In 2005 he was appointed as the general Chairman of the European Microwave Week in Paris.