INTRODUCTION
Few would deny that parasites and their hosts share an evolutionary history. This idea, initially proposed as early as in the late 19th century (Von Ihering, Reference Von Ihering1891), triggered a plethora of studies aimed at understanding the evolutionary pathways of a variety of host–parasite associations (see Brooks, Reference Brooks1988; Klassen, Reference Klassen1992; Hoberg et al. Reference Hoberg, Brooks, Siegel-Causey, Clayton and Moore1997; Paterson and Gray, Reference Paterson, Gray, Clayton and Moore1997; Paterson and Banks, Reference Paterson and Banks2001 and references therein). Interest in shared host–parasite evolution has led to the formulation of several rules regarding it (Brooks, Reference Brooks1985; Brooks and McLennan, Reference Brooks and McLennan1991; Klassen, Reference Klassen1992). Two of these rules directly consider the relationships between host and parasite phylogenies. Fahrenholz's rule (Eichler, 1941a, b; cit. by Brooks, Reference Brooks1985) states that parasite phylogeny mirrors host phylogeny, whereas Szidat's rule (Szidat, 1956, 1960; cit. by Brooks, Reference Brooks1979) states that the more primitive the host, the more primitive the parasites it harbours.
Testing Fahrenholz's rule involves comparisons of the two phylogenies. If the only events during the process of reciprocal natural selection in the host and parasite lineages were those of contemporaneous speciation in both lineages, then host and parasite phylogenies would be fully congruent, thus supporting Fahrenholz's rule. From the beginning of the 1990s, analytical methods for comparing host and parasite phylogenies have been developed (see review in Paterson and Banks, Reference Paterson and Banks2001). These methods have allowed the patterns of host–parasite coevolution to be considered beyond mere narrative (e.g. Traub, Reference Traub and Kim1985). The availability of these new analytical methods led to numerous studies of host-parasite cophylogeny in a variety of different host–parasite systems (Hafner and Nadler, Reference Hafner and Nadler1988; Hafner and Page, Reference Hafner and Page1995; Desdevises et al. Reference Desdevises, Jovelin, Jousson and Morand2000, Reference Desdevises, Morand, Jousson and Legendre2002; Paterson et al. Reference Paterson, Wallis, Wallis and Gray2000; Caira and Jensen, Reference Caira and Jensen2001; Ronquist and Liljeblad, Reference Ronquist and Liljeblad2001; Krasnov and Shenbrot, Reference Krasnov and Shenbrot2002; Light and Hafner, Reference Light and Hafner2007). The results of these studies ranged from finding very similar topologies of phylogenies and clear evidence of cospeciation (e.g. Hafner and Nadler, Reference Hafner and Nadler1988) to highly incongruent phylogenies and, thus, a failure to detect cospeciation (e.g. Caira and Jensen, Reference Caira and Jensen2001). In other words, some host–parasite associations conformed to Fahrenholz's rule, whereas other host–parasite associations did not. Furthermore, when Fahrenholz's rule was supported, Szidat's rule seemed to hold as well. For example, studies that compared the phylogenies of gophers and their louse parasites demonstrated that the most basal species of the gopher genus Thomomys were exploited by lice of the most basal genus Thomomydoecus, although some more derived louse species were recorded on Thomomys as well (Hafner and Nadler, Reference Hafner and Nadler1990; Hafner and Page, Reference Hafner and Page1995). In general, host–parasite associations demonstrating conformity to Fahrenholz's and Szidat's rules involved highly host-specific parasites, such as ischnoceran lice, that are tightly connected to their hosts (but see Light et al. Reference Light, Smith, Allen, Durden and Reed2010 for anopluran lice). Indeed, lice are permanent ectoparasites (sensu Lehane, Reference Lehane2005) that spend their entire life on a host. In contrast, when comparisons were made between the phylogenies of hosts and their periodic ectoparasites (those that spend more time on their hosts than is required merely to obtain a blood meal but, nevertheless, spend much time off-host; Lehane, Reference Lehane2005) such as fleas, no congruency whatsoever between the two phylogenies was detected (Krasnov and Shenbrot, Reference Krasnov and Shenbrot2002; Lu and Wu, Reference Lu and Wu2005). The conclusions from these studies were that neither Fahrenholz's rule nor Szidat's rule holds for fleas (Krasnov, Reference Krasnov2008). Moreover, an attempt to map host associations on flea phylogeny did not demonstrate any evidence of tight links between flea diversification and host diversification (Whiting et al. Reference Whiting, Whiting, Hastriter and Dittmar2008).
One of the shortcomings of the studies of a shared evolutionary history between fleas and their hosts was that they considered a limited taxonomic set of either hosts or fleas (Krasnov and Shenbrot, Reference Krasnov and Shenbrot2002; Lu and Wu, Reference Lu and Wu2005; but see Whiting et al. Reference Whiting, Whiting, Hastriter and Dittmar2008), so that coevolutionary patterns, if any, could not be detected. In addition, Szidat's rule can be tested using a more coarse-grained fashion than the comparison of the two phylogenies in search of congruence between them. For example, one can look at the relationship between the relative age of the host species and the relative age of their parasites and ask whether more ‘primitive’ hosts harbour more ‘primitive’ parasites or vice versa. Presumably, the level of ‘primitivism’ of a species is related to its evolutionary age, which, in turn, can be estimated by the position of that species on a phylogenetic tree, even if information regarding its absolute age is not available. For example, using the topology of a phylogenetic tree, it is possible to identify basal (older) and derived (younger) species, i.e. species that originated at different distances from the root of the tree (e.g. Pagel, Reference Pagel1997, Reference Pagel1999, Reference Pagel, MacLeod and Foley2002; Knouft and Page, Reference Knouft and Page2003; Poulin, Reference Poulin2005; Poulin et al. Reference Poulin, Krasnov, Shenbrot, Mouillot and Khokhlova2006). If Szidat's rule holds, then the more basal hosts will harbour mainly basal fleas, whereas the more derived hosts will harbour mainly derived fleas and vice versa.
Here, we revised our earlier statement that Szidat's rule does not hold for fleas parasitic on small mammals (Krasnov, Reference Krasnov2008) and investigated the relationships between host and flea clade ranks in four biogeographic realms. We selected small mammals (excluding bats) because fleas are most abundant and diverse on this category of host species. From about 2000 flea species, only 60 species are considered as specific parasites of birds (Medvedev, Reference Medvedev1997a , Reference Medvedev b ). Furthermore, specific flea parasites of bats belong to the same family Ischnopsyllidae (120 species), and only a few species are specific parasites of large and medium-sized mammals (Medvedev, Reference Medvedev1997a , Reference Medvedev b ; Krasnov, Reference Krasnov2008). The conformity of the evolutionary relationships of small mammals and fleas to Szidat's rule would be indicated by a positive association between host and flea clade ranks. Given the common agreement on the Gondwanan origin of fleas (Medvedev, Reference Medvedev2005; Zhu et al. Reference Zhu, Hastriter, Whiting and Dittmar2015), we also expected that positive associations between mammal and flea clade ranks would be manifested in the Gondwana-originated (Afrotropics and Neotropics) rather than in the Laurasia-originated (Nearctic and Palearctic) realms.
MATERIALS AND METHODS
Data on fleas and hosts
We used data on fleas and small mammalian hosts (Didelphimorphia, Soricomorpha, Macroscelidea, Rodentia and Lagomorpha) extracted from published regional surveys carried out in four biogeographic realms (nine regions in the Afrotropics, 15 regions in the Nearctic, nine regions in the Neotropics and 21 regions in the Palearctic; see online Supplementary Materials). The data on either the number of host individuals examined or the number of fleas collected were not available for the absolute majority of surveys. Consequently, the data for each realm were organized as a presence/absence matrix. In total, our data included 580 flea and 528 mammal species.
Phylogenies
We used the most recent molecular phylogeny (Zhu et al. Reference Zhu, Hastriter, Whiting and Dittmar2015) as the backbone for the phylogenetic tree of fleas. This tree presented data on 205 species and 110 genera (ca. 10 and 46% of the total species and genera, respectively, of the order Siphonaptera; Medvedev, Reference Medvedev2005). Consequently, the positions of genera and species that were not represented in Zhu et al.'s (Reference Zhu, Hastriter, Whiting and Dittmar2015) tree, were determined according to their morphologically based taxonomic affinities (see Krasnov et al. Reference Krasnov, Poulin and Mouillot2011). We used the global phylogenetic supertree of Bininda-Emonds et al. (Reference Bininda-Emonds, Cardillo, Jones, MacPhee, Beck, Grenyer, Price, Vos, Gittleman and Purvis2007, corrigendum Reference Bininda-Emonds, Cardillo, Jones, MacPhee, Beck, Grenyer, Price, Vos, Gittleman and Purvis2008) as the backbone for the phylogenetic tree for mammals. The topology of branches within some clades was modified using various sources (see online Supplementary Materials).
Analyses
Because no information on branching time for the majority of flea and host lineages was available, we used phylogenetic clade rank as a proxy for species age. Clade rank is the number of branching events between a given species and the root of a phylogenetic tree (Knouft and Page, Reference Knouft and Page2003). Clade rank is expected to reflect the evolutionary position of a species; older species likely have relatively lower clade ranks and younger species likely have relatively higher ranks. We calculated the clade rank of each species (both fleas and mammals) using phylogenetic trees constructed for each realm. Calculations of clade ranks for species belonging to speciose families but underrepresented in a given realm could be biased. Consequently, speciose families represented in a given realm by a few species only were omitted from the analyses for that realm. For example, we omitted ceratophyllid and leptopsyllid fleas from the analyses for the Neotropical and Afrotropical realms, rhopallopsyllid and pulicid fleas from the analyses for the Nearctic realm, and sciurid rodents from the analyses for the Neotropical realm. In addition, we omitted from the analyses fleas with a cosmopolitan distribution (Xenopsylla cheopis, Leptopsylla segnis, Nosopsyllus fasciatus), as well as their synantropous hosts (Mus musculus, Rattus norvegicus, Rattus rattus). Information on branch length was not available for either flea or host phylogenetic trees. Consequently, all branch lengths were arbitrarily set to an equal length of 1, and the trees were arbitrarily ultrametricized using the program Mesquite 2·75 (Maddison and Maddison, Reference Maddison and Maddison2011). The clade rank of each species was calculated as a nodal distance to the root of a tree using the package ‘adephylo’ (Jombart and Dray, Reference Jombart and Dray2010), implemented in R 3·2·2 statistical environment (R Core Team 2015).
We looked at the relationships between host and flea clade ranks from both host and flea perspectives. From the host perspective, we tested for the association between host clade rank (the explanatory variable) and the mean rank of all flea species collected on this host (the response variable). From the flea perspective, we tested for the relationships between clade rank of a flea species (the explanatory variable) and the mean clade rank of all hosts on which this flea was recorded (the response variable). Any comparative analysis involving multiple species may be vulnerable to phylogenetic non-independence of the data points (Harvey and Pagel, Reference Harvey and Pagel1991). One of the most general approaches allowing the confounding effect of phylogeny to be controlled for is the phylogenetic generalized least-squares (PGLS) analysis (Martins and Hansen, Reference Martins and Hansen1997; Pagel, Reference Pagel1997, Reference Pagel1999; Freckleton et al. Reference Freckleton, Harvey and Pagel2002). This method controls for this effect by incorporating the phylogenetic autocorrelation of the data in the structure of errors (Martins and Hansen, Reference Martins and Hansen1997; Freckleton et al. Reference Freckleton, Harvey and Pagel2002). Commonly, the necessity of a PGLS is justified by the presence of a phylogenetic signal (i.e. a resemblance between phylogenetically related species; Blomberg et al. Reference Blomberg, Garland and Ives2003) in either a dependent or an independent variable or both (e.g. Ashton, Reference Ashton2002; Ezenwa et al. Reference Ezenwa, Price, Altizer, Vitone and Cook2006). In our analyses, the explanatory variable was directly associated with the phylogenetic position of either a host or a flea species and, thus, represented a characteristic of phylogeny. However, when a phylogenetic signal occurs in the dependent but not in the independent variable, the application of PGLS might be incorrect if the assumption of the distribution of the residual errors in the regression model (rather than in an original trait) is violated (multivariate normal distribution with variances and covariances proportional to the relations of the species, see Revell, Reference Revell2010 for details). In other words, the use of PGLS is justified if the residual deviations in the dependent variables’ given predictor variable(s) demonstrate phylogenetic signal (Revell, Reference Revell2010). In these cases, ordinary least-squares regressions (OLS) are preferable (Revell, Reference Revell2010). Furthermore, Revell (Reference Revell2010) demonstrated that estimating the phylogenetic signal in the original variables prior to regression analysis does not correctly diagnose the appropriateness of phylogenetic regression. Instead, the phylogenetic signal should be estimated simultaneously with the regression model.
Initially, we fitted three PGLS models for the relationships between the host clade rank and the mean clade rank of fleas collected from this host or between the flea clade rank and the mean clade rank of the hosts on which this flea was recorded for each realm, using packages ‘ape’ (Paradis et al. Reference Paradis, Claude and Strimmer2004) and ‘nlme’ (Pinheiro et al. Reference Pinheiro, Bates, DebRoy and Sarkar2015) implemented in R. The first model (mP) used a correlation matrix constructed using Pagel's (Reference Pagel1999) λ, which is a multiplier of the off-diagonal elements of the variance/covariance matrix describing the tree topology and branch lengths. It may range from zero to 1, gradually eliminating phylogenetic structure, so that zero λ indicates the phylogenetically independent evolution of a trait and λ = 1 indicates the Brownian motion model in the trait evolution on a given phylogenetic tree. The second model (mm) assumed the Ornstein–Uhlenbeck (OU) process of evolution. The OU model suggests that stabilizing selection around the adaptive optimum of a trait is the main evolutionary force (Hansen, Reference Hansen1997). In PGLS, the OU model is based on Martins and Hansen's (Reference Martins and Hansen1997) correlation matrix. The strength of stabilizing selection is represented by a parameter α. A zero value of α indicates a Brownian motion model, whereas very large α values indicate the unimportance of phylogenetic effects on trait evolution (e.g. Diniz-Filho, Reference Diniz-Filho2001). The third model (mG) used a modified Brownian motion model based upon transformation of branch length suggested by Grafen (Reference Grafen1989). Then, we selected the model with the best fit based on the Akaike's information criterion.
To ensure proper selection of the regression (OLS vs PGLS) used, we then tested the residuals from each best model for a phylogenetic signal using Pagel's (Reference Pagel1999) λ (see above) and Blomberg et al.'s (Reference Blomberg, Garland and Ives2003) K. Similarly to Pagel's (Reference Pagel1999) λ, K assumes a Brownian motion model of evolutionary process in which the evolutionary changes along the branches are expected to have zero values. Their distribution is normal with a variance proportional to the branch length (Felsenstein, Reference Felsenstein1985). K is calculated as a quotient of the observed and expected mean square error (MSE) ratios. The observed ratio is the MSE of the tip data, measured from the phylogenetically correct mean, divided by the MSE of the data calculated using the variance–covariance matrix derived from the tree. The expected ratio is computed from the phylogenetic tree and Brownian motion as a model for the evolutionary process. A value of K = 1 indicates that a Brownian motion is the true evolutionary model for a given trait, which implies some degree of phylogenetic signal. A zero K value indicates no effect of phylogeny, whereas K values greater than 1 suggest a strong phylogenetic signal in a trait. We calculated λ and K using the package ‘phytools’ (Revell, Reference Revell2012) implemented in R, and we tested the significance of the phylogenetic signal either by a likelihood ratio test against the null hypothesis that λ = 0 or by the randomization test of Blomberg et al. (Reference Blomberg, Garland and Ives2003), respectively.
Then, we either re-applied PGLS or applied OLS separately for each realm. When we estimated the phylogenetic signal in the residual error simultaneously with the estimation of the regression parameters in the phylogenetic GLS (see Revell 210), the values of Pagel's (Reference Pagel1999) λ were, obviously, the same as those estimated using the ‘phytools’ package. The values of the explanatory and the response variables were log-transformed prior to the analyses. Finally, to estimate the overall fit of each model, we compared the best models with either a model implying star phylogeny (for PGLS) or a model with intercept only (for OLS).
RESULTS
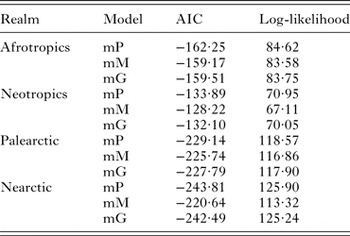
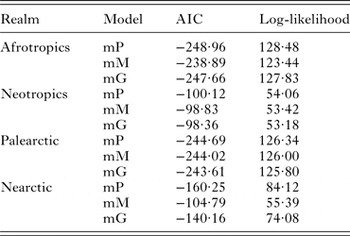
The results of the application of models that differed in their method of correlation matrix construction are presented in Tables 1 (host perspective) and 2 (flea perspective). Although all models were similar in their fit to the data in each realm, the models incorporating the correlation matrix derived using Pagel's (Reference Pagel1999) λ appeared to provide slightly better fits than the other models.
Summary of the application of three PGLS models with different correlation structures (see text for explanations) for testing the relationship between the host rank clade and the mean clade rank of fleas collected from this host in four biogeographic realms. AIC, Akaike's information criterion. See text for the specification of models mP, mM and mG.

Summary of the application of three PGLS models with different correlation structures (see text for explanations) for testing the relationship between the flea rank clade and the mean clade rank of hosts exploited by this flea in four biogeographic realms. AIC, Akaike's information criterion. See text for the specification of models mP, mM and mG.

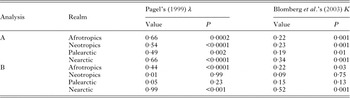
In the analyses from the host perspective, the residuals of the PGLS with a correlation structure built using Pagel's (Reference Pagel1999) λ demonstrated a significant phylogenetic signal for all realms (Table 3). However, in the analyses from the flea perspective, a significant phylogenetic signal in the residuals of the mean host clade rank (given flea clade rank) was detected for the Afrotropics and Nearctic but not the Neotropics and Palearctic (Table 3). Consequently, we applied the PGLS to test for the relationships between flea and host clade ranks for the two former realms, but used the OLS for the two latter realms.
Results of Pagel's (Reference Pagel1999) and Blomberg et al.'s (Reference Blomberg, Garland and Ives2003) tests for phylogenetic signal in the residuals of the PGLS of (A) the relationships between the host rank clade and the mean clade rank of fleas parasitic on this host and (B) the relationships between the flea rank clade and the mean clade rank of hosts exploited by this flea in four biogeographic realms.

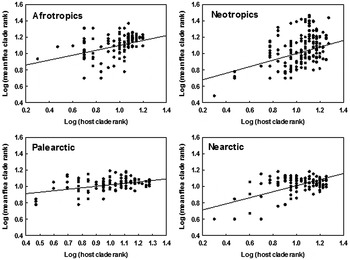
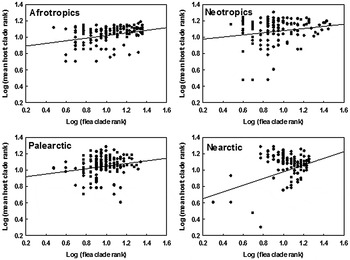
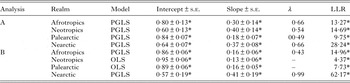
Regression (either PGLS or OLS) models revealed significant positive relationships between the host clade rank and the mean clade rank of fleas exploiting this host, as well as between the flea clade rank and the mean clade rank of their host spectra (Table 4). The mean clade rank of fleas parasitic on a given host increased with an increase of this host's clade rank and the mean clade rank of hosts recorded on a given flea increased with an increase of this flea's clade rank (Figs 1 and 2).
Relationships between the host clade rank and the mean clade rank of fleas parasitic on this host for four biogeographic realms. The trend lines are from PGLS fits.

Relationships between the flea clade rank and the mean clade rank of hosts harbouring this flea for four biogeographic realms. The trend lines for the Afrotropics and the Nearctic are from PGLS fits; the trend lines for the Neotropics and the Palearctic are from OLS fits (see text for explanations).

Summary of phylogenetic generalized least-squares (PGLS) and ordinary least-squares (OLS) analyses of the relationships between (A) the host clade rank (explanatory variable) and the mean clade rank of fleas parasitic on this host (response variable) and (B) the flea clade rank (explanatory variable) and the mean clade rank of hosts harbouring this flea (response variable) for four biogeographic realms. λ (for PGSL): Pagel (Reference Pagel1999) λ (see text for explanation).
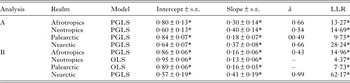
LLR, log-likelihood ratio when compared with a model with star phylogeny (for PGLS) and a model with intercept only (for OLS); s.e., standard error.
*−P < 0·05; ns, non-significant.
DISCUSSION
We found that, in general, the pattern of distribution of flea species on small mammals in all studied biogeographic realms, whether they originated from Gondwana or Laurasia, conformed to Szidat's rule. Basal host lineages harboured, on average, more fleas of the lower clade ranks than derived host lineages did. Similarly, basal flea lineages were recorded, on average, on more basal host species than were derived flea lineages.
These findings contradict earlier statements that the shared evolution of small mammals and their fleas most likely did not involve co-diversification (see Krasnov, Reference Krasnov2008). Although this claim may be true at small taxonomic scales (e.g. flea or host genus; Lu and Wu, Reference Lu and Wu2005), results of this study suggest that this may not be the case at the scale of the entire (or at least, the largest part) flea and/or host fauna. Furthermore, biogeographic data present some, albeit indirect, evidence for co-diversification of fleas and small mammals. Morrone and Gutiérrez (Reference Morrone and Gutiérrez2005) applied a panbiogeographical analysis (see Craw et al. Reference Craw, Grehan and Heads1999 for details) to the geographic distribution of 112 flea species belonging to 48 genera and eight families in the Mexican transition zone, and argued that a significant diversification of fleas and their mammalian hosts occurred in parallel. Earlier narrative studies of the distribution of flea taxa across host taxa also suggested that codiversification occurred to some degree during the evolution of flea–mammal associations. For example, Traub (Reference Traub and Kim1985) noted the tendency of modern fleas to be associated with the taxa of hosts on which they evolved. In particular, Traub (Reference Traub and Kim1985) mentioned that representatives of the basal flea family Stephanocircidae are mainly recorded on the most basal mammal lineages, such as marsupials, and that the absolute majority of Ceratophyllidae, the youngest flea family, do not exploit primitive mammals, such as soricomorphs and erinaceomorphs, nor basal rodent lineages such as aplodontids. A recent rigorous analysis of flea phylogeny and host associations by Zhu et al. (Reference Zhu, Hastriter, Whiting and Dittmar2015) supported the ideas of Traub (Reference Traub and Kim1985) of flea–host codiversification, at least at the scale of major lineages, and demonstrated that indeed, the scenario of early fleas establishing parasitic relationships with early marsupials is plausible.
The relationships between flea and host clade rank found in this study appeared to be significant but not especially strong. Moreover, the distribution of data points in Figs 1 and 2 demonstrated that, although the trend of more primitive hosts harbouring more primitive fleas was apparent, many fleas from basal families were, nevertheless, associated with evolutionarily young hosts, whereas evolutionarily young fleas were associated with evolutionarily primitive hosts. For example, among species belonging to the subgenus Alloctenus of the genus Ctenophthalmus, the most basal species are parasites of sigmodontine rodents (Muridae), whereas the most derived species are exclusive parasites of the shrew genus Cryptotis (Morrone et al. Reference Morrone, Acosta and Gutiérrez2000). The most likely reason for the relatively weak relationships between flea and host clade rank, as well as general incongruence between flea and host phylogenies reported earlier (Krasnov and Shenbrot, Reference Krasnov and Shenbrot2002; Lu and Wu, Reference Lu and Wu2005), is that the shared evolution of flea–host associations (at least, on later stages; see below) was dominated by events other than codiversification.
Events leading to incongruence between parasite and host phylogenies have been discussed widely (e.g. Paterson and Gray Reference Paterson, Gray, Clayton and Moore1997; Paterson and Banks, Reference Paterson and Banks2001; Roy, Reference Roy2001), although definitions have differed somewhat among authors. These events include: (a) host switching (when a parasite species colonizes a host taxon from a different lineage); (b) duplication (when a parasite speciates without host speciation); (c) lineage sorting (when a parasite species is lost); and (d) inertia (when a host's speciation is not accompanied by a parasite's speciation). Krasnov and Shenbrot (Reference Krasnov and Shenbrot2002) demonstrated that events of all these types likely occurred during the evolutionary history of dipodid rodents (jerboas) and their fleas. Nevertheless, host switching seemed to be the most common event during this history, so that distribution of flea species on jerboa species was better explained by ecological, geographic and historical factors rather than by codiversification.
Host switching (i.e. a change of a host species by a parasite species) may occur not only at temporal scales (both evolutionary and ecological), but also at spatial scales (e.g. Shenbrot et al. Reference Shenbrot, Krasnov and Lu2007 for fleas). Moreover, it is sometimes thought that host switching is a manifestation of so called ‘ecological fitting’, i.e. situations in which an organism interacts with its environment in a way that suggests a shared evolutionary history, when in reality, the traits relevant to the interaction evolved elsewhere and in response to a different set of conditions (Janzen, Reference Janzen1985). Regarding parasites, ecological fitting is considered a phenomenon in which parasites track not a host per se but rather a resource provided by a host, so that they may relocate to geographic areas where the resource (e.g. blood) is present, but where its ‘original source’ (i.e. the original host species) does not occur (Brooks et al. Reference Brooks, León-Règagnon, McLennan and Zelmer2006). Obviously, if this parasite is lost from the original host either simultaneously with acquiring a new host or later, then earlier congruence between parasite and host phylogenies (if any) will be distorted. The primary resources provided to fleas by a host are its blood (food for imagoes) and its burrow/nest (environment for pre-imago of the majority of flea species). Given that both physiological (e.g. blood properties) and ecological characteristics (e.g. burrow architecture) are likely more similar among phylogenetically close than phylogenetically more distant host species (Brooks and McLennan, Reference Brooks and McLennan1991; Harvey and Pagel, Reference Harvey and Pagel1991), host switches are more likely to be to new hosts that are closely, rather than distantly, related to an original host. The idea that host switching in fleas may be constrained by host phylogeny is indirectly supported by our earlier study (Krasnov et al. Reference Krasnov, Shenbrot, Khokhlova and Poulin2004). Krasnov et al. (Reference Krasnov, Shenbrot, Khokhlova and Poulin2004) demonstrated that flea abundance in its auxiliary hosts decreased with increasing taxonomic distance of these hosts from the principal host, suggesting that every time a flea added a new host to its host spectrum, the taxonomic/phylogenetic affinity of this new host mattered.
Interestingly, Traub (Reference Traub, Traub and Starke1980, Reference Traub and Kim1985) noted that when fleas switched from their original hosts to other hosts, these new hosts were often more advanced (i.e. phylogenetically more derived) and rarely more primitive (i.e. phylogenetically more basal) than the original hosts. It has never been specifically tested whether evolutionary host switching is directional as argued by Traub (Reference Traub, Traub and Starke1980, Reference Traub and Kim1985). However, the distribution of data points, above and below the fitting lines in Fig. 2, suggests that this scenario is plausible. Indeed, in each biogeographic realm studied here, the proportion of flea species with positive residuals (i.e. exploiting hosts, on average, more derived than expected) was significantly greater than the proportion of flea species with negative residuals (i.e. exploiting hosts, on average, more basal than expected) (61·3–75·2 vs 24·8–38·7%; χ 2 = 29·10, P < 0·001).
Another reason for the relatively weak relationships between flea and host clade ranks is the limited information on the host spectra of insufficiently studied and/or rare flea species as well as on mammalian species that are rarely examined for parasites. This is especially true for the Afrotropical and Neotropical realms. For example, Xenopsylla petteri from Madagascar was found on Hypogeomys antimena only (Klein and Uilenberg, Reference Klein and Uilenberg1966). However, this flea is very rarely mentioned in the literature, so it is unclear whether it is indeed highly host-specific (which is not the case for the majority of its congeners) or has been merely understudied. Similarly, Abrothrix andinus has been found to harbour a single flea species (Cleopsylla townsendi; Berrizbeitia et al. Reference Berrizbeitia, Fernanda, Diaz, Barquez and Lareschi2013). However, it is unclear whether the lack of other flea species on this host is real or merely the result of insufficient sampling since from seven to 23 flea species were recorded on other Abrothrix species (Beaucournu and Gallardo, Reference Beaucournu and Gallardo1991a , Reference Beaucournu and Gallardo b ). Accidental host–flea associations can also not be refuted, because many fleas reside in hosts’ burrows and thus may attack a non-characteristic host species that visits the burrow of a characteristic host (Krasnov and Khokhlova, Reference Krasnov and Khokhlova2001).
Combining the results of our study with those of Krasnov and Shenbrot (Reference Krasnov and Shenbrot2002); Lu and Wu (Reference Lu and Wu2005), and Zhu et al. (Reference Zhu, Hastriter, Whiting and Dittmar2015), it can be suggested that the codiversification of fleas and their mammalian hosts occurred mainly at the deepest levels of both flea and mammal phylogenies (Zhu et al. Reference Zhu, Hastriter, Whiting and Dittmar2015), whereas the subsequent evolution of flea–mammal associations was accompanied mainly by host switching events, duplications and extinctions (e.g. Krasnov and Shenbrot, Reference Krasnov and Shenbrot2002). However, codiversification of parasites and their hosts at the deep levels of phylogenies may not the case for other taxa of ectoparasitic arthropods (e.g. anopluran lice; Light et al. Reference Light, Smith, Allen, Durden and Reed2010).
SUPPLEMENTARY MATERIAL
To view supplementary material for this article, please visit http://dx.doi.org/10.1017/S0031182016000159
ACKNOWLEDGEMENT
We thank Sandrine Pavoine for help with the R code. This is publication no. 893 of the Mitrani Department of Desert Ecology.
FINANCIAL SUPPORT
This study was supported by the Israel Science Foundation (grant no. 26/12 to BRK and ISK). DK received financial support from the Blaustein Center for Scientific Cooperation. EMW received financial support from the United States-Israel Educational Foundation (USIEF; Fulbright Post-Doctoral Fellowship) and the Swiss Institute for Dryland Environmental and Energy Research.