Implications
This study illustrates that analysis of routinely collected data from official horse welfare inspections can give us insights into where efforts should be targeted to have the greatest impact in improving animal welfare. Specifically, our study suggests that targeting education strategies at personnel responsible for supervising, caring for, and feeding horses is likely to have the greatest impact on horse welfare. This is because deficiencies in these areas were most commonly associated with welfare problems related to hoof condition, body condition and cleanliness (e.g. presence of dried manure or sweat, that may lead to or have caused skin conditions, lesions or sores) of horses. The success of such an educational intervention strategy could then be assessed over time by benchmarking the prevalence of these animal-based measures.
Introduction
Although historically veterinary epidemiology has focussed on the investigation of animal diseases in populations, it has broadened to include aspects aimed at reducing productivity losses and improving animal welfare (Pfeiffer, Reference Pfeiffer2010). Veterinary epidemiology, applied to the field of animal welfare, can thus also be used to describe the frequency of animal welfare outcomes (animal-based measures) and the associations between those outcomes and various non-modifiable and modifiable inputs (e.g. resource- and management-based measures) (Willeberg, Reference Willeberg1997; Green and Nicol, Reference Green and Nicol2004; Millman et al., Reference Millman, Johnson, O’Connor and Zanella2009).
Assessment of animal welfare often involves recording a combination of resource-, management- and animal-based measures. Resource-based measures consist of observations of the animal’s environment and resources available (e.g. stable height, floor surface, bedding material), whereas management-based measures consist of management practices including whether sick and injured animals are treated appropriately, how often horses are exercised, and whether appropriate documentation is in place (e.g. passports, veterinary records) (EFSA Panel on Animal Health and Welfare (AHAW), 2012). Resource- and management-based measures have historically been used to assess welfare (Hubbard and Scott, Reference Hubbard and Scott2011), but are now seen as more important for assessing the risk of poor welfare, whereas animal-based measures, that is those relating directly to the physical health, behaviour and mental state of the animals, are considered more direct indicators of animal welfare (EFSA Panel on Animal Health and Welfare (AHAW), 2012).
Official inspectors are employed by the official competent authorities (in Sweden, these are the county administrative boards) to carry out inspections of farms and other premises that keep animals to check compliance with Swedish and European Union (EU) animal welfare legislation. Since 2009 data from these animal welfare inspections have been collected according to standardised species-specific checklists covering production animals, companion animals, and animals used for sports and entertainment. Inspections may be conducted for varying reasons, for example because of a high-risk animal activity, or a complaint about a potential animal welfare issue. One of the species-specific checklists concerns equine welfare.
Although there is a lot of research on equine welfare, most epidemiological studies have focussed on factors associated with specific welfare problems, for example stereotyped behaviour (McGreevy et al., Reference McGreevy, French and Nicol1995a; Bachmann et al., Reference Christie, Hewson, Riley, McNiven, Dohoo and Bate2003; Sarrafchi and Blokhuis, Reference Sarrafchi and Blokhuis2013), internal parasites, dental problems, hoof defects (Christie et al., Reference Christie, Hewson, Riley, McNiven, Dohoo and Bate2004), and body condition (Giles et al., Reference Giles, Rands, Nicol and Harris2014; Geiger and Hovorka, Reference Geiger and Hovorka2015), using relatively small sample sizes. Equine welfare is important, particularly in Sweden because this country has the highest number of horses per capita in the EU, although Germany and Great Britain have the largest horse populations (Liljenstolpe, Reference Liljenstolpe2009). In 2010 it was estimated that there were 362 700 horses on ~77 800 premises in Sweden (Swedish Board of Agriculture, 2011). As far as we know, there have been no previous epidemiological studies that have reported analyses of equine welfare in large populations using a database of routinely collected data. Thus, we employ an epidemiological approach to determine the premises-level prevalence of poor equine welfare in Sweden using information from regulatory inspections by official competent authorities in Sweden. Further, we identify resource- and management-based factors associated with non-compliance with checkpoints (CPs) concerning animal-based measures (welfare outcomes).
Methods
Data sources
Data from official animal welfare inspections at registered premises in all 21 counties of Sweden from 1 January 2010 to 31 December 2013 were provided by the Swedish Board of Agriculture (Jordbruksverket; JV). Premises are registered for animal welfare control if they have been visited previously (e.g. because of a complaint), because they keep four or more horses and conduct activities such as breeding, providing, selling or keeping horses, because they have obtained prior approval to build new stables, or because information about the type of premises was collected otherwise (Swedish Board of Agriculture, 2004). Three data sets, one containing information on the inspection sites (premises), one containing inspection information, and one containing the outcomes from assessment of each CP on the relevant species-specific checklist used by the authority at inspection, were provided separately for each county and were merged into one data set. Data pertaining to compliance with legislative requirements for the keeping of horses were identified and extracted for further analysis. Data were recorded at the premises level, with some premises contributing data on multiple inspections. Data at the individual animal level were not recorded.
Data on the human population (as of 31 December each year), land area (as of 1 January of the following year), and human population density by county were obtained from Statistics Sweden for the study years 2010–13 (Statistics Sweden, 2014). The number of horses in each county, for the year 2010, were obtained from JV (Swedish Board of Agriculture, 2011).
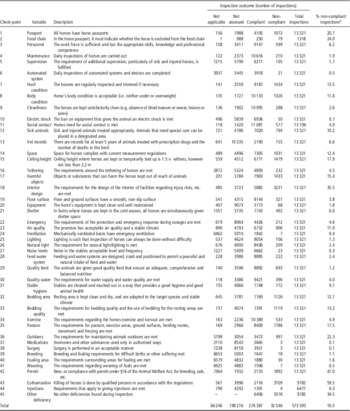
The species-specific checklists contain a series of statements or questions designed to assess compliance with Swedish and EU animal welfare legislation, we call these ‘checkpoints’ (CPs) and there were 45 CPs on the horse checklist. The original checklist was in Swedish and a translation is provided in the column ‘Description’ in the penultimate table. The horse checklist CPs concerned existence of a permit for commercial operation, and sufficiency of personnel (one CP each); daily maintenance, supervision, care, and physical state of the animals (hoof condition, body condition, animal cleanliness), social contact with conspecifics, permitted tack and equipment, sufficient lighting that allows for monitoring animals effectively, and acceptable routines for euthanasia (10 CPs); documentation (two CPs), freedom of movement indoors and outdoors (four CPs), buildings and accommodation (15 CPs), facility machinery (two CPs), feed and water (four CPs), veterinary care (two CPs), breeding (two CPs) and other (two CPs). In the horse checklist, each CP is numbered, and from here on in is referred to as CP-n, where n is the number specified in the penultimate table. A CP regarding the presence of horses not acceptable for human consumption (CP-2) was discontinued from 2011. A new CP added for 2012 onwards included whether the requirements that apply to veterinary injections were met (CP-44). The outcome from assessment of each CP was recorded by the inspector as either compliant, non-compliant, no assessment carried out, or not applicable (not applicable for these premises or this inspection occasion). The original checklist and the guidelines inspectors followed in their assessments (Swedish Board of Agriculture, 2007) are available by contacting the corresponding author.
Data editing and construction of variables
The 45 CPs described above were categorised as animal-based (outcome), or resource- or management-based (input). Our definition of poor equine welfare for the purpose of this study was non-compliance with one or more of the animal-based CPs in the Swedish animal welfare legislation. The outcome from inspection for the four animal-based CPs concerning hoof condition, body condition, cleanliness and social contact (CP-7 to 9 and 11, respectively) were used as outcomes of animal welfare and coded as compliant (0) or non-compliant (1) with the CP. For animal-based CPs, a premises was non-compliant against the relevant CP if at least one horse was observed not to meet requirements. Animal-based CPs categorised as either not applicable or no assessment carried out were treated as missing and these inspections were excluded from each model. The two CPs with incomplete data for the entire study period (CP-2, CP-44) were also excluded from analysis. An aggregate animal-based outcome was created and coded as compliant (0) if the inspection complied with all the CPs concerning animal-based measures that were assessed, and non-compliant (1) if the inspection did not comply with at least one of the animal-based CPs. The aggregate outcome was treated as missing only if all four contributing animal-based CPs were not assessed. For descriptive purposes, the percentage of non-compliance was calculated as the number of non-compliant inspections divided by the number of both compliant and non-compliant inspections, multiplied by 100.
Data included information as to whether the inspection was refused by the premises owner, whether the inspection was announced before inspection, and the inspection type (reason for inspection). Inspection type was categorised into four groups: (1) normal inspections, that included normal risk-based inspections, whereby criteria were used to select premises based on risk determined by JV; normal random inspections, whereby premises were selected randomly; and normal directed inspections, whereby premises were selected for a specific project or campaign initiated by the official competent authorities, for example targeting a certain species; (2) complaint inspections, which were conducted as a result of complaint by, for example, the general public, a veterinarian, the police, or an animal welfare organisation, these may be unwarranted if non-compliance could not be verified; (3) monitoring inspections, including follow-up on deficiencies identified in previous normal or complaint inspections; and (4) application inspections, which were related for example to an application for a permit for a commercial operation or public exhibition, a full or enhanced cross-compliance inspection according to EU European Directives and Regulations, or another public inspection (not related to animal welfare) (Supplementary Table S1).
The horse population density by county was calculated by dividing the number of horses by the land area in square kilometres. We calculated the total number of animal species and the number and types of different animal-related activities registered to each horse premises. Inspections that indicated that the activity being undertaken was an event (e.g. horse competition) were excluded because they represented unique inspections occurring on the same day (n=65 observations). All other activities conducted in association with horse keeping are listed in Supplementary Table S2. Premises that were recorded as holding a permit under §16 of the Swedish Animal Welfare Act (Reference Bachmann, AudigÉ and Stauffacher1988: 534), for ‘an operating permit required by any person who, on a professional basis or on a substantial scale: 1. keeps, breeds, supplies or sells pet animals or receives pet animals for boarding or feeding; 2. keeps, breeds, supplies or sells horses or receives horses for boarding or feeding or uses horses in a riding school business; or 3. breeds fur animals’ [13, 14] were categorised as a ‘professional establishment’.
To reduce the (correlated) resource- and management-based CPs to a group of key composite variables, we conducted a latent class analysis by obtaining pairwise tetrachoric correlation estimates of the binary CP compliance data (Edwards and Edwards, Reference Edwards and Edwards1984). The correlation matrix was then used to perform a principal component analysis (PCA) of the binary variables (StataCorp, Reference StataCorp2013). A total of 28 resource- and management-based CPs were identified and included in the PCA. CPs not included in the PCA were the animal-based CPs used as outcome variables (CP-7 to 9, 11), documentation (CP-1, 13), new permits (CP-42), or breeding (CP-39 to 41) where the majority of inspections were not applicable or no assessment was carried out, and those with incomplete records (CP-2, 43 to 45) or with less than 10 occurrences of non-compliance (CP-24, 37, 38). The scree test, Kaiser criterion and proportion of variance were used to determine the number of meaningful principal components. The first seven components with eigenvalues greater than one were scrutinised, but only three components, each accounting for more than 7% of the total variance, were retained. Component 1 – stabling and shelter (41.7%), component 2 – supervision, care or feeding of horses (11.4%), and component 3 – design of facilities (7.9%) together accounted for 61.0% of the overall variance. We performed a varimax orthogonal rotation to maximise the sum of variances of the squared loadings within factors (Kaiser, Reference Kaiser1958). Absolute value loadings >0.30 were considered for inclusion in the component. If a factor loaded on to more than one component, that factor was excluded from the interpretation. Refer to Supplementary Table S3 for the full PCA results.
A new binary variable was created for breeding (CP-39 to 41), documentation (CP-1, 13) and each principal component, coded as compliant (0) if the inspection complied with all CPs that were inspected within the component or non-compliant (1) if the inspection did not comply with at least one of the CPs within the component. The component was treated as missing if all CPs loading under that component were note assessed. Consequently, there was a large proportion of missing data for the aggregated variables – breeding (30.6% missing), documentation (57.8%), component 1 (21.2%), component 2 (11.9%) and component 3 (21.1%).
Statistical analysis
Results from normal random inspections were used to assess prevalence. Premises-prevalence and 95% confidence intervals (CI) were estimated using the exact binomial distribution.
To investigate associations between the animal-based measures, we generated pairwise tetrachoric correlation coefficients for binary variables. We used the latent variable method for calculating the intra-class correlation coefficients (ICCs) of potential random-effects in a multilevel intercept-only model of the aggregate animal-based outcome, assuming a binomial distribution (Snijders and Bosker, Reference Snijders and Bosker1999). Multilevel models with random effects for premises, inspector and county were tested, but did not converge. In contrast, models adjusting for clustering on premises only were found to converge without problem and were therefore used.
Univariable logistic regression was used to relate the animal-based outcomes with resource- and management-based CPs and composite measures (documentation, breeding and components 1 to 3), inspection factors (inspection type, refusal of inspection, no notification of inspection, year, season, and whether there had been amendments to the checklist) and premises factors (location, human population density, horse population size (number of horses) of the county, horse population density of the county, number of horses registered at the premises, number of animal species, number of activities on the premises, and presence of specific activities) (Supplementary Table S2). To estimate the trend for either an increase or decrease in animal-based compliance across the study period, a linear term for year of inspection was used. Odds ratios (OR) and their 95% CIs, adjusting for clustering on premises, were calculated.
The risk factors from univariable analyses with P<0.2 were entered into a multivariable model and retained in the model if they were statistically significant (P⩽0.05), or if they modified the coefficients of other covariates by more than 10% (indicating confounding), using a backward stepwise elimination approach. Already eliminated variables were tested one by one for re-entry into the model following completion of backward stepwise elimination. Five models were generated; one for each of the four animal-based CPs, and one for the aggregate animal-based outcome. Two-way interactions between main effects that were significant in multivariable analysis were assessed and retained if statistically significant (P⩽0.05). Model diagnostics performed on the final models included the Hosmer–Lemeshow’s goodness-of-fit test, the link test to identify model specification error, and examinations of tolerance (>0.1) and variance inflation factor (VIF<10) to assess collinearity within the model. All statistical analyses were conducted using Stata, version 13.1 (StataCorp, College Station, Texas, USA).
Results
Premises and inspection characteristics
There were 30 053 premises with horses from 21 counties registered in the national animal welfare control database, accounting for 38.6% (30 053/77 800) of all estimated premises with horses in Sweden. A total of 13 321 horse checklist inspections were conducted by official animal welfare inspectors (n=330 inspectors) at 28.4% (n=8532) of these registered premises during the study period.
Descriptors of all inspection types are presented in Table 1. The most frequently reported activities at horse premises were keeping horses for leisure purposes (n=5900), professional horse establishment (n=2152), meat production of other species (n=1687), and keeping pets (n=1349), the latter two of which may or may not be related to the activities involving horses. Normal, random inspections constituted 6.1% (809/13 321) of all inspections, and were performed at 9.2% (787/8532) of inspected premises. Additional information, in free-text format, available on the specifics of the activity was not adequate for analysis (only available for 12.4% or 1657/13 321 of inspections).
Descriptors of the horse premises characteristics, stratified by type of inspection, based on official animal welfare inspections of horse premises conducted in Sweden, 2010–13

a New, or compliance with an operating permit under §16 of the Animal Welfare Act for continuous variables, the median and interquartile range (IQR) are presented.
b Total includes inspection types that have not been detailed here – normal applications for public exhibition (n=5), normal application for other public inspection (n=5), and enhanced inspection for production animals (n=1).
c Of the inspected premises, 4421 premises had information on the number of horses kept.
d Number of animal-related activities conducted, not necessarily associated with the keeping of horses.
Non-compliance
Table 2 presents percentage non-compliance for all inspection types at all inspections (i.e. inclusive of multiple inspection results at some premises) and here we report premises non-compliance (i.e. where multiple inspections at a premises are collapsed, and the premises is classified as non-compliant if it was observed as such at least once during the study period). There were 1953 (22.9%) premises non-compliant with at least one of the animal-based CPs over the study period, but for normal random inspections only this figure was 9.5% (68/713; 95% CI 7.5, 11.9). Of all premises, 1443 (16.9%) were assessed as having poor equine welfare, as indicated by the aggregate animal-based outcome, at one inspection, 302 premises (3.5%) at two inspections, and 208 premises (2.4%) at three or more inspections over the 4-year study period. For premises that had at least one normal random inspection over the 4 years, 5.1% (35/689; 95% CI 3.6, 7.0) did not comply with requirements for hoof condition, 3.0% (21/692; 95% CI 1.9, 4.6) for body condition, 2.4% (17/706; 95% CI 1.4, 3.8) for social contact and 0.3% (2/689; 95% CI 0.03, 1.0) for cleanliness, on these random inspections.
Outcome of official animal welfare inspections of horse premises in Sweden, 2010–13

a Calculated as: number of non-compliant inspections/(number of compliant+non-compliant inspections)×100.
For normal random inspections of premises, there were no significant trends for either increasing or decreasing animal-based compliance across the study years (social contact, P=0.10; body condition, P=0.90; hoof condition, P=0.40; cleanliness, P-value unobtainable). When all inspection types were considered, there was a significant increase in non-compliance with body condition (P=0.01), and a significant decrease in non-compliance with social contact (P=0.01) and hoof condition (P=0.02) across years, but these trends did not remain in multivariable analysis. Non-compliance with cleanliness did not differ over the study years (P=0.70).
Models of animal-based measures
Hoof condition, body condition and cleanliness correlated strongly with each other (ρ=0.46 to 0.47, P<0.001), but only weakly with social contact (ρ=0.12 to 0.21, P<0.001). In intercept-only multi-level models, the ICC was highest for premises (ICC 0.45; 95% 0.41, 0.50), followed by inspector (ICC 0.12; 95% CI 0.09, 0.15), and county (ICC 0.04; 95% CI 0.02, 0.07).
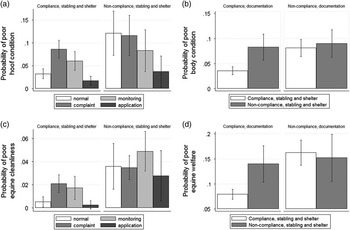
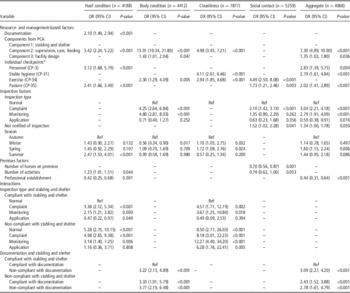
Supplementary Table S2 presents univariable results and Table 3 multivariable results for associations of animal-based non-compliance with resource- and management-based, inspection and premises factors, adjusted for clustering on premises. All multivariable models, with the exception of the model for poor social contact, had significant interaction effects (Figure 1).
Significant interactions from multivariable logistic regression models of factors associated with non-compliance with animal-based outcomes, presented as marginal effects (average probabilities at each level of the variable) with 95% confidence intervals, adjusted for clustering on premises, based on official animal welfare inspections of horse premises in Sweden, 2010–13. Interactions are presented as follows: (a) hoof condition – interaction between stabling and shelter, and inspection type (complaint, P=0.003; monitoring, P=0.014); (b) body condition – interaction between stabling and shelter, and documentation (P=0.005); (c) cleanliness – interaction between stabling and shelter, and inspection type (complaint, P=0.011); (d) aggregate – interaction between stabling and shelter, and documentation (P=0.004).

Results of multivariable logistic regression models of factors associated with non-compliance with five animal-based outcomes, adjusted for clustering on premises, based on official animal welfare inspections of horse premises in Sweden, 2010–13

OR=odds ratio; CI=confidence interval; PCA=principal component analysis; CP=checkpoints.
Interactions are presented in Figure 1.
a CPs that did not load on a component in the PCA.
In the multivariable analysis the odds of poor equine welfare, as indicated by the aggregate animal-based outcome, were significantly higher at inspections where non-compliance was found with requirements for supervision, care or feeding of horses (component 2), or design of facilities (component 3) than at inspections without such non-compliances. The association with requirements for passports or veterinary records (documentation) differed by stabling and shelter (component 1), in that horses at premises compliant with stabling and shelter requirements had lower odds of poor equine welfare if the premises also complied with requirements for documentation (Figure 1d). Checkpoints associated with poor equine welfare included non-compliance with a sufficiently knowledgeable workforce (CP-3, personnel), cleanliness and hygiene of the stables (CP-31, stable hygiene), and maintaining safe pasture and exercise areas (CP-35, pasture).
Inspections due to a complaint or motivated by follow-up on previously identified deficiencies were more likely to record poor equine welfare, as indicated by the aggregate outcome, at the premise, while application inspections had lower odds, compared with normal inspections. At inspections that had been notified beforehand, the premises were more likely to comply with all animal-based CPs than were those premises without prior notification. There was a higher likelihood of observing poor equine welfare in spring compared with autumn, and a lower likelihood at premises that were classified as professional establishments.
There were minor differences between the four singular welfare models and the aggregate model. Non-compliance with CP-34 (exercise and turnout of horses) was associated with poor body condition, cleanliness and social contact, but not hoof condition. Inspections on premises where there were fewer horses and fewer animal-related activities had a higher likelihood of poor social contact. Poor hoof condition was more common at premises that conducted a higher number of animal-related activities. Similar to the interaction observed in the aggregate model, a lower likelihood of poor body condition was seen at inspections compliant for both documentation and stabling and shelter requirements (Figure 1a). Significant differences in the odds of poor hoof condition or poor horse cleanliness by inspection type were only observed at inspections that complied with requirements for stabling and shelter (Figure 1b and c).
Discussion
In this paper we describe the first epidemiological analysis of equine welfare data from a national animal welfare control database. We also present a novel approach to assess the risk of poor equine welfare based on outcomes from past animal welfare inspections. The premises-level prevalence of non-compliance for normal random inspections was between 0.3% and 5.1% for the four animal-based CPs, which is comparable with the percentage of similar owner-reported welfare problems in the 2005 NAHMS study in the United States (1.0% to 5.4%) (United States Department of Agriculture (USDA), 2006). However, the measures of equine welfare in this Swedish study (hoof condition, body condition, social contact and cleanliness) do not cover all aspects of poor welfare; thus the overall prevalence of almost 10% of premises with poor equine welfare may be an underestimation. Both our Swedish study and the US (NAHMS study) report premises prevalence, where most other studies estimate prevalence at the horse level (McGreevy et al., Reference McGreevy, Cripps, French, Green and Nicol1995b; Luescher et al., Reference Luescher, McKeown and Dean1998; Bachmann et al., Reference Christie, Hewson, Riley, McNiven, Dohoo and Bate2003; Christie et al., Reference Christie, Hewson, Riley, McNiven, Dohoo and Bate2004 and Reference Dalla Costa, Murray, Dai, Canali and Minero2006; Ireland et al., Reference Ireland, McGowan, Clegg, Chandler and Pinchbeck2012 and Reference Ireland, Wylie, Collins, Verheyen and Newton2013), so results are not directly comparable. The premises in Sweden with sufficiently serious cases of poor equine welfare for them to be judged unacceptable according to Swedish animal welfare legislation give a good guide as to where strategies to improve horse welfare can best be targeted. We briefly discuss this possibility taking hoof condition and social contact as examples.
Poor hoof condition was identified as the most common indicator of poor equine welfare in this study, yet it is a problem that, in most cases, can be prevented. Resource- and management-based factors associated with an increased risk of this included a lack of knowledge of the personnel caring for the horse, inappropriate or dangerous pasture, exercise areas and/or stabling and shelter, inadequate documentation and ‘supervision, care and feeding’ (component 2) from the PCA. Together these imply that a strategy aimed at raising awareness of the importance of hoof care among horse owners, and especially targeted towards premises where several different animal related activities are conducted, may be a useful way forward. Progress following such an educational intervention could be monitored based on regular analyses of the same official animal welfare inspection database that was used for this study. Similarly, targeting the resource- and management-based factors associated with the other three animal-based measures of poor equine welfare would help identify the best strategies for addressing those particular welfare problems. For example, deficiencies in exercise or turn out and inappropriate pasture were the resource- and management-based factors associated with non-compliance related to social contact. In combination with an association found for those premises having fewer horses and conducting fewer animal-related activities, this finding implies that the problem may not be due to a lack of knowledge and supervision (which was common to the welfare problems associated with hoof condition, body condition and cleanliness) but a lack of opportunities for the owner to satisfy this requirement for social contact for their horse. The finding that lack of social contact correlated less strongly with hoof condition, body condition and cleanliness, than these three welfare problems correlated with each other, further supports a different underlying cause for non-compliance related to social contact for horses. The findings from this analysis lead us to suggest strategies aimed at reducing welfare issues overall should focus on education regarding equine care, nutrition, and hygiene targeted at horse industry personnel. The findings also suggest that design factors (including stabling, shelter, pasture, exercise areas, fencing, etc.) required by legislation are better considered before building new facilities, and highlights the importance of not warning personnel at a premises of an impending inspection. Prevalence of non-compliance with these animal-based measures can provide us with a baseline and, over time, allow for benchmarking of trends for assessing the consequences of targeted interventions aimed at improving equine welfare.
This study also provides important information for improving animal welfare surveillance. For example, inspections were conducted at less than 30% of premises reporting to the Swedish Board of Agriculture that they have horses, and at only 11% of premises in Sweden estimated to keep horses in a 2010 survey (Swedish Board of Agriculture, 2011), which is likely insufficient for a well-functioning welfare surveillance system. The prevalence figures were based on a random sample of registered premises. However, it cannot be ruled out that differences between registered and non-registered premises may have caused bias when drawing inference to all Swedish premises. We should therefore be cautious interpreting the estimated figures. With continued updating and growth of the database, the prevalence figures should become increasingly reliable. There was also a high proportion of inspections with missing values, particularly for breeding, documentation and the components from the PCA, and results were more likely to be missing for resource- or management-based CPs (range 18% to 89% missing) compared with the animal-based CPs (12% to 20% missing). For JV to improve the quality of the database for future analyses, completeness of assessments should be encouraged, or the inspection checklist reduced to CPs that are key for the prediction of poor welfare. The models did confirm that the current animal welfare control system is effectively monitoring premises that are known to have a history of non-compliance. Knowledge of the compliance history of premises is valuable and could be used to further enhance the selection of premises for risk-based animal welfare inspections. Targeting strategies at these high-risk premises could significantly reduce welfare problems in Sweden, although there would still need to be random inspections to monitor the prevalence. The scope of this study did not include validation of the database, however two counties (Jämtland and Gotland) conducted internal verification of animal welfare inspections by performing parallel inspections on a random selection and found that there was a need for standardisation of processes, particularly those related to case management (Jämtlands County Administrative Board, 2013; Joel, Reference Joel2015). Further, because only four animal-based measures were included in the assessments, there is a need for inclusion of more animal-based measures as CPs (e.g. injury, disease, stereotypies) in animal welfare inspections to provide a more comprehensive overview of equine welfare (EFSA Panel on Animal Health and Welfare (AHAW), 2012; Dalla Costa et al., 2014; Viksten et al., Reference Viksten, Visser and Blokhuis2016). Finally, it is recommended that in future revisions of the checklists, each CP be revised so that it is worded clearly as an outcome (i.e. animal-based measure) or an input (i.e. resource- or management-based measure).
This study confirms the value of the official animal welfare inspection database and its potential for use in an equine welfare surveillance system, although it also identifies areas for improvement. The official animal welfare inspection database will allow on-going analyses and benchmarking of trends, and will be particularly useful in a risk-based animal welfare surveillance system, especially if combined with other databases containing information on, for example, injury and disease. This database can be used as a source of information about current welfare problems and risks for future problems, and serve as inspiration for future standardised and harmonised data collection, nationally and internationally. The novel approach using epidemiological methodology is applicable to data involving other animal species or from other countries, provided both input and outcome measures are available. We anticipate that this novel approach will inform current animal welfare control systems and be an important basis for implementation of future animal welfare surveillance internationally.
Acknowledgements
The authors thank the Formas, the Swedish Research Council for Environment, Agricultural Sciences and Spatial Planning for financial support, and the Swedish Board of Agriculture and County Administrative Boards for providing official animal welfare control data. The project is part of the Centre of Excellence in Animal Welfare Science, a Swedish collaborative research platform.
Supplementary Material
To view supplementary material for this article, please visit https://doi.org/10.1017/S1751731116002512