1. Introduction
Policy-makers often see municipal mergers as an effective way of realizing economies of scale in municipal service provision. Other perceived benefits from larger local jurisdictions include the internalization of inter-jurisdictional spillovers and an increased fiscal capacity to sustain expenditure or revenue shocks. With these goals in mind, municipal merger reforms have been implemented over time in a vast number of countries. For example, Blom-Hansen et al. (Reference Blom-Hansen, Houlberg, Serritzlew and Treisman2016) report that since the 1950s extensive merger reforms have taken place in 28 developed countries. The academic literature offers a more nuanced view by highlighting the potential costs of merging. These costs include larger mismatch between local services and the preferences of local citizens (Alesina and Spolaore Reference Alesina and Spolaore1997), less beneficial competition among jurisdictions (Tiebout Reference Tiebout1956; Besley and Case Reference Besley and Case1995; Grossman et al. Reference Grossman, Pierskalla and Dean2017) and weaker accountability, voter efficacy and trust, and lower participation (Verba and Nie Reference Verba and Nie1972; Dahl and Tufte Reference Dahl and Tufte1973; Oliver Reference Oliver2000; Treisman Reference Treisman2007; Lassen and Serritzlew Reference Lassen and Serritzlew2011; Koch and Rochat Reference Koch and Rochat2017).
We study the effects of municipal mergers on municipal expenditures and the geography of municipal services by using novel geocoded data on local public sector jobs (250 m × 250 m grids covering the whole country) and local politicians' place of residence (residential address) in Finland. These data enable us to study what happens to municipal service provision at the pre-merger municipality level, even when the official statistics on municipal expenditures are produced only at the post-merger municipality level after merging. We also analyze the within-merger heterogeneity of the effects with respect to the geographic distribution of political power within the merged municipalities.
Our contribution to the literature is threefold. First, we contribute to the small, but rapidly growing literature on the effects of municipal mergers (e.g., Reingewertz Reference Reingewertz2012; Blom-Hansen et al. Reference Blom-Hansen, Houlberg and Serritzlew2014; Allers and Geertsema Reference Allers and Geertsema2016; Blesse and Baskaran Reference Blesse and Baskaran2016; Blom-Hansen et al. Reference Blom-Hansen, Houlberg, Serritzlew and Treisman2016). To our knowledge, our study is the first to use data directly related to municipal service production at a more disaggregated level than the post-merger municipalities.Footnote 1 This allows us to study the within-merger heterogeneity in the effects, a point of view currently missing from this literature. The importance of this aspect is highlighted in the theoretical literature on the optimal size of jurisdictions. As the size of the jurisdiction increases, the regional heterogeneity of the population increases, making it more difficult to tailor services to match the preferences of the citizens (Alesina and Spolaore Reference Alesina and Spolaore1997; Ellingsen Reference Ellingsen1998).
We are also able to study the effects on different types of municipal services as we can classify our job data into administration, schooling, and health and social care service jobs. As service production takes place at the site level, attaining scale economies requires merging the production units along with the municipalities (Miceli Reference Miceli1993; Blom-Hansen et al. Reference Blom-Hansen, Houlberg, Serritzlew and Treisman2016). Our data allow us to study whether and in what services this happens.
Second, we contribute to the literature on political representation and distributive politics. In particular, our data on the exact place of residence of municipal councilors allow us to study how the merger effects depend on the geographic distribution of political power in the post-merger municipal council. Although the relationship between representation in legislatures and geographic distribution of public funds has received substantial attention in prior literature (e.g., Ansolabehere et al. Reference Ansolabehere, Gerber and Snyder2002; Knight Reference Knight2008; Berry et al,. Reference Berry, Burden and Howell2010; Albouy Reference Albouy2013; Hodler and Raschky Reference Hodler and Raschky2014; Fiva and Halse Reference Fiva and Halse2016), the issue has eluded the research on municipal mergers. This is an important and somewhat surprising gap in the literature given that mergers typically lead to more heterogeneous municipal populations and have large impacts on the representation of different geographic voter groups (Saarimaa and Tukiainen Reference Saarimaa and Tukiainen2016). We are able to link these two literatures usually considered in isolation.
Our institutional setup also opens a new window into analyzing whether electoral incentives lead to local favoritism in at-large open-list proportional representation (PR) systems.Footnote 2 In the Finnish PR system, municipalities consist of a single district without geographic quotas, even after a merger. However, since the party lists are open and voting for an individual candidate is mandatory, candidates may have personal electoral incentives to cater to their local voters, even though the voters can vote for any candidate in the post-merger municipality. Studying the same mergers as the current paper, Saarimaa and Tukiainen (Reference Saarimaa and Tukiainen2016) find that Finnish voters mostly keep on voting for the candidates from their home (pre-merger) municipality after a merger.Footnote 3 This means that electoral incentives may be quite similar to those in the US single member districts analyzed in much of the previous literature.
Furthermore, over and above electoral incentives, local politicians have a stake in providing and maintaining the quality of local services as they themselves consume these services (Osborne and Slivinski Reference Osborne and Slivinski1996; Besley and Coate Reference Besley and Coate1997). Previous evidence from Finnish local politics is consistent with this citizen–candidate framework as it shows that even individual councilors can influence local policy (Hyytinen et al. Reference Hyytinen, Meriläinen, Saarimaa, Toivanen and Tukiainen2018).
Our final contribution is methodological as the analysis of municipal merger effects comes with a number of challenges. The Finnish mergers were voluntarily decided by municipality councils, which make causal inference challenging due to possible selection bias. However, the voluntary nature of the mergers is a blessing in disguise because it allows us to construct a sensible control group. Often in the case of forced mergers, the central government imposes a minimum population threshold that all municipalities need to fulfill through merging.Footnote 4 While it is in some sense true that forcing all municipalities below a given threshold to merge rules out selection bias, it does so by effectively washing away the entire relevant control group in difference-in-differences (DID) designs. The treatment group (small municipalities that had to merge) is very different from the control group (large municipalities that did not have to merge) by construction.
To address the selection issue, we combine nearest neighbor matching with DID methods and adjust them for merger analysis as there are at least two partners in each merger. We are interested in causal effects working both at the merger and at the pre-merger municipality level. In the former, we want to compare a group municipalities that merged to a group with the same number of municipalities with similar characteristics that did not merge. In the latter, the comparison of interest is either between merged municipalities with different levels of political representation or between merged municipalities and municipalities that did not merge, but could have been a part of a similar merger.
We construct a control group by first simulating all possible spatially contiguous mergers involving up to ten municipalities (ten being the largest actual merger) that could have taken place according to the pre-merger municipality borders (after omitting actual mergers). We then build the control group from this universe of hypothetical mergers using non-parametric nearest neighbor matching based on merger-level characteristics measured before merging. In the pre-merger municipality-level analysis, we decompose the hypothetical mergers in the control group back to the municipality level. This has the advantage of allowing us to conduct placebo tests with respect to heterogeneity in the effects within the hypothetical mergers.
Our findings can be summarized as follows. During an eight-year follow-up period after merging, total municipal expenditures evolve in the same way on average in the merged municipalities as in the control group of hypothetical mergers that did not take place. These zero findings are consistent with prior evidence concerning voluntary mergers decided at the local level (Moisio and Uusitalo Reference Moisio and Uusitalo2013; Allers and Geertsema Reference Allers and Geertsema2016; Blesse and Baskaran Reference Blesse and Baskaran2016). However, these merger-level findings hide substantial heterogeneity within the mergers. First, the mergers led to highly unequal geographic political representation in the post-merger municipal councils among the merged municipalities. Second, while nothing happened to the number of jobs in schooling, the number of local public jobs in administration and in the health and social care services decreased substantially in the politically marginalized (pre-merger level) municipalities relative to those municipalities that were more strongly represented in the post-merger councils. In fact, the jobs in the latter two sectors increased somewhat in the politically stronger municipalities.
As we do not have quasi-experimental variation in political representation, we need to be careful with the interpretation of the results. The alternative explanation is that due to economies of scale, it makes sense to concentrate some services to larger municipalities and downsize facilities in smaller ones. We subject political representation and economies of scale measures to a horse race. This analysis suggests that administrative jobs are centralized to the largest municipality in the merger regardless of representation, while representation is connected to the relocation of health and social care services. We also detect divergence in house prices between the politically marginalized municipalities and the municipalities with stronger representation suggesting that the quality of the service-tax bundle deteriorated in the smaller merger partners. Overall, the results survive a large number of validity checks detailed later on.
2. Institutional background
2.1 Finnish municipalities
2.1.1 Municipal tasks
Finland has a two-tier system of government consisting of the central government and municipalities.Footnote 5 In international comparison, Finnish municipalities have extensive tasks and fiscal autonomy. In addition to local public goods and services, municipalities are responsible for providing most of social and health care services along with primary and secondary schooling. The GDP share of municipality spending is roughly 18 percent and they employ around 20 percent of the total workforce.
2.1.2. Revenue sources
The most important revenue sources are local taxes and operating revenues, such as fees. The local income tax rate is flat and the municipalities can set the rate freely. In addition, municipalities get revenue from the local property tax and they receive a share of the state-level corporate tax revenue. In 2012, the average share of the income tax of total revenue was 46 percent, while the shares of the property and corporate taxes were only 3 percent, respectively. Regional tax base and cost disparities are offset by a central government block grant system. The grants cover about 20 percent of total municipal revenues, but this share varies considerably across municipalities.
2.1.3. Municipal politics
Finland has a PR system with eight parties that dominate national and municipal politics. Municipal councils are the main seat of power in the municipal decision-making and the council term lasts for four years. During our analysis period, the council size was a step function of population and varied between 13 and 85. The merged municipalities were allowed to have a larger council size than the law dictated for the first post-merger election term. The elections in October 2008 already used the new post-merger municipal division, although the mergers came to effect at the start of 2009.
Each municipality has only one electoral district (i.e., constituency) and no geographic quotas are in place, even after a merger. The municipal elections use an open-list method where voting for a single individual candidate is mandatory. Party vote is calculated as the sum over its candidates' votes. Council seats are allocated to parties based on the party vote shares in accordance with competitive indices set by the d'Hondt method. Personal votes determine the position of the candidates within the party list. The candidates from smaller merger partners have to compete with candidates from the larger partners within the new party lists, which may lead to political marginalization of the small merging municipalities.
Parties do not typically form stable ruling coalitions in municipal councils. Instead, majority coalitions are often formed on issue basis. Moreover, party discipline is less strict at the local level than in the national parliament (see e.g., Hyytinen et al. Reference Hyytinen, Saarimaa and Tukiainen2014). In this environment, regional political representation can play a role in municipal decision-making either directly through coalition formation across party lines or by influencing within-party positions (Laver and Shepsle Reference Laver and Shepsle1990). In both situations, having more councilors from their home (pre-merger) municipality should be beneficial to voters.
2.2 The merger reform
In 2005, the central government initiated a plan aiming to make the production of municipal services more efficient and increasing the fiscal and service provision capacity of the municipalities. The reasons behind the reform included aging-related expected increase in municipal expenditures and disparities in municipal revenues due to urbanization. Voluntary mergers were the main tool for reaching these goals.
The central government encouraged mergers using three policy instruments. First, central government grants were not decreased during the first five years after merging. Second, municipalities were not allowed to lay-off their permanent employees during the first five post-merger years. Third, the central government granted merger subsidies to merged municipalities. The mergers in 2008 and 2009 received larger subsidies than the subsequent ones, possibly explaining why most mergers took place in 2009. On average, the merger subsidy was about 330 Euros per capita. The subsidy was paid in three annual installments after the merger.
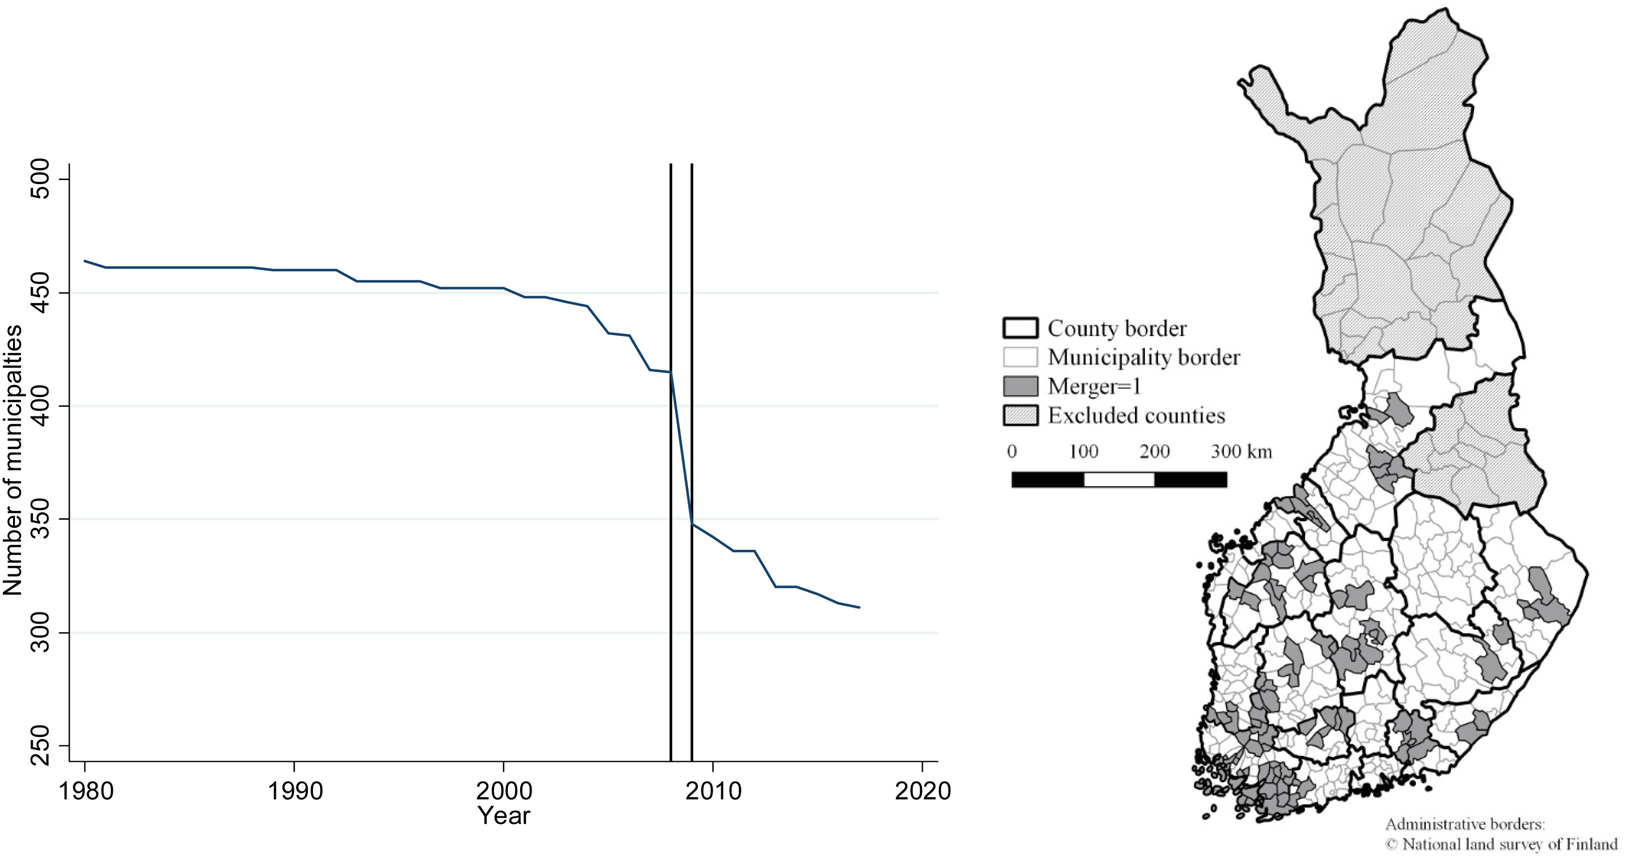
Municipal councils vote for a specific merger proposal. If the proposed merger gains a majority in all the participating councils, the merger goes through. If not, it is cancelled and all the municipalities continue as they were or a subset of the municipalities in the original plan merges. In 2006, there were 431 municipalities in total. Following the central government plan, 14 mergers took place in 2007, one in 2008 and 32 in 2009 reducing the number of municipalities to 348 (see Figure 1). The number of municipalities involved in a given merger ranged from two to ten municipalities.
Number of municipalities in Finland in 1980–2017 and the 2009 mergers.

We concentrate on the mergers that took place in 2009, which are highlighted in the map in Figure 1. We exclude three of the 32 mergers that took place in 2009 from our analysis because they were part of another merger just before or after 2009. We focus on the 2009 mergers, because for the earlier mergers, the 2008 elections may have been affected by the mergers, and because for the later ones the post-treatment period is too short, given the restrictions on lay-offs.
Saarimaa and Tukiainen (Reference Saarimaa and Tukiainen2014) describe the determinants of these mergers and find that fiscal pressure, existing cooperation in service production, citizens' residential location and local democracy considerations are associated with the merger decisions. Hyytinen et al. (Reference Hyytinen, Saarimaa and Tukiainen2014) find that also councilors' re-election concerns play an important role. Due to the identification strategy in Hyytinen et al. (Reference Hyytinen, Saarimaa and Tukiainen2014), the political drivers of mergers they document are orthogonal to economic development. Therefore, at least some part of the decisions to merge can be seen as exogenous for our purposes. Nonetheless, the voluntary nature of the mergers and the predictability of the merger decisions raise the issue of non-random selection.
3. Research design
3.1 Creating the control group
The Finnish mergers were voluntarily decided by municipality councils, and thus, the municipalities that merged may be different from the municipalities that did not merge in ways that are unobservable to us. To address this issue, we combine the nearest neighbor matching with DID methods. While these are well-established methods for causal inference, they need to be adjusted for merger analysis, the key issue being the construction of a valid control group.
We construct the control group by first simulating all possible mergers involving up to ten municipalities that could have taken place according to the pre-merger municipality borders.Footnote 6 We constrain these hypothetical mergers in the following ways: First, we only allow mergers to take place between adjacent municipalities, i.e. the hypothetical new municipality has to be geographically contiguous. Second, we allow mergers to take place only within county borders because none of the actual mergers crossed these borders (see Figure 1).Footnote 7 Finally, to rule out contamination of the control group, we omit all those mergers that included at least one municipality that actually underwent a merger in the period 2005–2015.
After these restrictions, we are left with 7965 hypothetical mergers (see Table A1 in supporting information).Footnote 8 We then use a nearest neighbor-matching algorithm based on merger-level characteristics from the pre-merger period to find controls for the actual mergers. We use exact matching with respect to the number of municipalities in the merger.Footnote 9 For example, for a merger including, say, four municipalities we pick five control mergers among those hypothetical mergers that also include four municipalities.Footnote 10 This ensures that the control cases have as many administration facilities (four town halls) and personnel (four mayors) as the treated unit had prior to merging.
Within these merger size groups, matching is based on the following covariates: total population of the merger, median distance of the citizens to the business center of the largest municipality in the merger, indicator for whether all the partners belong to the same health care cooperation unit, and within-merger heterogeneity in per capita taxable income, expenditures and deficit. These variables should reflect the potential for economies of scale, and the differences between citizen's preferences and the financial situation of the municipalities in a merger. Moreover, Saarimaa and Tukiainen (Reference Saarimaa and Tukiainen2014) found that most of these variables had predictive power in explaining the merger decisions. The matching variables are measured in 2006.Footnote 11
We use this control group also in the pre-merger municipality-level analysis, in which we simply decompose the hypothetical mergers back to the municipality level. This has the advantage of allowing us to conduct placebo tests with respect to heterogeneity in the effects within the hypothetical mergers. Furthermore, matching on pre-determined variables is the only way to control for systematic differences in observables, because we cannot measure these variables at the pre-merger municipality level after merging, and thus, cannot directly use control variables. Matching on pre-determined variables also minimizes the risk of including bad controls (or alternative outcomes) into the regressions.
3.2 Data
3.2.1 Merger level
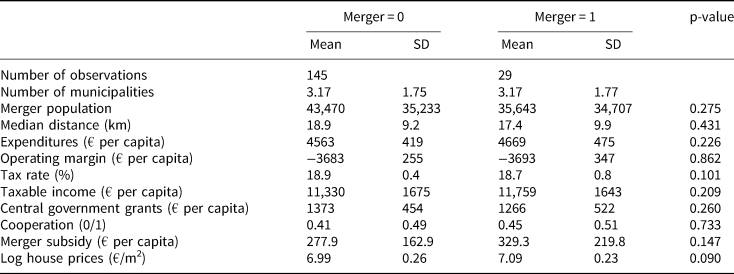
Table 1 presents descriptive pre-merger statistics on the mergers and the control group based on nearest neighbor matching. The potential mergers in the control group are slightly larger in terms of total population than the actual mergers. Otherwise, the matching algorithm produces a comparable control group in terms of pre-merger characteristics. The magnitude of the mean differences is small and only the difference in house prices is statistically significant at the 10 percent level.
Descriptive statistics for merger-level data in 2006

Note: The data come from Statistics Finland. The last column reports the p-value from a t-test on the equality of means. For house prices, the number of observations is 139 and 24, respectively. The merger subsidies for the control group calculated using the subsidy scheme and illustrate the amount of subsidy these hypothetical mergers would have received had they merged in 2009.
3.2.2 Pre-merger municipality level
We are also interested in within-merger heterogeneity of the effects and whether the effects depend on the political representation in the post-merger councils. This analysis is possible due to high-quality GIS data that allow us to aggregate spatial micro data to match the pre-merger municipality borders. These data come from three sources.
First, we have obtained the exact address of all the municipal councilors from the Population Register Center. These data allow us to calculate the seat shares at the pre-merger municipality level in the post-merger municipal councils, which we use as a treatment variable.
Second, we use the Community Structure Database produced by the Finnish Environment Institute and Statistics Finland. This geocoded database covers the whole of Finland in 250 m × 250 m grids, which include information on the number of jobs in different sectors located in the grids. The data are available for the years 2000, 2003, 2005, 2007, 2009, 2010, 2012, 2014 and 2015. They allow us to analyze the development of these jobs through time regardless of the redrawing of municipal borders. Unfortunately, we cannot categorize the jobs into municipal and other jobs. We use the following four job categories: public administration and defense, health and social care, schooling, and employees from all other sectors. The first three categories are our main job outcomes while the latter can be used in placebo tests because mergers should not have a sizable direct effect on these jobs, although an indirect effect is possible. Schooling and health and social care are the most important expenditure and employment categories as they make up some 70 percent of all municipal expenditures.
The problem with these categories is that some of these jobs may, in fact, be in the private sector (especially in health care) or in central government (obviously defense, but also some schooling because of universities). These jobs should not, however, confound our analysis as long as there are no changes in these jobs that coincide with the timing of the mergers. In practice, this means that jobs in the military, private sector health care firms and in universities need to develop smoothly through the merger reform. If this is the case, the DID strategy produces a causal effect on municipal jobs, i.e. any changes in the number of these jobs can quite safely be interpreted as changes in municipal jobs.Footnote 12
Finally, as a proxy for the quality of the service-tax bundle, we use house transaction data at the zip-code level obtained from Statistics Finland. As zip-codes remain unchanged throughout the merger process, we can follow average house prices per square meter at the pre-merger municipality level.
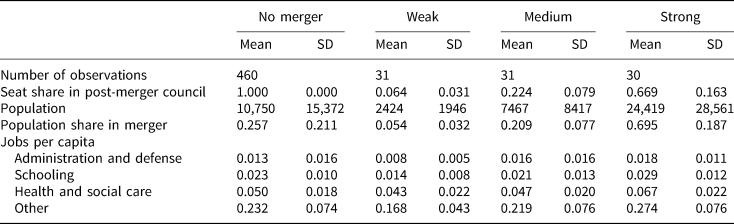
Table 2 presents descriptive statistics for these variables using the matched data at the pre-merger municipality level. The municipalities are divided into four groups for illustrative purposes. First is the control of group municipalities that did not merge. Second, since our interest lies on the effects of political representation, we have divided the merged municipalities into three equal-sized groups based on the council seat share they obtained in the first post-merger elections in 2008.Footnote 13 These groups are used in the graphical DID analyses; whereas the continuous seat share variable is used in the corresponding regressions.
Descriptive statistics for pre-merger municipality level data in 2007

Notes: The Weak, Medium and Strong representation groups are constructed based on the pre-merger municipality-level seat shares in the first post-merger municipal elections.
According to Table 2, the political representation is highly unequal between the merged municipalities. The Weak group includes the municipalities with only a weak representation in the new council with an average seat share of only 6.4 percent. In the Medium group, the average seat share is 20.8, while in the Strong group this share is 62.9 percent on average. In fact, 75 percent of the municipalities in the Strong group had a majority of the council seats. We cannot divide the control group into these subgroups, because they obviously have not had joint post-merger elections. However, we use municipal population shares as proxies for the seat shares when conducting placebo analysis using this group. It is evident from Table 2 that these two measures are highly correlated in the merger group.
3.3 Difference-in-differences estimation
In addition to using a matching algorithm in constructing the control group, our identification strategy is based on the DID method. We will rely heavily on graphical evidence, but we will also report regression results to assess the statistical significance of the results.
When using the merger-level data, we estimate the following type of DID models:
 $$y_{i{\rm t}} = \alpha + \theta _{\rm t} + \beta \cdot {\rm merge}{\rm r}_i + \sum\limits_{\,j = 2009}^{2014} {\delta _j} {\rm merge}{\rm r}_i\cdot {\rm yea}{\rm r}_j + u_{i{\rm t}}{\rm,} $$
where y is one of our outcomes of interest in merger i at time t. θ t are year dummies. We are interested in the coefficients of the post-merger interaction terms merger·year.
The model using pre-merger municipal-level data and the seat shares takes the form:
 $$\eqalign{& y_{i{\rm t}} = \alpha + \theta _{\rm t} + \beta \cdot {\rm merge}{\rm r}_i + \gamma \cdot {\rm seatshar}{\rm e}_i + \sum\limits_{\,j = 2009}^{2014} {\delta _j} {\rm merge}{\rm r}_i\cdot {\rm yea}{\rm r}_j \cr & \qquad + \sum\limits_{\,j = 2009}^{2014} {\mu _j} {\rm merge}{\rm r}_i\cdot {\rm seatshar}{\rm e}_i\cdot {\rm yea}{\rm r}_j + u_{i{\rm t}},} $$
where the coefficient μ now captures any heterogeneous effects with respect to political representation. The council seat share measure is defined only for the municipalities that actually merged and is set to zero for non-merged municipalities. Thus, we do not include the term seatsharei · mergeri or the terms  $\sum\nolimits_{j = 2009}^{2014} {{\rm seatshar}{\rm e}_i\cdot {\rm yea}{\rm r}_j} $ into our estimation equation.
The key concern is that selection issues may relate both to the decision to merge and to the extent of political representation within mergers. However, selection based on pre-treatment differences in municipality characteristics does not bias the DID estimates as long as the common trends assumption holds. This assumption means that the outcomes would follow the same time trend in the control and treatment groups in the absence of treatment. We can indirectly test this assumption by analyzing pre-treatment trends using several comparisons: between mergers and non-mergers at the merger level, within mergers with respect to political representation at the pre-merger municipality level and between merged and non-merged municipalities of similar size at the pre-merger municipality level.
In the municipality-level analysis, we use two-way clustered (municipality and merger) standard errors to account for within-merger and municipality-level dependencies across time and within the control group (Bertrand et al. Reference Bertrand, Duflo and Mullainathan2004; Cameron et al. Reference Cameron, Gelbach and Miller2011). The within control group dependency arises naturally in our setting, because the nearest neighbor matching was done with replacement. In the merger-level analysis, we cluster at the merger level.
4. Empirical results
4.1 Merger level
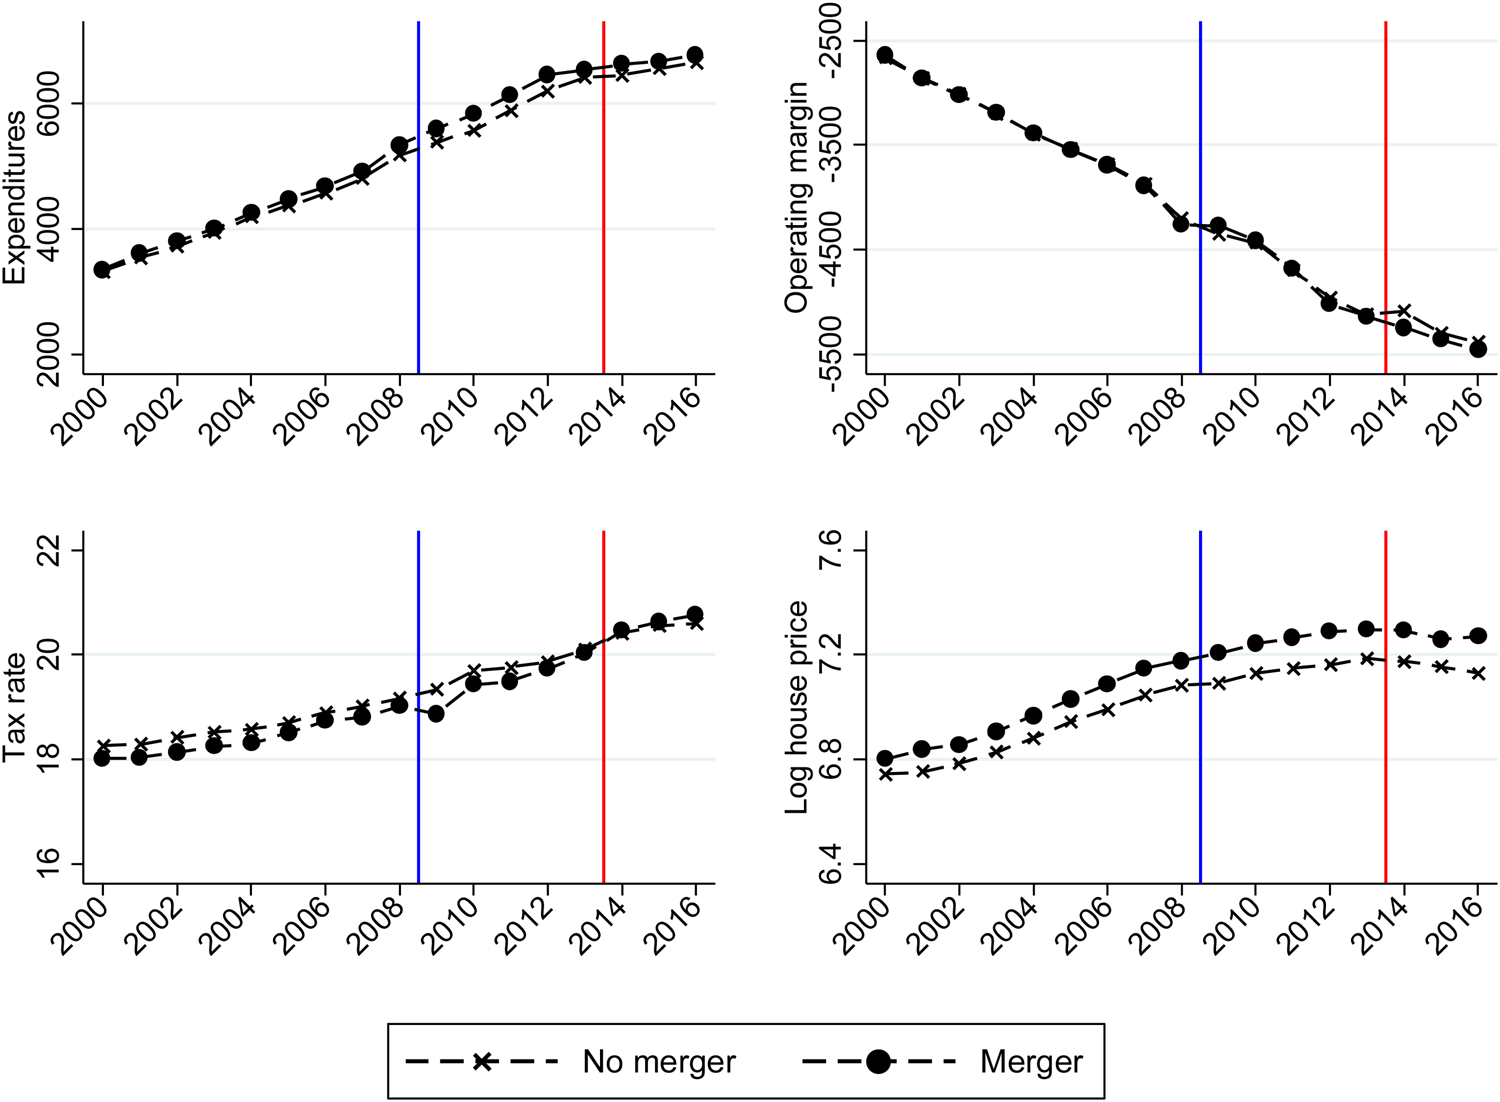
Figure 2 presents the development of the means of per capita expenditures, operating margins,Footnote 14 tax rates and log house prices per square meter from 2000 to 2016. The comparison is between the actual mergers and the control group of hypothetical mergers based on nearest neighbor matching. The blue vertical lines highlight the post-merger period and the red vertical lines highlight when the five-year layoff protection for municipal employees ended after the mergers, as we also want to understand whether removing this constraint affected the municipalities' opportunities to cut expenditures. The corresponding regression results are reported in Table A2 in the supporting information.
Graphical DID results with merger-level data.
Note: The non-merged control group is constructed using nearest neighbor-matching algorithm. The blue vertical lines highlight the post-merger period and the red vertical lines the end of the five-year layoff protection period for municipal employees.

Based on visual inspection, the two groups follow a common pre-treatment trend in all outcomes.Footnote 15 Formal tests presented in Table A3 in the supporting information support this claim, especially after 2003. Moreover, the levels are almost identical due to our matching procedure.
Did the mergers reduce municipal per capita expenditures? According to Figure 2, the answer seems to be no. If anything, expenditures increase slightly faster initially in the merger group than in the control group, but in the longer term they converge.Footnote 16 The regression results in Table A2 show that the effects are not statistically significant and small in magnitude.
Interestingly, there is a small, but again a temporary increase in operating margins and a drop in tax rates in the merger group. However, in the longer run, tax rates increase slightly in the mergers. Moreover, the temporary increase in expenditures that coincides with the small changes in tax rates and in operating margins can be explained by the merger subsidies. The merger subsidies were on average 330 Euros per capita and they were paid in three annual installments during the first three post-merger years (2009, 2010 and 2011). Thus, the annual installments were quite small and short-term. Also tax rate harmonization within the mergers may play a role. However, we do not wish to draw too strong conclusions regarding these effects as they are quite small. For example, the tax rates decreased in the merger group by 0.23 percentage points due to merging in the short run (2009), but increased by 0.39 percentage points in the long run (2016). These can be contrasted to the tax rate level in the merger group before the mergers in 2006 of 18.7 percent (see Table 1).
Based on the fiscal outcomes, it seems that the main goal of the policy-maker was not achieved.Footnote 17 However, the fact that we do not find effects on expenditures does not necessarily mean that mergers had no effect on citizens' welfare. For example, the merged municipalities may be able to produce higher quality services with the same expenditures than the municipalities that did not merge.
Unfortunately, we do not have good data on service quality, and instead, we need to use indirect measures of the quality of the service-tax bundle. An often-used measure for this purpose is house prices. The idea is based on a revealed preference argument so that changes in the quality of the service-tax bundle should be reflected in the demand for housing in the municipality and in house prices in the short run. Based on Figure 2, house prices diverge slightly between the two groups, but the results in Table A2 indicate that the difference is not statistically significant.
4.2 Pre-merger municipality level
The merger-level analysis abstracts away from a number of interesting questions with respect to within-merger heterogeneity. For example, the services may be relocated to the largest municipality in the merger, but the overall service level, and thus, the expenditure level may remain the same. This may hurt the citizens in the smaller partner, but we would not be able to detect this from the merger-level data.
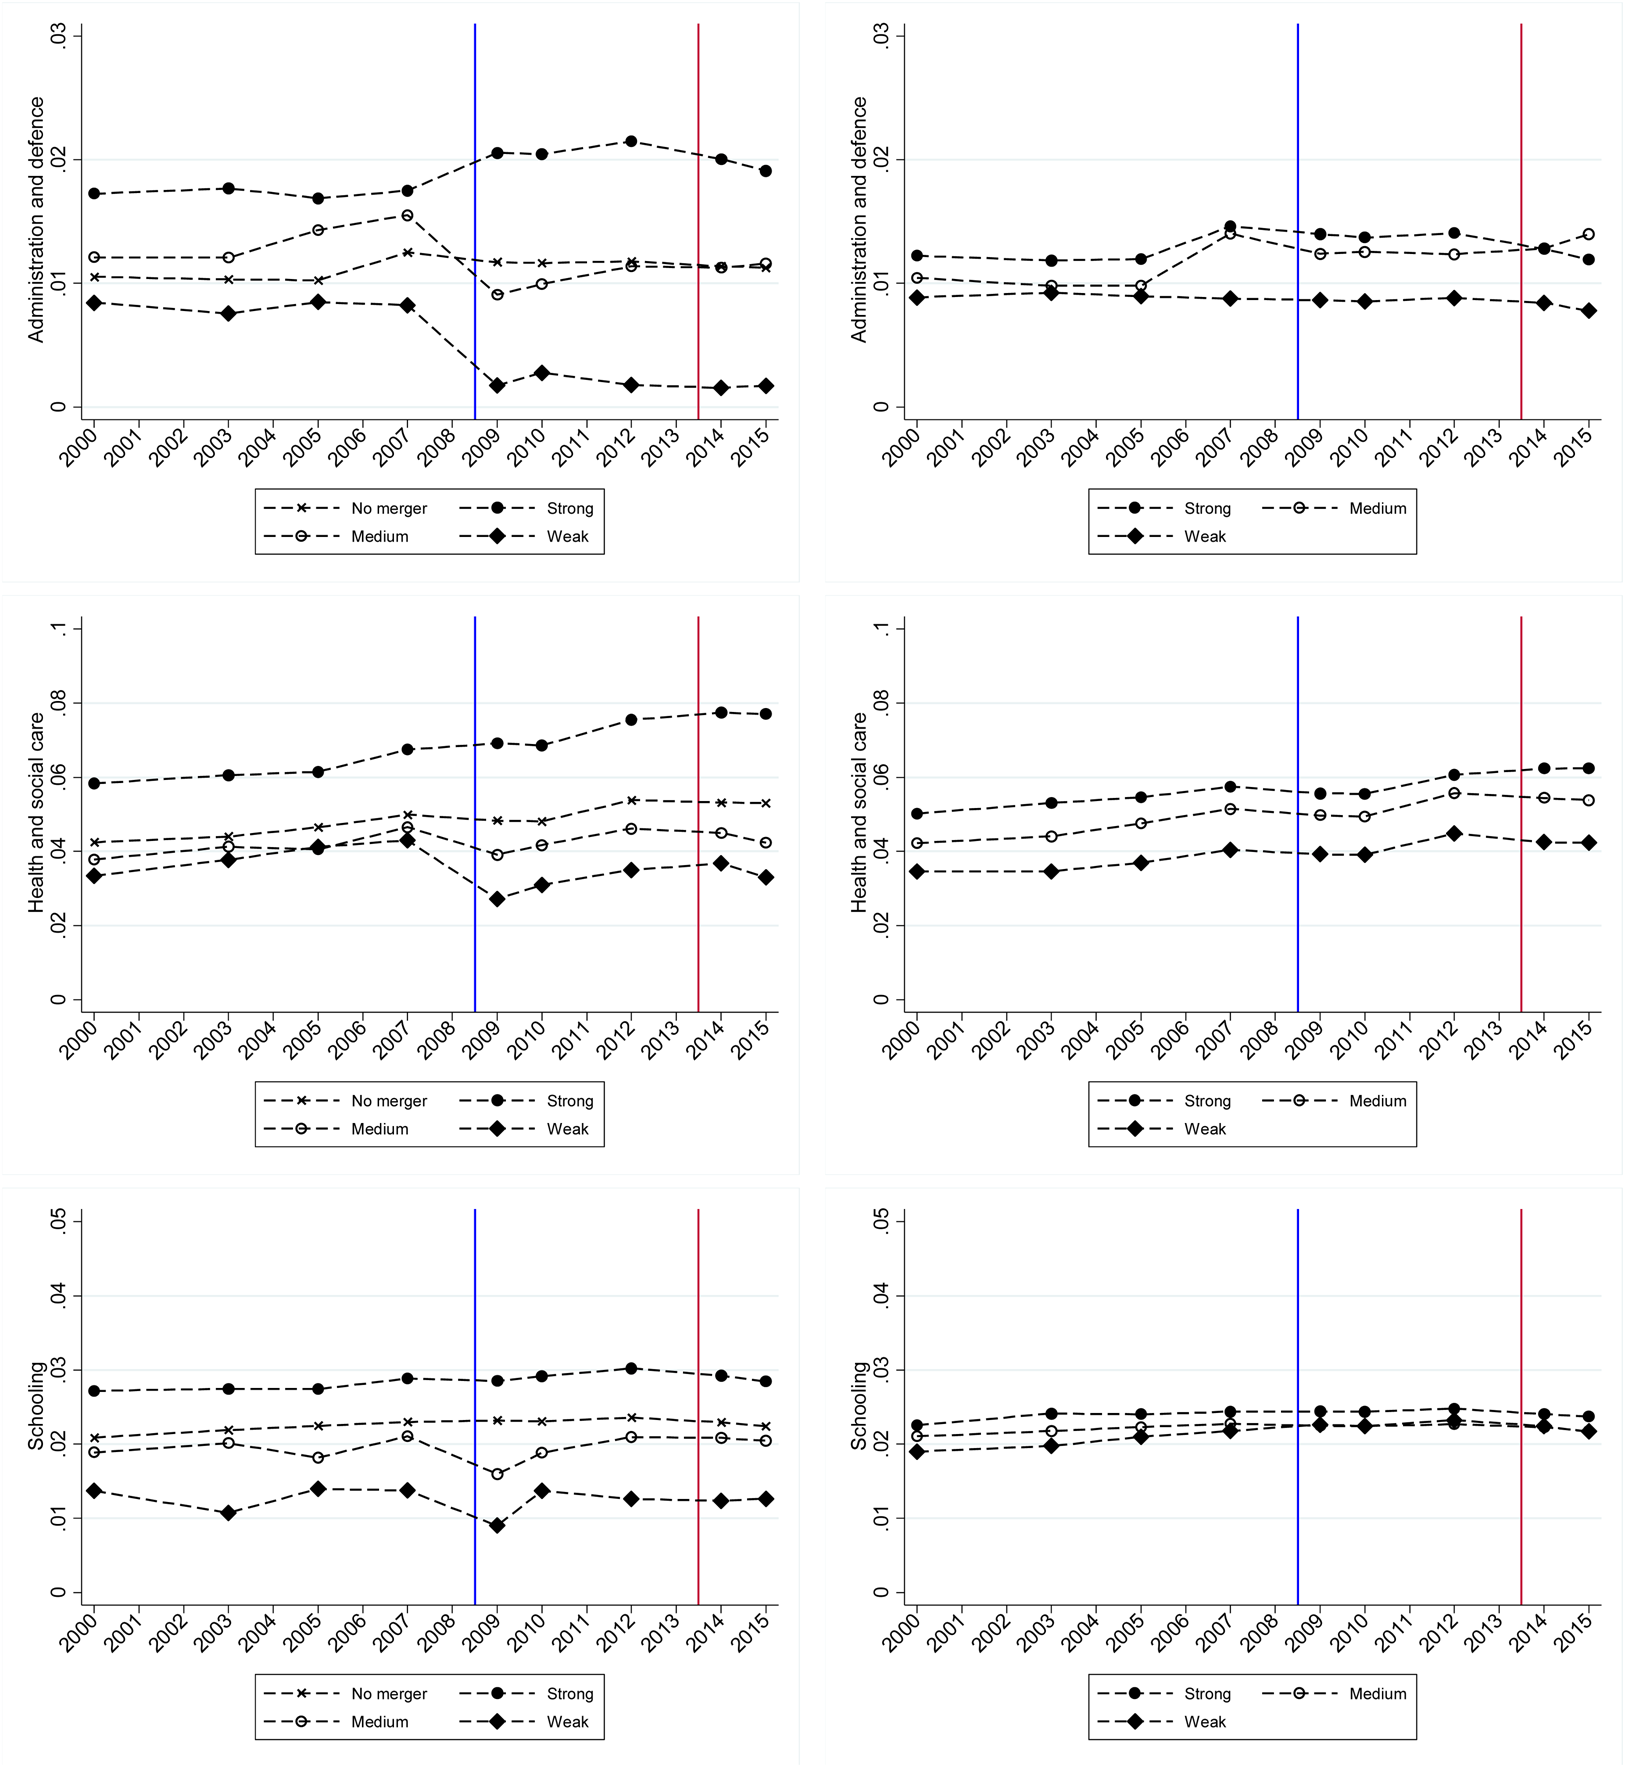
In this section, we use pre-merger-level municipalities in the analysis and ask whether the effects of mergers vary across municipalities and whether they depend on political representation. In order to assess the results visually, we divide the merged municipalities into subgroups based on the (pre-merger) municipality-level representation in the post-merger council as described in Table 2. The results are portrayed in Figure 3, while Table A4 in the supporting information presents the corresponding regression results where the post-merger seat shares are used as a continuous treatment variable in a DID model presented in Equation (2). Because of large differences in the number of total jobs, all the jobs are measured in per capita terms.Footnote 18
Graphical DID results with pre-merger municipality-level data.
Notes: The left-hand side figures illustrate the true treatment effects based on municipal seat shares in the post-merger councils. The right-hand side figures illustrate the placebo treatments for the non-merged control group based on municipal population shares. The non-merged control group is constructed using nearest neighbor-matching algorithm. The blue vertical lines highlight the post-merger period and the red vertical lines the end of the five-year layoff protection period for municipal employees.

Figure 3 also includes placebo tests with respect to treatment intensity using the municipalities in the control group. Since we do not have merger-level elections for these municipalities, we divide the control group into subgroups based on their population share in their hypothetical merger. We divide the control group into three equal-sized groups based on the population share and label these subgroups the same way as the merger subgroups (Weak, Medium and Strong) so that, e.g., the Strong group includes the municipalities with the largest population share in their hypothetical merger. This division also gives us an additional counterfactual for the merged municipalities. Instead of comparing the merged municipalities with different levels of representation to the control group as a whole, we can compare the development of the outcomes in, say, the Weak group that merged and the Weak group that did not.
According to Figure 3, administrative jobs (top-left) clearly decrease in the municipalities with Weak and Medium representation in the council, whereas they initially slightly increase in the municipalities with Strong representation. This suggests that at least some of the municipal administration is concentrated to the largest municipality in the merger. For administration, pre-treatment common trends are not particularly clean visually, but the formal pre-treatment tests do not indicate a problem (see Table A5 in supporting information) and the largest changes clearly coincide with the mergers and these changes seem to be permanent. Furthermore, there are no changes in administrative jobs in the control group or in its subgroups that would coincide with the merger reform (top-right in Figure 3).
A similar pattern is evident in the health and social care sector jobs (middle-left in Figure 3). These jobs clearly decrease in the Medium group and even more so in the Weak representation group, while there is no visible change in the Strong group. The initial reduction is substantial and the divergence between the groups permanent. The common trends assumption seems quite plausible for this outcome based on the pre-treatment trends and formal tests (see Table A5 in supporting information). Moreover, these jobs develop smoothly throughout the analysis period in each of the population share subgroups in the control group (middle-right in Figure 3) and the merged and non-merged municipalities have similar pre-treatment common trends in each group.
There seem to be no permanent effects in the schooling sector (bottom-left in Figure 3). After a small initial decline, the number of jobs quickly returns to the pre-merger levels and the groups do not diverge permanently. Formal pre-treatment tests do not indicate any problems (see Table A5 in supporting information) and these jobs develop smoothly and with a similar pre-treatment trend also in the control group (bottom-right in Figure 3).
The regression results presented in Table A4 in the supporting information are in line with the graphical findings. The effects on administration and health and social care are substantial, persistent and also statistically highly significant. For example, in the first post-merger year 2009 the health and social care jobs decrease by almost a third on average for the municipalities in the Weak representation group (seat share equal to 6.4 percent on average) compared with 2007. The interpretation of the regression coefficients for Seat share is somewhat tricky because the treatment effect may be a combination of overall reductions in the number of jobs and a reshuffling of jobs within the mergers from politically marginalized municipalities to the larger ones. Thus Figure 3 and Table A4 give a correct picture of the availability of services at the municipality level, but do not say anything about the total number of jobs.
In order to check which the correct interpretation is, we calculated the number of total jobs in the merged municipalities before and after the mergers. The total number of health and social care jobs in the merged municipalities was 74,479 in 2007 and 74,329 in 2009. This suggests that the results are mostly due to a reshuffling of these jobs from politically marginalized municipalities to the larger ones within the mergers. This is also in line with the zero effects on total expenditures. A plausible explanation is that some small local health care centers are closed and the employees are moved to health care centers in the municipality with more representation.
4.3 Discussion and validity checks
4.3.1 Effects on welfare
One interpretation of the results so far is that the services that people use more or less every day (such as elementary schools) were not much affected by the mergers. These may also be services where economies of scale are not that important. At the same time, health care services are typically not used on a daily basis and it could be that there is a distance–quality trade-off related to these services. When a small municipality produces primary health care services, the facilities are close to the users, but service quality and variety may be low in small production units. Perhaps, the merger made it possible for people in the smaller municipalities to gain access to better quality and a larger variety of health services further away, without excessive tax increases. To shed light on these issues, we again turn to house prices as a proxy measure of the quality of the tax-service bundle.
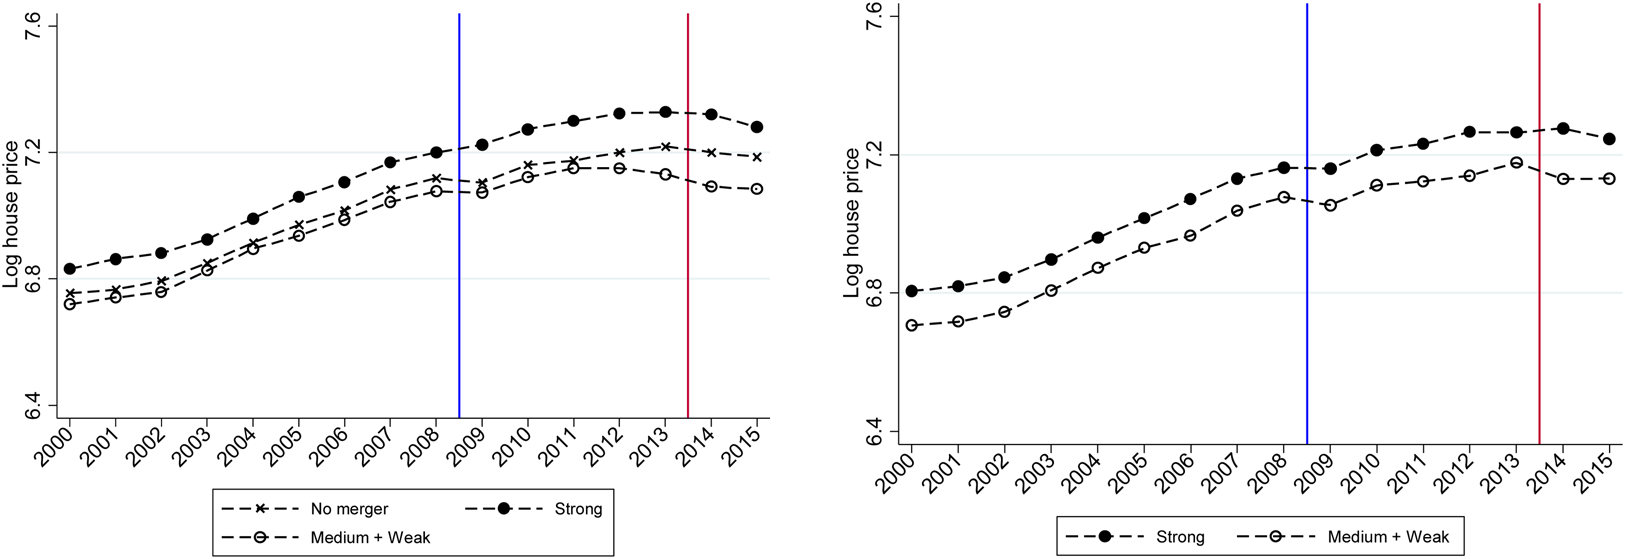
The problem in using house price data at the pre-merger municipality level is that the number of housing transactions per year is small in the smallest municipalities. Having only a few housing transactions in a given year would not give us a reliable measure of the quality of life in the municipality. In order to get reliable results, we have constrained the sample so that a municipality is included in the analysis only if there are least ten transactions per year during the whole 2000–2015 period in the municipality. For the visual inspection of the house price development, we combine the Medium and Weak representation groups. The combined Medium and Weak group contains 20 municipalities in total (16 Medium and four Weak). This has the clear disadvantage that we effectively drop many of the municipalities that had the largest reductions in health and social care jobs making it more difficult to detect any effects.
Figure 4 presents the development of house prices (log price per square meter) in the representation subgroups and the population share subgroups of the control group. Table A6 in the supporting information reports the corresponding regression results. From the left panel of Figure 4, it is evident that house prices follow a rather clean pre-treatment common trend, confirmed by formal pre-treatment tests (see Table A7 in supporting information). After merging, house prices diverge between the Strong and the combined group of Medium and Weak representation municipalities. The combined Medium and Weak group diverges also from the control group from 2012 onwards. The differences are statistically significant from 2013 onwards as can be seen from Table A6. At face value, this result means that the mergers were, at least to some extent, harmful to the residents in the politically marginalized municipalities.Footnote 19
House prices at pre-merger municipality level.
Note: The left-hand side figure illustrates the true treatment effects based on municipal seat shares in the post-merger councils. The right-hand side figure illustrates the placebo treatments for the non-merged control group based on municipal population shares. The non-merged control group is based on nearest neighbor-matching algorithm. Due to small number of observations in the Weak representation group, Medium and Weak groups are combined in the figure. The blue vertical lines highlight the post-merger period and the red vertical lines the end of the five-year layoff protection period for municipal employees.

The right panel of Figure 4 shows that also the population share subgroups exhibit common pre-treatment trends (see Table A7) and develop quite similarly after the merger reform. The groups diverge slightly in the last two years, but the DID estimates are not statistically significant (see Table A6). This finding together with the small number of transactions from the Weak representation group implies that we should treat these results and their interpretation with respect to welfare with some caution.
4.3.2 Validity checks
We have conducted two sets of additional validity checks. The results for these additional checks are presented and discussed in Appendix B in the supporting information. First, we show in Figure B1 in the supporting information that nothing happened to private sector jobs in any of the representation subgroups or in the control group and its subgroups. This adds credibility to our results as it suggests that the different-sized merged municipalities are in the same business cycle with respect to labor market outcomes.
The second set of validity checks addresses the interpretation of the results with respect to political representation, the alternative interpretation being that service relocation happens because of economies of scale or that services are centralized to the largest municipality in the merger. The results suggest that administrative jobs are centralized to the largest municipality in the merger regardless of representation, while representation is connected to the relocation of health and social care services. We acknowledge that even with these additional results, we cannot claim to have a bulletproof identification of the political representation effects.
5. Conclusions
We have analyzed the effects of municipal mergers using novel geocoded data on municipal services and local politicians place of residence. We find that the mergers had practically no effects on total expenditures. This result is in line with previous research that shows that voluntary mergers are unlikely to result in cost savings. However, these aggregate effects hide interesting patterns within the mergers indicating that the benefits and costs of merging are distributed unevenly within the mergers. The municipalities who were politically marginalized in the post-merger council experienced a substantial reduction in local public jobs in health and social care sectors relative to the municipalities with stronger representation. Furthermore, analysis of house price development provides suggestive evidence that merging and the resulting political marginalization was harmful to the residents of these small municipalities.
It seems plausible that our results generalize at least to countries with a similar political system and public services at the local level. Furthermore, considering the extent of the literature from many different countries and political systems concerning the relationship between representation in legislatures and the geographic distribution of public funds, we believe that the effects documented in this paper are not specific to Finland. At the same time, the details of the political system may affect how unequal the geographic representation becomes after a merger reform, and thus, the subsequent effects on service availability within the merged municipalities. The key features of election systems, such as ballot type, election formula, and district number and magnitude, are likely to affect regional representation in subtle ways as they shape the incentives and actions of all political actors (Duverger Reference Duverger1954 and Taagepera and Shugart Reference Taagepera and Shugart1989).
Our results speak to the literatures that have examined the effects of redrawing jurisdictional boundaries and the effects of political representation, and also inform the policy debate on the effects of merging local jurisdictions. Compared with prior literature on the effects of municipal mergers, our results paint a more nuanced picture of what happens to municipal services and how these effects are tied to the political representation at the local level. The increased regional inequality that we document cannot be detected by simply comparing merged and non-merged municipalities meaning that the prior literature misses an important aspect of merger reforms. As better spatial data become more broadly available, analyzing the within-merger effects in other countries with the methodological refinements introduced in this paper seems like a fruitful avenue for further research.
In addition to pointing out new directions in how to evaluate merger reforms, our results suggest that political representation should feature more prominently in the planning stages of merger reforms. These reforms are often unpopular among the electorate and our results together with those by, e.g., Lassen and Serritzlew (Reference Lassen and Serritzlew2011) indicate that concerns for deteriorating local democracy and representation are important. Our study shows that if major merger reforms are planned without carefully considering local political representation, there may be unanticipated and undesired outcomes on regional equality.
Supplementary material
The supplementary material for this article can be found at https://doi.org/10.1017/psrm.2019.17