




1. Introduction
Impacts of drops on liquid layers are ubiquitous. With sufficient energy, such impacts can lead to a splash, producing myriads of secondary small and fast droplets of great importance to understand environmental processes such as raindrops impacting oil spills on the surface of the ocean (Teal & Howarth Reference Teal and Howarth1984; Aguilera et al. Reference Aguilera, Mendez, Pasaro and Laffon2010; Fingas Reference Fingas2013), as well as in healthcare, agriculture and wastewater treatment plants. In these systems, pathogens, pesticides or a range of contaminants contained in these impacted pools can be released and contribute to air contamination via the splash ejection of carrier droplets and aerosols (Horrocks Reference Horrocks1907; Darlow & Bale Reference Darlow and Bale1959; Gerba, Wallis & Melnick Reference Gerba, Wallis and Melnick1975; Rein Reference Rein1993; Barker & Jones Reference Barker and Jones2005; Yarin Reference Yarin2006; Johnson et al. Reference Johnson, Lynch, Marshall, Mead and Hirst2013; Traverso et al. Reference Traverso, Laken, Lu, Maa, Langer and Bourouiba2013; Bourouiba, Dehandschoewercker & Bush Reference Bourouiba, Dehandschoewercker and Bush2014; Gilet & Bourouiba Reference Gilet and Bourouiba2014, Reference Gilet and Bourouiba2015; Josserand & Thoroddsen Reference Josserand and Thoroddsen2016; Jung et al. Reference Jung, Staples, Dabiri, Marsden, Prakash, Davis, Shadden, Savin, Bourouiba and Sznitman2016; Poulain & Bourouiba Reference Poulain and Bourouiba2018; Alsved et al. Reference Alsved, Bourouiba, Duchaine, Löndahl, Marr, Parker, Prussin and Thomas2019; Poulain & Bourouiba Reference Poulain and Bourouiba2019; Bourouiba Reference Bourouiba2021a,Reference Bourouibab). In industrial applications, the control of spray, thermal coatings, and more also requires understanding of splash (Aziz & Chandra Reference Aziz and Chandra2000; Fauchais et al. Reference Fauchais, Vardelle, Vardelle and Fukumoto2004; Dhiman & Chandra Reference Dhiman and Chandra2005).
Upon impact on a pool, a liquid drop of diameter  $d_{0}$ and impact velocity
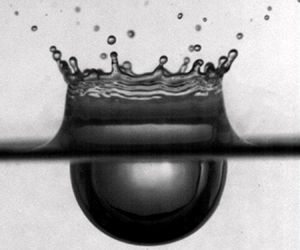
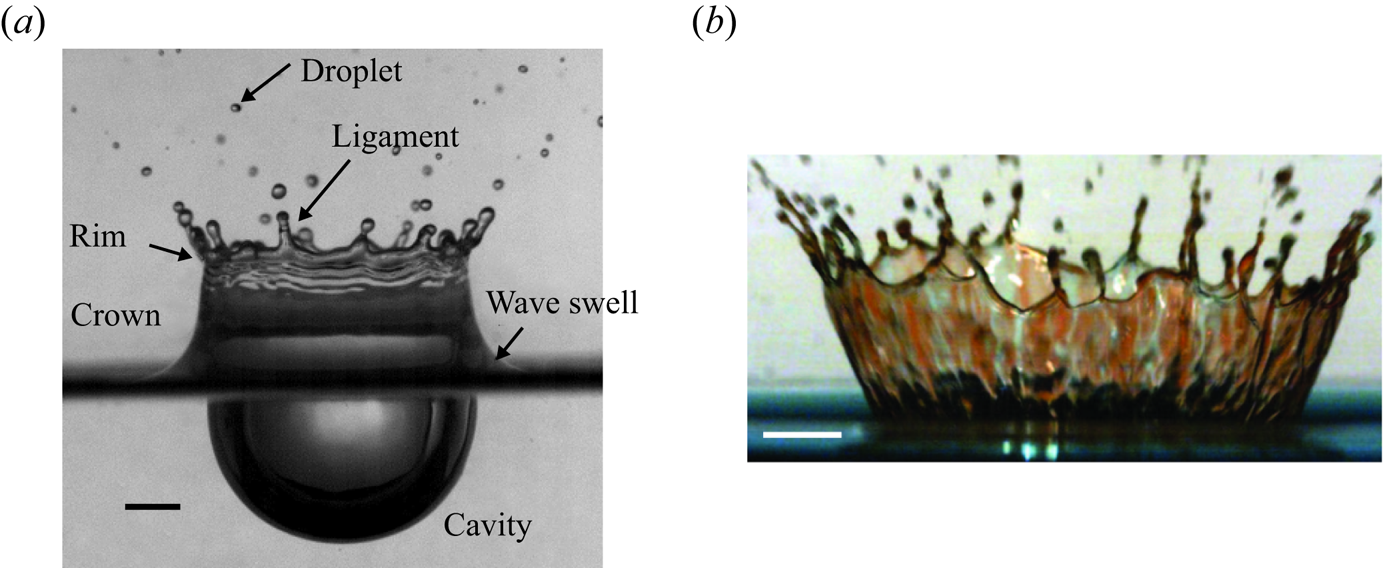
 $u_{0}$ can generate a splash (see figure 1). When a splash occurs on a deep pool (figure 1a), first, an air cavity forms below the liquid interface while a cylindrical liquid sheet rises above the surface (figure 1). As the sheet rises, azimuthal instabilities emerge, leading to the formation of ligaments themselves breaking into secondary droplets, giving it a crown-like form (figure 1a). Upon reaching maximum height, the crown starts to collapse back into the pool. Eventually the cavity collapses as well. During such process a myriad of secondary droplets can be formed and projected with great speed. Moreover, a high-pressure stagnation point can be created in the underlying cavity, forming an upward-rising jet, itself potentially breaking to generate further droplets. The seemingly simple droplet impact on a liquid pool thus shows a rich behaviour. In many applications, the resulting complex mixing between the impinging and receiving liquids is of critical importance. For example, using dyes of different colour, figure 1(b) shows that droplets of different liquid compositions can be generated after impact. Since the seminal work of Worthington (Worthington Reference Worthington1877, Reference Worthington1883, Reference Worthington1908; Worthington & Cole Reference Worthington and Cole1897) and Edgerton (Edgerton & Killian Reference Edgerton and Killian1954), the rich physics governing liquid-on-liquid impacts and the resulting splash have been the subject of extended interest.
(a) Splash on deep pool forming a cavity, wave swell, crown and secondary droplets. The crown is bounded upward by a rim, a bulge, typical of extended free sheets in the air. The rim destabilizes to form the ligaments and droplets seen ejected upward. Scale bar: 2 mm. (b) Splash on a thin film (Bourouiba Reference Bourouiba2021a). The impinging drop liquid and the receiving film liquid are of different colours, showing complex mixing in the ejected droplets. Scale bar: 4 mm.
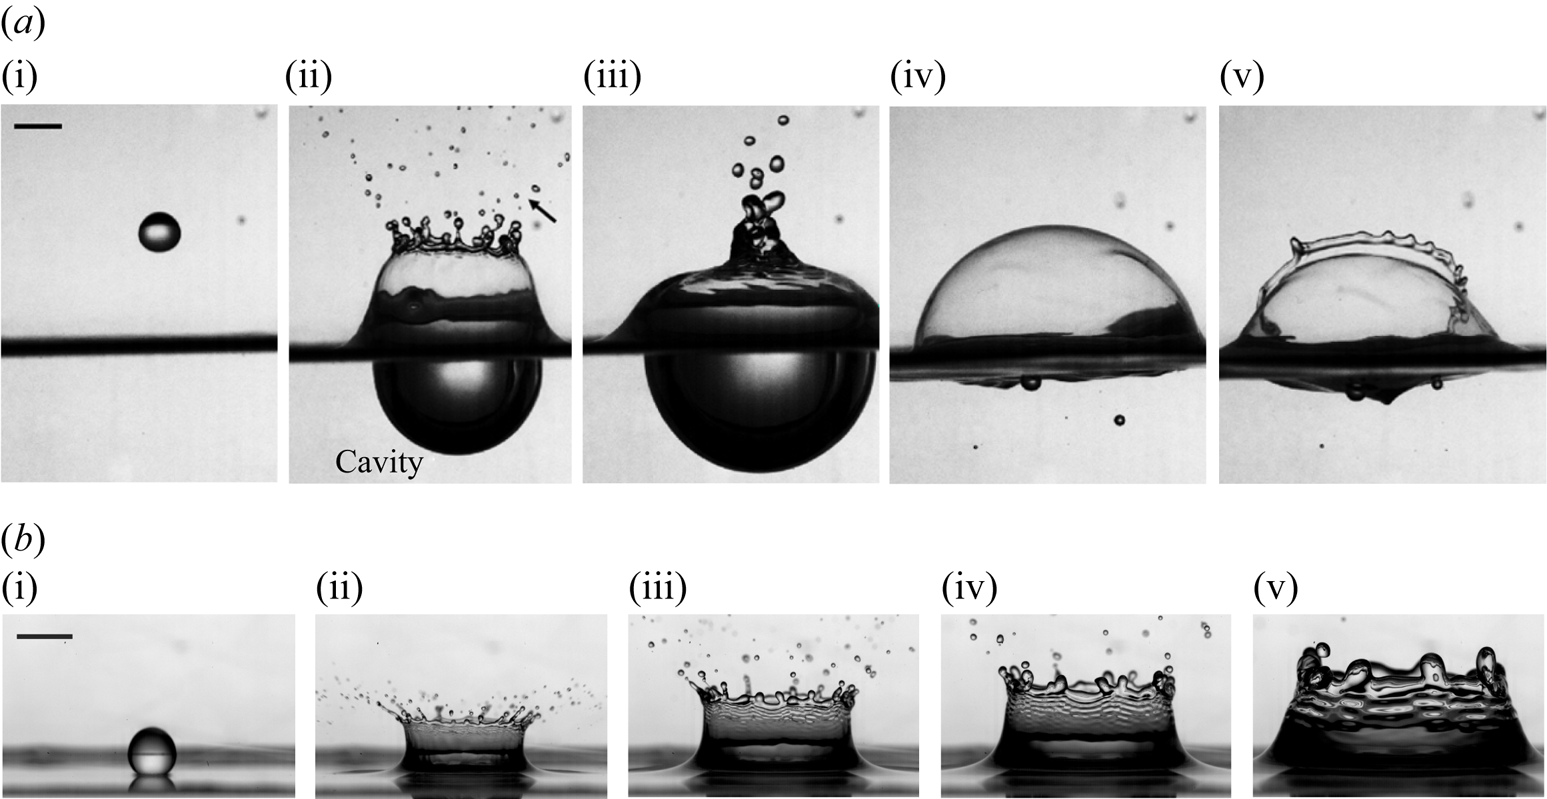
Depending on the energetics of the impact with respect to the interfacial and gravitational restoring forces, a crown splash can occur (figure 1) or is replaced by a closing cavity eventually forming a bubble and jet (figure 2a). The Weber number,  ${\textit {We}}$, and Froude number,
 ${\textit {Fr}}$, are two non-dimensional parameters quantifying the relative importance of the kinetic energy of the impacting drop to its surface energy or to the potential gravitational energy, respectively. They are defined as
 \begin{equation} {\textit{We}}=\frac{\rho u_0^2 d_0}{\sigma},\quad {\textit{Fr}} = \frac{u_0^2}{g d_0}, \end{equation}
with  $\rho$ the density and
 $\sigma$ the surface tension of the liquid. An extensive survey of different impact outcomes as a function of
 ${\textit {We}}$ and
 ${\textit {Fr}}$ is discussed in Murphy et al. (Reference Murphy, Li, d'Albignac, Morra and Katze2015).
(a) Image sequence for (i) descending drop, (ii) bending crown, (iii) canopy development, (iv) bubble formation and (v) bubble burst during a drop–pool impact. These correspond to dimensionless time  $t u_0/d_0=8.4, 16.8, 151.5, 185.1$ in (ii)–(v) respectively. The impact Weber number is
 ${\textit {We}} = 1700$ here. In (a ii), the arrow points to secondary droplets ejected from the splash canopy, typically formed at late time, when it forms. (b) Image sequence for the typical rise of an approximately cylindrical splash crown, up to maximum height, obtained for
 ${\textit {We}}=990$ and (i)–(v)
 $t u_0/d_0=0, 2, 4, 6, 14$. A scale bar of 5 mm is given for each sequence in (a i,b i).
Most of the focus has been on drop impacts on thin liquid layers in which the layer thickness  $H$ is smaller than the impacting drop diameter
 $d_{0}$, i.e.
 $H \ll d_{0}$ (Rein Reference Rein1993; Weiss & Yarin Reference Weiss and Yarin1999; Wang & Chen Reference Wang and Chen2000; Roisman & Tropea Reference Roisman and Tropea2002; Josserand & Zaleski Reference Josserand and Zaleski2003; Cossali et al. Reference Cossali, Marengo, Coghe and Zhdanov2004; Josserand, Ray & Zaleski Reference Josserand, Ray and Zaleski2016). A comprehensive survey of published experimental and numerical results obtained for thin films is reviewed by Liang & Mudawar (Reference Liang and Mudawar2016). In contrast, less attention has been paid to impacts on deep liquid layers (Engel Reference Engel1966, Reference Engel1967; Prosperetti & Oguz Reference Prosperetti and Oguz1993; Agbaglah et al. Reference Agbaglah, Thoraval, Thoroddsen, Zhang, Fezzaa and Deegan2015), where the resulting cavity–crown system shows distinctive characteristics. Here, a deep pool is defined to be one in which the air cavity at its maximum depth does not interact with the pool boundary. Such a pool has a typical thickness
 $H$ much greater than the impacting drop diameter:
 $H \gg d_{0}$.
For impacts on deep pools, the cavity dynamics has received most attention, with an initial attempt to model its growth dynamics using a drop–cavity energy balance model Engel (Reference Engel1966, Reference Engel1967). However, these results were limited given the incorrect potential flow field used therein (e.g. Lherm & Deguen Reference Lherm and Deguen2023). Similarly, by assuming that entire drop initial energy is converted to cavity potential energy, Pumphrey & Elmore (Reference Pumphrey and Elmore1990) and Liow (Reference Liow2001) studied the maximum cavity depth  $D_m$ in terms of the drop diameter
 $d_{0}$ and its impacting velocity
 $u_{0}$. The accuracy and robustness of such energy analysis for a hemispherical cavity were further questioned by Bisighini et al. (Reference Bisighini, Cossali, Tropea and Roisman2010), who instead developed a descending sphere model based on potential flow and the Bernoulli equation. Lherm & Deguen (Reference Lherm and Deguen2023) extended this unsteady solution using a Legendre polynomial expansion. The cavity temporal evolution was also simulated numerically by Berberović et al. (Reference Berberović, van Hinsberg, Jakirlić, Roisman and Tropea2009), Morton, Rudman & Jong-Leng (Reference Morton, Rudman and Jong-Leng2000), van Hinsberg et al. (Reference van Hinsberg, Budakli, Göhler, Berberović, Roisman, Gambaryan- Roisman, Tropea and Stephan2010), Ray, Biswas & Sharma (Reference Ray, Biswas and Sharma2015) and more recently Wang et al. (Reference Wang, Liu, Bayeul-Lainé, Murphy, Katz and Coutier-Delgosha2023). Recently, the early time cavity dynamics immediately after the impact has garnered considerable interest for its key role in shaping subsequent events of the splash, including the crown formation and ejection of secondary droplets. During this initial contact, an ejecta consisting of the receiving pool extends horizontally below the impacting drop before a vertical sheet-like jet develops into a splash crown (Weiss & Yarin Reference Weiss and Yarin1999; Thoroddsen Reference Thoroddsen2002; Zhang et al. Reference Zhang, Toole, Fezzaa and Deegan2012). The interaction between these two jets and an entrapped air cushion leads to complex contact surface dynamics and a rich class of flow instabilities that are the subject of active investigations (Castrejón-Pita, Castrejón-Pita & Hutchings Reference Castrejón-Pita, Castrejón-Pita and Hutchings2012; Thoraval et al. Reference Thoraval, Takehara, Etoh, Popinet, Ray, Josserand, Zaleski and Thoroddsen2012; Agbaglah et al. Reference Agbaglah, Thoraval, Thoroddsen, Zhang, Fezzaa and Deegan2015; Li et al. Reference Li, Thoraval, Marston and Thoroddsen2018). In this study, we focus on the late dynamics when a rising crown sheet has emerged from the receiving pool.
For drop impacts on thin, inviscid layers, Yarin & Weiss (Reference Yarin and Weiss1995) attributed the crown formation to the discontinuity in the velocity distribution at the interface using a quasi-one-dimensional (Q1D) approximation and derived an expression for the temporal evolution of the crown diameter  $\ell$, namely
 $\ell /d_0 \propto (t u_0/d_0 )^{1/2}$. Roisman & Tropea (Reference Roisman and Tropea2002) extended the discontinuity theory of Yarin & Weiss (Reference Yarin and Weiss1995) to predict the crown motion and shape in two dimensions.
Cossali, Coghe & Marengo (Reference Cossali, Coghe and Marengo1997) also analysed the crown diameter temporal evolution for impacts on thin films and found that the crown size grows as the square root of time, in agreement with the prediction of Yarin & Weiss (Reference Yarin and Weiss1995). These findings were verified numerically by Rieber & Frohn (Reference Rieber and Frohn1999). Several studies aimed to decipher the crown rim instability (Fullana & Zaleski Reference Fullana and Zaleski1999; Roisman et al. Reference Roisman, Gambaryan-Roisman, Kyriopoulos, Stephan and Tropea2007; Krechetnikov & Homsy Reference Krechetnikov and Homsy2009; Roisman Reference Roisman2010; Zhang et al. Reference Zhang, Brunet, Eggers and Deegan2010), with a particular interest, again, on impacts on thin films. In contrast to the dynamics on thin films, analytical expressions for the dynamics of the crown diameter and height for drop impacts on deep pools continue to be missing. Further, for deep pool impact, the complete sequence and coupling of the events from cavity to crown to secondary droplets remain poorly understood. For example, the crown sheet velocity and thickness profiles, which are essential descriptions of the crown evolution in both time and space, have not been reported, except estimates given by Cossali et al. (Reference Cossali, Marengo, Coghe and Zhdanov2004) and Aljedaani et al. (Reference Aljedaani, Wang, Jetly and Thoroddsen2018) in the thin-film regime. Although in principle the detailed crown dynamics could be examined using numerical simulations (e.g. Fujimoto et al. Reference Fujimoto, Ogino, Takuda and Hatta2001; Agbaglah et al. Reference Agbaglah, Thoraval, Thoroddsen, Zhang, Fezzaa and Deegan2015; Fudge, Cimpeanu & Castrejón-Pita Reference Fudge, Cimpeanu and Castrejón-Pita2021), the absence of a theoretical framework for crown modelling presents major challenges in predictions for the secondary droplets ejected from the rim of the crown (figure 1).
In this paper, we combine experiments and theory to examine the coupled cavity–crown system with a focus on the regime of crown splash (figure 1a). For  ${\textit {We}} \gtrapprox 1600$, the crown bends inwards leading to the formation of a canopy (figure 2a iii) (Engel Reference Engel1967; Murphy et al. Reference Murphy, Li, d'Albignac, Morra and Katze2015). The canopy can also lead to the formation of a bubble, that can produce microdroplets via the well-known film rupture mechanism, the size and speed of which depend on the thickness and composition of the film (Lhuissier & Villermaux Reference Lhuissier and Villermaux2012; Poulain, Villermaux & Bourouiba Reference Poulain, Villermaux and Bourouiba2018) as illustrated in figure 2(a iv,v). Film bubble drops are distinct families of secondary droplets that can be enriched in contamination from the pool. These were studied elsewhere (Poulain et al. Reference Poulain, Villermaux and Bourouiba2018; Poulain & Bourouiba Reference Poulain and Bourouiba2018, Reference Poulain and Bourouiba2019; Bourouiba Reference Bourouiba2021a) and are beyond the scope of this paper. As a result, here, we focus our attention on the range of
 ${\textit {We}}$ identified experimentally to ensure splash without canopy closure:
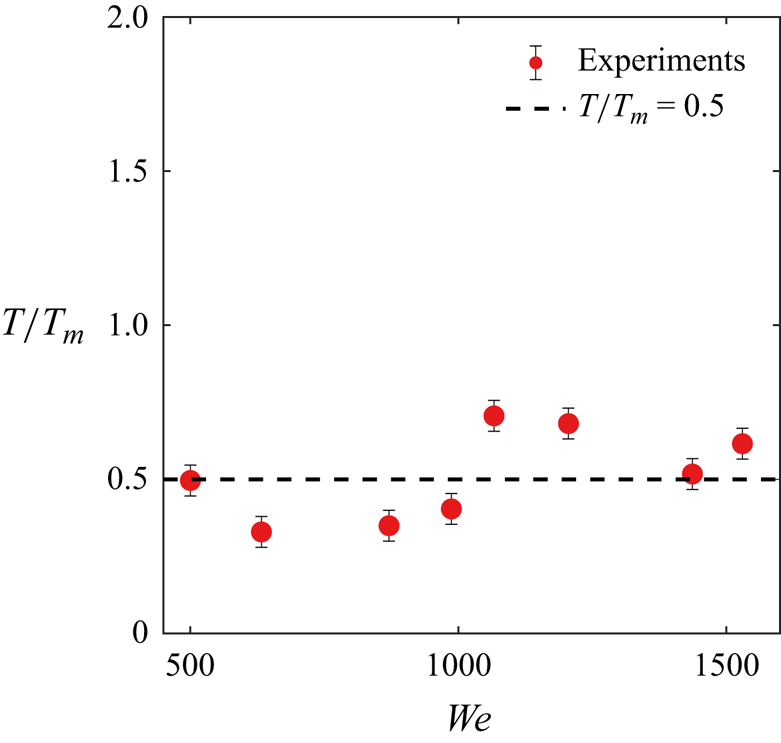
 $500 < {{\textit {We}}} < 1600$ for water drops impacting deep-water pools. Figure 2(b) and supplementary movie show a typical splash development in this regime where an approximately cylindrical crown arises, shedding droplets around the rim. It is interesting to note that for such a splash regime, most secondary droplets are ejected from the crown rim before the crown reaches its maximum height, an observation that remains valid over the full range of
 ${\textit {We}}$ in our range of interest (figure 3).
All of the secondary droplets are ejected from the crown rim by  $T_m$, the time of maximum crown height. The figure shows the point in time in which about
 $95\,\%$ of the microdroplets detected from the crown have been emitted. This occurs around half the time of maximum crown height over the full range of
 $\textit{We}$ we consider. Here,
 $t_m$ is the dimensional time at which the crown reaches its maximum height and
 $T_{m} = t_{m} \sqrt {\sigma / \rho d_{0}^{3}} \approx 1$ is the associated dimensionless time non-dimsionalized with the capillary time. An average of
 $10$ experiments are shown per
 $\textit{We}$ here, again, focusing on a regime of crown splash free of canopy closure and where tracking of appearance of the droplets emitted by the crown is done regardless of their size.
The rest of this paper is structured as follows. In § 2 we explain our measurement methods for the coupled cavity–crown system. We then analyse the cavity evolution in § 3 based on the model of Bisighini et al. (Reference Bisighini, Cossali, Tropea and Roisman2010). We derive an asymptotic solution to the model that captures the experiments. We devote § 4 to examining the splash crown, modelled as a double-sided cylindrical sheet. Connection to the cavity expansion is first established empirically for the crown diameter. We subsequently invoke the thin-film approximation for the crown sheet, leading to conservation equations for a Q1D flow. We solve the corresponding initial-value problems asymptotically for the velocity field, the thickness profile and the height evolution of the crown sheet. Our analytical results are validated using experimental measurements. We discuss the conclusions in § 5.
2. Experiments and measurement methods
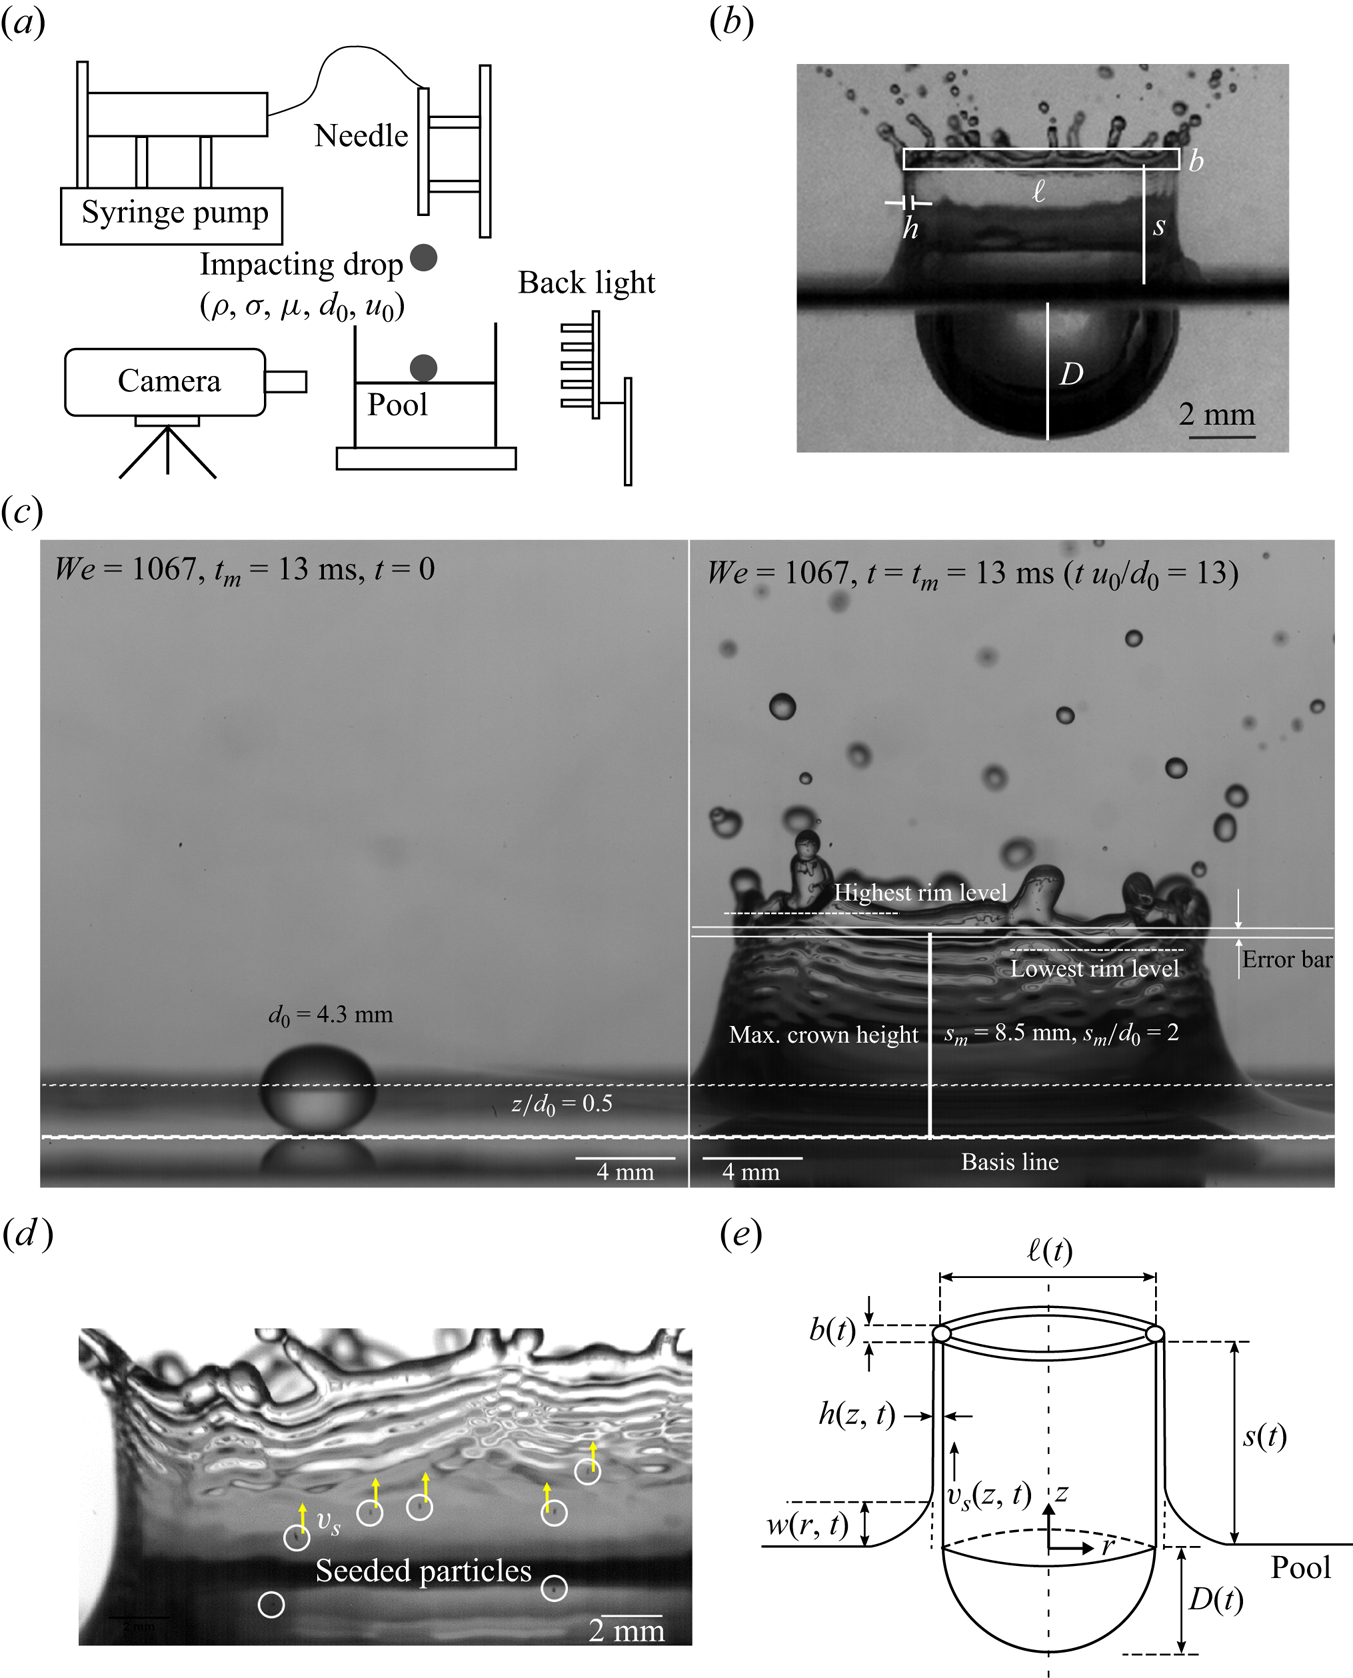
We release one water drop at a time from a range of heights on a liquid pool, made of the same fluid as that of the impacting drop. We consistently produce water drops of diameter  $d_{0} \approx 4\unicode{x2013}4.7$ mm as shown in figure 4(a) to impact a tank that ensures deep-pool conditions, with dimensions on all sides and in depth that are more than 10 times the diameter of the impacting drop. The effective diameter of the drop is measured from its area and used as the impacting drop diameter
 $d_{0}$ (Wang & Bourouiba Reference Wang and Bourouiba2023, Reference Wang and Bourouiba2018). We vary the imparted energy of impact by changing the drop release heights, with impact velocities measured to be up to
 $u_{0} =5\ {\rm m}\ {\rm s}^{-1} \vphantom{{\rm s}^{-1^{-1}}}$ at the point of impact. These values are associated with Weber numbers up to
 ${{\textit {We}}} \approx 1600$. To minimize impact effects associated with the initial shape of an impinging drop, we chose the release heights so that at the impact time,
 $t=0$, all drops share a similar aspect ratio caused by the capillarity-induced shape oscillations during free-fall. High-speed imaging is conducted using back-lighting along with a classical diffuser and at frame rates of 3200–5000 per second (fps) for the colour camera and 10 000–12 500 fps for the monochrome camera for most impacts, or higher if need be for the very early time dynamics, and up to 30 000 fps. The experimental set-up was designed to minimize vibration, and experiments were conducted in a laboratory with ambient temperature control. Lighting was designed, installed and used to minimize heating effect on the pool. A combination of imaging was done: some focusing on the crown above the interface pool; some focusing on the cavity below the interface pool; and some capturing both top and bottom dynamics across the interface. Measurements account for the presence of a meniscus with regard to crown height, crown thickness and velocity profile, as discussed in the relevant sections and figure captions. We only focus on the range of
 ${\textit {We}}$ identified experimentally to ensure splash without canopy closure:
 $500 < {{\textit {We}}} < 1600$ for water drops impacting deep-water pools, as seen for example in the sequence of figure 2(a). The range of parameters and values used are given in table 1.
(a) A drop is released from heights varying from 2 to 5 mm. Backlighting with a diffuser is used to visualize the splash with a high-speed camera. (b) A typical cavity–crown image with key dimensions labelled is shown. The rectangle here encloses the corrugated rim without all the attached ligaments. The width  $b$ is the characteristic rim diameter. (c) Left: drop from the surface determined at point of impact using reflection on the interface. Right: the resulting crown at its maximum height. The crown height is defined between the unperturbed pool interface to the mean base rim level. Note the relatively higher curvature for heights below
 $z/d_0 = 0.5$, preventing measurements of particle velocity in and thickness of the sheet. This relatively higher curvature junction is also visible in figure 2(b). We also illustrate the uncertainty of the crown height introduced mostly by the error on detection of the base of the rim. Note that the error on the edge of rim detection is typically larger than the standard deviation of crown heights between repeat experiments. Meanwhile, the variability of rim level measured at different azimuthal angles is typically twice that of the crown height error shown here. (d) Particle tracking for the sheet velocity measurement. The particles used are of
 ${\approx }50\ \mathrm {\mu } {\rm m}$ with error on position of their centre no larger than 2–3 pixels, that is, at most
 $0.03$ mm, which is smaller than their distance travelled over the sampling time we find sufficient to determine their speed in subsequent sections and figure 8, e.g.
 $\approx$0.5 mm. (e) Schematic of the modelled cavity–crown system formed upon drop impact on a liquid pool in axisymmetric cylindrical coordinates
 $(r,z)$. The cavity depth
 $D(t)$, wave swell profile
 $w(r,t)$, crown sheet thickness
 $h(z,t)$, crown height
 $s(t)$, crown diameter
 $\ell (t)$, rim diameter
 $b(t)$ and crown sheet velocity
 $v_s(z,t)$ are shown.
Experimental conditions for water drop impacts on water pools when examining various quantities of interest (leftmost column). Deionized water was used for both the impacting drop and the pool fluid with density, kinematic viscosity and surface tension  $\rho = 1 \times 10^{3}\ {\rm kg}\ {\rm m}^{-3}$,
 $\mu = 1 \times 10^{-3}$ mPa s and
 $\sigma = 72 \times 10^{-3}\ {\rm mN}\ {\rm m}^{-1}$, respectively. The values of the Weber number
 ${{\textit {We}}} = \rho u_{0}^{2} d_{0} / \sigma$, Froude number
 ${{\textit {Fr}}} = u_{0}^{2}/ g d_{0}$, Bond number
 ${{\textit {Bo}}} = \rho g d_{0}^{2}/ \sigma$, Reynolds number
 ${Re} = \rho u_{0} d_{0}/ \mu$ and the number of experiments performed are also provided.
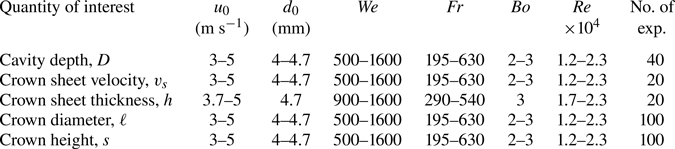
Table 1 also lists five key quantities that we consider for the cavity–crown system in a splash experiment, as illustrated in figure 4(b). These include the cavity depth  $D$, the crown diameter
 $\ell$, the axial flow velocity in the crown sheet
 $v_s$, the crown sheet thickness
 $h$ and the crown height
 $s$. Specifically,
 $D$ is measured between the undisturbed pool surface and the lowest cavity point;
 $\ell$ is the horizontal distance between the outer sheet boundary taken immediately below the lowest elevation of the rim. Note that
 $s$ is the vertical distance between the unperturbed pool surface and the spatially averaged lower rim boundary along the azimuth,
 $\theta$. We define crown height
 $s$ based on such a mean value to remove fluctuations caused by any periodic rim instabilities (e.g. of the Rayleigh–Plateau type). Specifically, perturbations over the mean value
 $s$ in the form of
 $\tilde {s}(\theta,t)=\sum _{n\neq 0} c_n(t){\rm e}^{{\rm i} n \theta }\in \mathbb {R}$ do not alter
 $s$ for all permissible time-dependent complex amplitudes
 $c_n(t)$ and wave modes
 $n\in \mathbb {Z}$ due to the identity
 $\int _{-{\rm \pi} }^{\rm \pi} \tilde {s}\,{\rm d}\theta =0$. Averaging also mitigates random spatial inhomogeneities introduced in the initial impact dynamics. As a result, our measurement of
 $s$ is expected to approximate an axisymmetric quantity well, offering robust characteristics of the splash across experiments repeated under the same conditions (including camera settings). Note that the modal amplitude
 $c_n$ of the rim instabilities is not the focus of this paper. For this reason, we also distinguish experimental uncertainty associated with
 $s$ from the variability of the rim levels at different azimuthal locations. Typically, the former is mostly introduced by edge detection algorithms that determine the rim boundary in images captured under specific settings; whereas the latter is caused by rim instabilities and inhomogeneous impact, whose magnitude in our case is at most twice that of the error in
 $s$, as shown in figure 4(c). In comparison, the standard deviation of
 $s$ measurements obtained between repeated experiments is consistently smaller than the
 $s$ error associated with rim edge detection methods at all times. While length measurements of
 $D$,
 $\ell$ and
 $s$ can be obtained using standard image processing techniques, measurements of
 $v_s$ and
 $h$ require dedicated treatments.
First, to determine the sheet velocity profile, in a separate set of experiments, we seed the impacting drop and the pool fluid with polyethylene microspheres of  ${\approx }50\ \mathrm {\mu }{\rm m}$ in diameter and a density of
 $1 \pm 0.05\ {\rm g}\ {\rm mL}^{-1}$ at a concentration of about
 $0.2\ {\rm g}$ per 10 mL. These particles are used as flow tracers. Trajectories of the particles entering the crown sheet at varied times are captured (figure 4d and supplementary movie) for both the drop fluid and the pool fluid associated with a wide range of impacting Weber numbers (
 $500<{\textit {We}}<1200$).
Next, to measure the sheet thickness profile, we use a light absorption method (Vernay, Ramos & Ligoure Reference Vernay, Ramos and Ligoure2015; Wang & Bourouiba Reference Wang and Bourouiba2017; Si et al. Reference Si, Wang, Chandrasekhar and Bourouiba2024). We select the use of nigrosin which we have established, in prior work (Wang & Bourouiba Reference Wang and Bourouiba2017), to follow the Beer–Lambert law of absorption even with non-monochromatic white light:
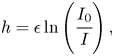 \begin{equation} h = \epsilon \ln \left(\cfrac{I_0}{I} \right), \end{equation}
where  $I_{0}$ is the incident background light intensity and
 $I$ is the transmitted light intensity after passage through a film of thickness
 $h$ (e.g. Wang & Bourouiba Reference Wang and Bourouiba2017; Si et al. Reference Si, Wang, Chandrasekhar and Bourouiba2024). Here,
 $\epsilon = 1/(\gamma C) = 2220\ \mathrm {\mu }{\rm m}$ with absorptivity
 $\gamma = 4.5 \times 10^{-3}\ {\rm L}\ (\text {g}\,\mathrm {\mu } {\rm m})^{-1}$, given a nigrosin dye concentration of
 $C = 0.1\ {\rm g}\ {\rm L}^{-1}$ herein. Moreover,
 $I$ is the measured intensity of transmitted light after passage through two films of thickness
 $h$, i.e.
 $2h$, rather than just one. Moreover, in the crown geometry considered here, we measure intensity only above the point of highest curvature marking the ‘wave swell’, typically above
 $z = 0.5$ as seen, for example, in figure 4(c).
3. Cavity dynamics
We begin our analysis with the evolution of the cavity below the liquid surface generated by the impacting drop. An axisymmetric cylindrical coordinate system  $(r,z)$ with origin located at the initial drop–pool contact point at time
 $t=0$ is used to describe the cavity–crown structure (figure 4d). Based on Bisighini et al. (Reference Bisighini, Cossali, Tropea and Roisman2010), we derive an explicit approximate expression for the cavity depth
 $D(t)$ in the large
 ${\textit {We}}$ and
 ${\textit {Fr}}$ limits that captures the experimental measurements well, up to maximum depth.
3.1. Governing equations for the cavity
Bisighini et al. (Reference Bisighini, Cossali, Tropea and Roisman2010) model the cavity as an expanding sphere of radius  $a(t)$ centred at
 $z = -z_c(t)$ along the axial direction. Assuming potential flow for the liquid surrounding the cavity and consequently balancing pressure along the crater boundary obtained from the linearized Bernoulli equation with surface tension, i.e. enforcing the Young–Laplace equation near the cavity bottom
 $z=-D(t)$, one derives the following non-dimensional ordinary differential equations (ODEs) for the cavity:
 \begin{gather} \ddot{a}={-}\frac{3\dot{a}^2}{2a}-\frac{2}{{\textit{We}}\, a^2}-\frac{z_c}{{\textit{Fr}}\, a}+\frac{7\dot{z}_c^2}{4a}, \end{gather}
 \begin{gather}\ddot{z}_c={-}\frac{3\dot{a}\dot{z}_c}{a}-\frac{9\dot{z}_c^2}{2a}-\frac{2}{{\textit{Fr}}}, \end{gather}
where the overdot denotes time derivatives, the Weber number  ${\textit {We}}$ and Froude number
 ${\textit {Fr}}$ are defined in (1.1a,b) and we have chosen the reference length
 $d_0$ (impacting drop diameter), velocity
 $u_0$ (impacting velocity) and time
 $d_0/u_0$ to obtain dimensionless variables. We henceforth default to this inertial scaling in the rest of this study unless otherwise stated.
The initial condition associated with (3.1) must be specified at a non-zero time  $t=t_0\gtrapprox 2$ to allow for sufficient time for the cavity formation caused by the initial drop penetration process (Fedorchenko & Wang Reference Fedorchenko and Wang2004; Berberović et al. Reference Berberović, van Hinsberg, Jakirlić, Roisman and Tropea2009; Wang et al. Reference Wang, Liu, Bayeul-Lainé, Murphy, Katz and Coutier-Delgosha2023). Detailed discussion for such early phase drop deformation is not the focus of this study. Instead, we close (3.1) with initial values measured experimentally at around
 $t_0\approx 1.5$ when the cavity shape starts to take a spherical cap. Subsequently, the crater depth can be modelled using
 $D(t)=a(t)+z_c(t)$ for
 $t>t_0$.
3.2. Asymptotic solutions
One important solution to (3.1) in the  ${\textit {We}}\to \infty$ and
 ${\textit {Fr}}\to \infty$ limits, with
 $\dot {z}(t_0)=z(t_0)=0$, is given by
 \begin{equation} a(t) = A (t-t_s)^{2/5},\quad z_c(t)=0, \end{equation}
where  $A$ and
 $t_s$ are constants. This scaling law is well known; for example, Berberović et al. (Reference Berberović, van Hinsberg, Jakirlić, Roisman and Tropea2009) estimated that
 $A=(5/4)^{2/5}$,
 $t_s=6/5$.
Next, we develop an asymptotic correction for  $z_c$, noting that the coupling between
 $a$ and
 $z_c$ in (3.1a) is weak if the cavity's radial expansion dominates its axial translation, i.e.
 $|z_c/a|\ll 1$. In this case, (3.2a,b) also holds for moderate
 ${\textit {Fr}}$ and large
 ${\textit {We}}$. Therefore, substituting (3.2a,b) into (3.1b) while considering
 $|\dot {z}_c/\dot {a}|\ll 1$ leads to
 \begin{equation} \ddot{z}_c+\frac{6\dot{z}_c}{5(t-t_s)}+\frac{2}{{\textit{Fr}}}=0, \end{equation}
which can be solved exactly to give
 \begin{equation} D(t)=a+z_c=A(t-t_s)^{2/5}+\frac{-5t^2+10t_st}{11\,{\textit{Fr}}}+\frac{c_1}{(t-t_s)^{1/5}}+c_2, \end{equation}
where  $c_1$ and
 $c_2$ are constants determined by initial values. Equation (3.4), parametrized by
 ${\textit {Fr}}$, offers an explicit approximate solution to (3.1) in the strict limit of
 ${\textit {We}}\to \infty$.
Compared with (3.2a,b), the correction offered by finite  ${\textit {Fr}}>0$ in (3.4) alters the monotonic behaviour of the original limit and introduces a global maximum for
 $D$ as
 $t$ increases. Physically, this is consistent with the fact that the cavity depth must retract after its initially growth and penetration into the pool due to gravitational effects. The kinematic reason for such retraction is that the centre of the air cavity
 $-z_c$ given by (3.3) with
 ${\textit {Fr}}>0$ rises over time, i.e.
 $z_c<0$ and
 $\dot {z}_c<0$. Originally,
 ${\textit {Fr}}$ enters (3.1b) because gravitational potential for the liquid flow field around the cavity is incorporated in the dynamic Bernoulli equation. Therefore it is primarily the gravitational pull on the displaced liquid that stops the air cavity from penetrating the pool indefinitely, rather than surface tension. A direct comparison between these two restoring forces for cavity retraction is given in § 3.3.1. In contrast, we also show later in § 4.4 that the leading-order mechanism that modulates the growth of an initially rising crown is surface tension rather than gravity.
3.3. Experimental and numerical results
We now can compare the cavity depth measurements with the models of (3.1), (3.2a,b) and (3.4). All experimental data obtained at early times are aggregated and follow (3.2a,b). However, given the open questions regarding the very initial details of the impact, the constants are impossible to predict at this time. The constants are found to be  $A=1$ and
 $t_s=1.4$ using a least-squares method, and close to the values of Berberović et al. (Reference Berberović, van Hinsberg, Jakirlić, Roisman and Tropea2009). Accordingly,
 $z(t_0)=\dot {z}(t_0)=0$ and
 $a(t_0)$,
 $\dot {a}(t_0)$ are evaluated using (3.2a,b) as initial conditions. Solutions to (3.1) are calculated numerically using a fourth-order Runge–Kutta scheme.
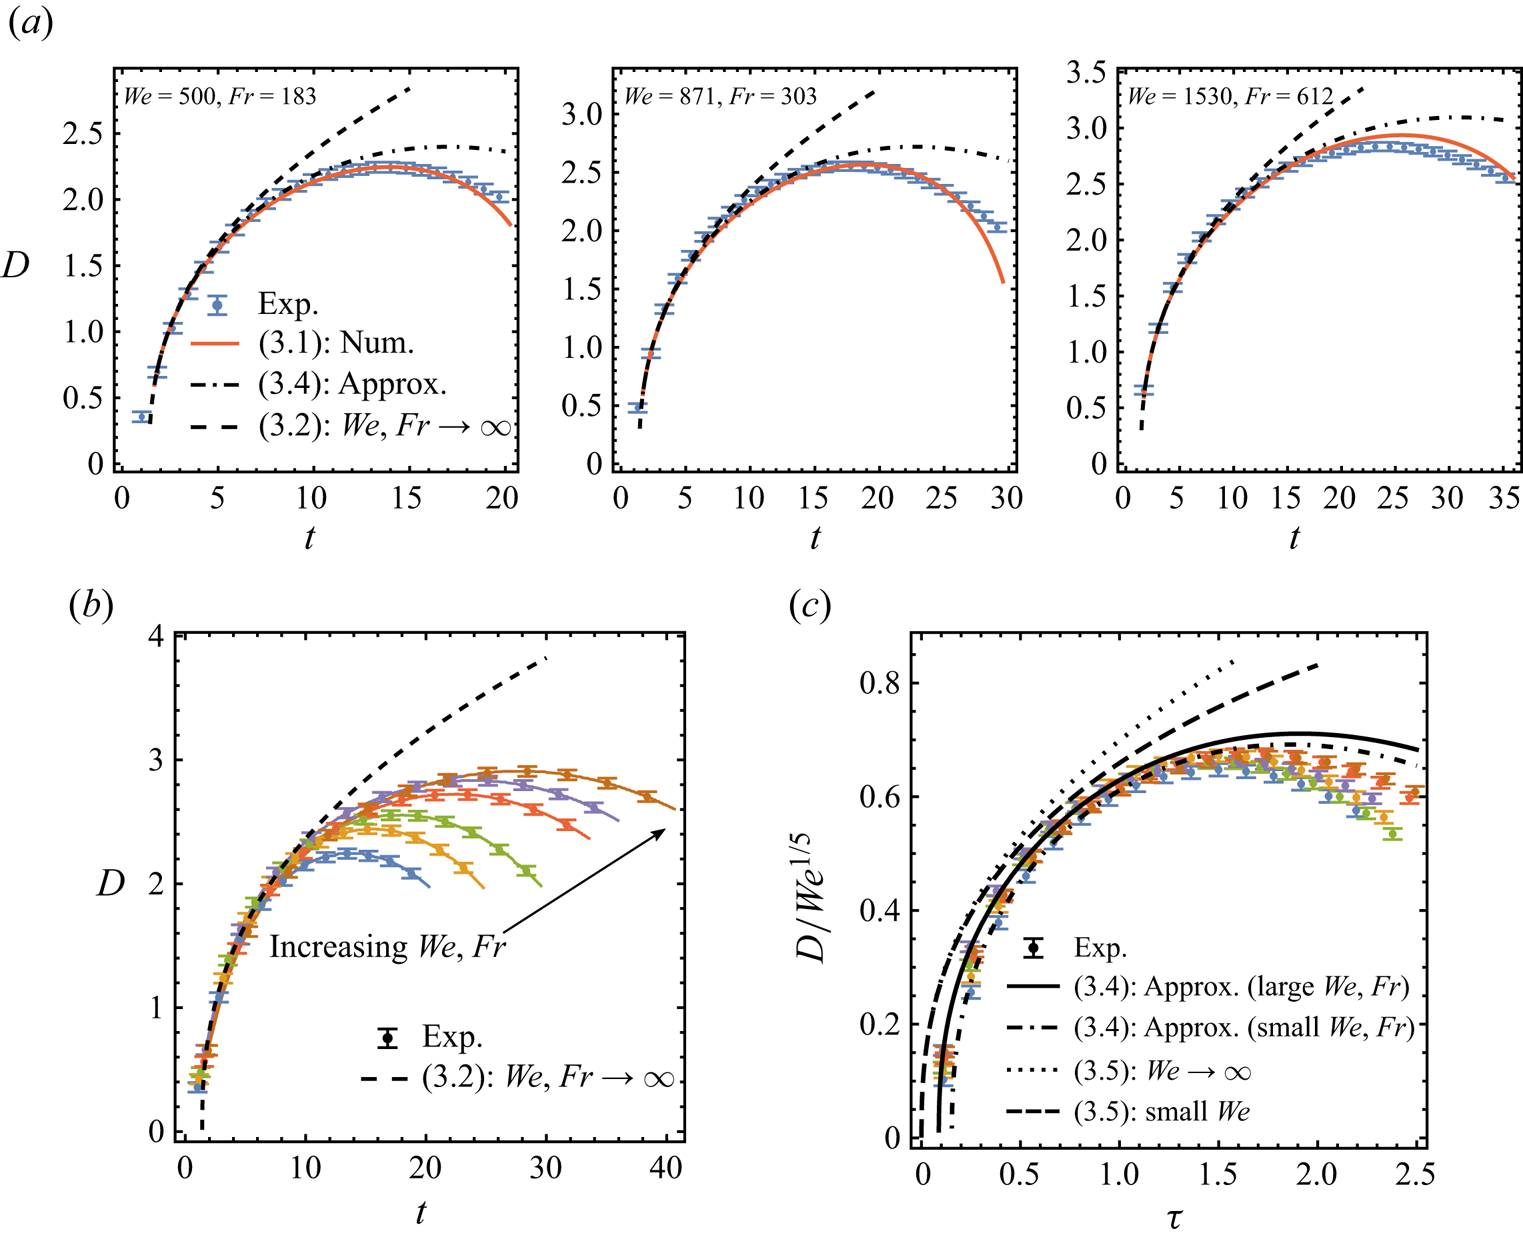
Figure 5(a) shows comparisons of  $D(t)$ for experiments and theory for three sets of increasing
 ${\textit {We}}$ and
 ${\textit {Fr}}$. In all cases, the numerical solution to (3.1) is in agreement with the measurements over time, well beyond the instant of maximum cavity depth. This is not surprising as similar verification for the model of Bisighini et al. (Reference Bisighini, Cossali, Tropea and Roisman2010) was also provided in Lherm & Deguen (Reference Lherm and Deguen2023) and Wang et al. (Reference Wang, Liu, Bayeul-Lainé, Murphy, Katz and Coutier-Delgosha2023) with different initial conditions. In addition, we show the performance of the two asymptotic solutions (3.2a,b) and (3.4) for each experiment: the improvement made by the
 ${\textit {Fr}}$-dependent approximation (3.4) over the limiting power law (3.2a,b) is clear. Specifically, (3.2a,b) as a monotonically increasing function can only capture measurements of cavity dynamics at early times, whereas (3.4) provides a theoretical peak enabled by gravitational effects of finite
 ${\textit {Fr}}$ that overall corrects (3.2a,b) close to the observed maximum depths.
Time evolution of cavity depth  $D$. In the three panels of (a), experiments are compared to theory in the limit of
 ${\textit {We}}, {\textit {Fr}} \to \infty$ (see (3.2a,b)) and for the approximation
 $|z_c/a|\ll 1$ and
 $|\dot {z}_c/\dot {a}|\ll 1$ for increasing
 ${\textit {We}}$ and
 ${\textit {Fr}}$. In each case, the solid line shows numerical solution to (3.1), the dashed line gives the limiting law of (3.2a,b) and the dash-dotted line plots the approximation of (3.4). (b) Plot of
 $D(t)$ over inertial time
 $t$ shown for
 $({\textit {We}},{\textit {Fr}})=(500,183), (633,232), (871,303), (1067,420), (1434,509), (1530,612)$. The dashed limit (3.2a,b) captures all
 $D(t)$ data at early times. (c) Rescaled
 ${\textit {We}}^{-1/5}D$ as a function of capillary time
 $\tau$ (see (3.6a,b)) that collapses the same measurements given in (b). Here the dotted and dashed lines respectively show the rescaled (3.5b) for
 ${\textit {We}}=\infty$ and
 ${\textit {We}}=500$, while the solid and dot-dashed lines respectively show (3.4) evaluated using
 $({\textit {We}},{\textit {Fr}})=(500,183)$ and
 $(1434,509)$. The error bars shown capture the error of detection of the edge of the cavity.
3.3.1. Universal underlying dynamics on the capillary time scale
Now we consider a different asymptotic regime for (3.1a) where the  ${\textit {Fr}}\to \infty$ limit is taken for large but finite
 ${\textit {We}}$. By expanding (3.1a) in power series of
 ${\textit {We}}^{-1}\ll 1$, we explicitly derive in Appendix A.1 the leading-order solution and its next-order correction as follows:
 \begin{gather} a(t) = A(t-t_s)^{2/5}+\frac{1}{{\textit{We}}}\left[-\frac{25(t-t_s)^{6/5}}{18A^2}+A_1 (t-t_s)^{2/5}\right]+O\left(\frac{1}{{\textit{We}}^2}\right), \end{gather}
 \begin{gather}\frac{D(\tau)}{{\textit{We}}^{1/5}} \sim \frac{\tau^{2/5}}{6^{1/5}} - \frac{25 \tau ^{6/5}}{18\times 6^{3/5}}\frac{1}{{\textit{We}}^{2/5}}, \end{gather}
where in (3.5b) we have used the capillary time  $\tau$ (with its dimensional reference
 $T_{cap}$) given by
 \begin{equation} \tau = t \sqrt{\frac{6}{{\textit{We}}}},\quad T_{cap} = \sqrt{\frac{\rho d_0^3}{6\sigma}}, \end{equation}
with  $t$ the time defined earlier as non-dimensional time with respect to impact time, i.e.
 $t = \mathrm {dimensional~time}/(d_0/u_0)$. As
 ${\textit {We}}\to \infty$, (3.5b) thus suggests that
 $D$ scales with
 ${\textit {We}}^{-1/5}$ at leading order while a capillary restoring term decays as
 ${\textit {We}}^{-2/5}$. Figure 5(c) shows the rescaled
 $D(\tau )/{\textit {We}}^{1/5}$ as a function of
 $\tau$. Our experimental data for
 $D$ of specific ranges of
 ${\textit {We}}$ and
 ${\textit {Fr}}$ collapse well under such capillary normalization. However, the corresponding capillarity-dominant model (3.5b) does not capture the collapsed data in this case, whereas the gravity-dominant model (3.4) shows better agreement.
Note the distinction with the effects of varying  ${\textit {We}}$ and
 ${\textit {Fr}}$ on the cavity depth evolution examined next in figure 5(b,c). Under the default inertial scaling, a series of
 $D(t)$ measurements by increasing
 ${\textit {We}}=500$,
 ${\textit {Fr}}=183$ to
 ${\textit {We}}=1530$,
 ${\textit {Fr}}=612$ are also given in figure 5(b). We find that all experiments share the same initial rise that follows the large
 ${\textit {We}},\,{\textit {Fr}}$ law of (3.2a,b), which justifies our estimation of
 $A=1$ and
 $t_s=1.4$ discussed previously. By increasing
 ${\textit {We}}$ and
 ${\textit {Fr}}$, larger maxima of
 $D(t_m)$ are observed at larger times
 $t=t_m$. In addition, figure 5(c) shows a direct comparison between cavity retraction due to gravity and surface tension, using (3.4) and (3.5b), respectively. Even at the lowest experimental value
 ${\textit {We}}=500$, the retraction correction of
 $O({\textit {We}}^{-2/5})$ in (3.5b) does not increase quickly enough to take over the leading-order cavity growth
 $D\propto \tau ^{2/5}$, whereas (3.4) of finite
 ${\textit {Fr}}$ successively generates maximum cavity depths near the measured peaks. Therefore, we conclude that gravity is the dominant restoring force for the cavity.
4. Crown sheet dynamics and coupling with cavity
In this section we develop a simplified theory for the development of the crown sheet as a result of drop impact. We take the crown geometry to be approximated as a double-wall cylinder of spatially uniform diameter  $\ell (t)$, axially varying thickness
 $h(z,t)\ll \ell$ and height
 $s(t)$, as illustrated in figure 4(e). This simplified geometry does not accommodate a sheet of oblique angles nor bending near the wave swell and the rim. More elaborate crown sheet geometries have been studied for drop impact against thin films (Roisman & Tropea Reference Roisman and Tropea2002; Fedorchenko & Wang Reference Fedorchenko and Wang2004), but it was established that films of larger thickness comparable with the drop size (
 $H/d_0\sim 1$) always produce a vertical crown perpendicular to the liquid layer (Wang & Chen Reference Wang and Chen2000; Fedorchenko & Wang Reference Fedorchenko and Wang2004). This is consistent with our impact experiments on a deep pool (
 $H/d_0\gg 1$) where a vertically rising crown sheet can be reasonably identified as the top rim separates away from the bottom wave swell. In the experiments, both
 $\ell (t)$ and
 $s(t)$ are measured immediately below the crown rim. Due to mass transfer enabled by the outward velocity within the thin sheet,
 $v_s|_{z=s}$, the rim destabilizes into corrugations, then ligaments that ultimately fragment into secondary droplets (figure 1). Here, we idealize the rim as a torus of ring diameter
 $b(t)$, neglecting its local azimuthal topological variation induced by instability and fragmentation. Given the geometry involved, we also invoke the thin-film approximation. Despite these geometric simplifications, next we derive analytical expressions for
 $v_s$,
 $h$ and
 $s$ that are in good agreement with our measurements.
4.1. Crown diameter from cavity dynamics
Following Yarin & Weiss (Reference Yarin and Weiss1995) who related the crown expansion to the propagating cavity in a thin film as a kinematic discontinuity, the diameter of the crown sheet above a liquid layer has been investigated extensively, as reviewed by Liang & Mudawar (Reference Liang and Mudawar2016). In those studies, a power law of the form  $\ell (t)=\alpha (t+c)^p$, independent of
 ${\textit {We}}$ and
 ${\textit {Fr}}$, is widely reported, with the exponent in the range
 $0.4< p<0.5$. On the other hand, results obtained for a crown sheet generated in a deep pool are scarce. Notably, Roisman, van Hinsberg & Tropea (Reference Roisman, van Hinsberg and Tropea2008) extended the kinematic discontinuity theory of Yarin & Weiss (Reference Yarin and Weiss1995) and derived an expression for the cavity evolution, and therefore the crown diameter measured at its base
 $\ell =\ell (t;{\textit {We}},{\textit {Fr}},H)$, incorporating a finite liquid layer thickness
 $H$ (dimensionless). However, their expression cannot be generalized to the deep-pool limit as it diverges for
 $H\to \infty$ at any finite
 ${\textit {We}}$ and
 ${\textit {Fr}}$. Instead, its
 ${\textit {We}}\to \infty$,
 ${\textit {Fr}}\to \infty$ limit exists for any given
 $H$, recovering the well-known result of Yarin & Weiss (Reference Yarin and Weiss1995), i.e.
 $\ell \propto \sqrt {t+c}$.
Similar to the geometrical argument made by the kinematic discontinuity theory, here the crown sheet expansion above a deep pool must also be related to that of the underneath cavity. Therefore we propose a model such that after the initial sheet formation when  $t>t_0\approx 1$, the sheet diameter
 $\ell$ grows in accordance with the asymptotic cavity depth
 $D$. Specifically, using the
 ${\textit {We}}\to \infty$ limit of (3.5b), we propose
 \begin{equation} \ell(t) = \alpha D(t+c) \sim \alpha (t+c)^{2/5}, \end{equation}
where the proportional constant  $\alpha$ is independent of time
 $t$ but could depend on
 ${\textit {We}}$ and
 ${\textit {Fr}}$, and the time shift
 $c$ accounts for the observation that the crown sheet develops measurable diameters before the cavity forms.
Indeed, (4.1) captures the experimental data well (figure 6). The best-fit  $\alpha$ and
 $c$ values are of order unity and vary little from a set of
 ${\textit {We}}$,
 ${\textit {Fr}}$ to another. Moreover, in figure 6(b) we compare the long-time behaviour of (4.1), i.e.
 $\ell \propto t^{2/5}$, and the thin-film result of Yarin & Weiss (Reference Yarin and Weiss1995), i.e.
 $\ell \propto t^{1/2}$, against measurements obtained for the larger
 ${\textit {We}}=1070$ on a logarithmic scale. As
 $t$ increases, the data follow more closely the asymptotic growth given by
 $t^{2/5}$ compared with the thin-film limit
 $t^{1/2}$. Capturing the correct scaling law for the crown diameter is particularly important for our subsequent analysis because we show next in §§ 4.3 and 4.4 that the specific best-fit value of the proportional constant
 $\alpha$ is, in fact, not needed for the derivation of the crown thickness and height.
Time evolution of the crown diameter  $\ell (t)$. (a) Experiments are compared with the model of (4.1), with fitted
 $\alpha =1.3, c=2.2$ and
 $\alpha =1.4, c=3.7$ for
 ${\textit {We}}=630$ and
 $1070$, respectively. The two filled data points mark the time when the maximum cavity size is reached in each corresponding experiment. (b) Comparison between the large-time asymptotic theory given by (4.1) where
 $\ell \propto t^{2/5}$ and the thin-film limit of Yarin & Weiss (Reference Yarin and Weiss1995) where
 $\ell \propto t^{1/2}$ against the measurements of
 ${\textit {We}}=1070$. We establish that (4.1) captures the
 $\ell$ data well with the long-time growth scaling closer to
 $t^{2/5}$. Note that all proportional constants are
 $O(1)$ and in fact their specific value is not needed to model the axial crown development, as we see in § 4.3.1. The error bars capture the uncertainty of detecting the outer sheet boundary in the radial direction, at rim base evaluation.

Notably, unlike the peaking behaviour observed for the  $D(t)$ measurements shown in figure 5, here we find that the
 $\ell (t)$ data given in figure 6 are close to monotonic, captured by a power law
 $t^{2/5}$ that is derived for
 $D(t)$ in the strict limit of
 ${\textit {We}},{\textit {Fr}}\to \infty$. The fact that the growth of
 $\ell (t)$ under finite
 ${\textit {We}}$ and
 ${\textit {Fr}}$ beyond the time of maximum cavity depth (labelled in figure 6a) still yields good prediction for the crown requires further mechanistic investigation left for future work. Informed by the cavity dynamics and its coupling with the crown, we can now focus on solving for the crown sheet dynamics, including its thickness in § 4.3 and height in § 4.4.
4.2. Unsteady crown sheet spatio-temporal velocity profile
4.2.1. Quasi-one-dimensional flow
Next we examine the flow velocity field  $\boldsymbol {u}$ in the crown sheet using thin-film lubrication theory (Batchelor Reference Batchelor1967). Generally, the sheet flow is axisymmetric, i.e.
 $\boldsymbol {u}=u_s \hat {\boldsymbol {r}} + v_s \hat {\boldsymbol {z}}$ where
 $\hat {\boldsymbol {r}}$ and
 $\hat {\boldsymbol {z}}$ are, respectively, the radial and axial unit vectors. Here,
 $\boldsymbol {u}$ is governed by the incompressible Navier–Stokes equations:
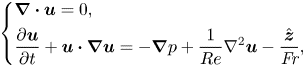 \begin{equation} \left\{\begin{gathered}\boldsymbol{\nabla}\boldsymbol{\cdot} \boldsymbol{u} = 0,\quad\quad\quad\quad\quad\quad\quad\quad\quad\quad\quad\quad\quad\\ \frac{\partial \boldsymbol{u}}{\partial t}+\boldsymbol{u}\boldsymbol{\cdot}\boldsymbol{\nabla}\boldsymbol{u}={-}\boldsymbol{\nabla}p +\frac{1}{Re}\nabla^2 \boldsymbol{u}-\frac{\hat{\boldsymbol{z}}}{{\textit{Fr}}},\end{gathered}\right. \end{equation}
 \begin{equation} \left\{\begin{gathered}\boldsymbol{\nabla}\boldsymbol{\cdot} \boldsymbol{u} = 0,\quad\quad\quad\quad\quad\quad\quad\quad\quad\quad\quad\quad\quad\\ \frac{\partial \boldsymbol{u}}{\partial t}+\boldsymbol{u}\boldsymbol{\cdot}\boldsymbol{\nabla}\boldsymbol{u}={-}\boldsymbol{\nabla}p +\frac{1}{Re}\nabla^2 \boldsymbol{u}-\frac{\hat{\boldsymbol{z}}}{{\textit{Fr}}},\end{gathered}\right. \end{equation}
where  $p$ is pressure and
 $Re\equiv \rho u_{0} d_{0}/ \mu$ is the Reynolds number. Before proceeding, we reiterate the modelling assumption that the crown sheet up to the rim, within
 $0< z< s(t)$, approximates a vertical wall of inner diameter
 $\ell (t)-h(z,t)$ and outer diameter
 $\ell (t)+h(z,t)$, where the diameter of the central ring
 $\ell (t)$ is axially uniform. Note that although in experiments
 $\ell$ is measured as the sheet's outer diameter rather than the central ring diameter, differences between these two become negligible following the thin-sheet assumption, i.e.
 $h/\ell \ll 1$,
 $h/s\ll 1$. As illustrated in figure 4(e), the crown sheet domain is double-cylindrical as follows:
 \begin{equation} \mathcal{D}(t)=\left\{(r,z):\, 0<\left|r-\frac{\ell(t)}{2}\right|<\frac{h(z,t)}{2},\, 0< z< s(t)\right\}. \end{equation}
Therefore applying the lubrication approximation to (4.2a) and radially expanding the flow variables leads to the Q1D flow approximation:
 \begin{equation} v_s=v_s(z,t), \quad u_s=u_s(z,r,t)=\frac{\ell^2-4r^2}{8r}\frac{\partial v_s}{\partial z}\ll v_s \end{equation}
that respects the continuity equation (4.2a) and the symmetry condition  $u_s(z,\ell /2,t)=0$. A formal derivation of (4.4a,b) is given in Appendix A.2.
The dynamic stress condition for the free surface of  $\mathcal {D}$, i.e. the Young–Laplace equation, implies that
 $p \sim \kappa /{\textit {We}}$, where
 $\kappa (z,t)$ is the surface curvature evaluated at
 $|r-\ell /2|=h/2$. In the limit of
 $Re\to \infty$,
 ${\textit {Fr}}\to \infty$ and
 ${\textit {We}}\to \infty$, (4.2b) thus simplifies to the inviscid Burger equation:
 \begin{equation} \frac{\partial v_s}{\partial t}+v_s\frac{\partial v_s}{\partial z}=0,~\mathrm{or~equivalently,}~\frac{{\rm d}v_s}{{\rm d}t}=0 \mathrm{~along~the~parcel}\text{'}\mathrm{s~trajectory.} \end{equation}
For closure, we also prescribe a linear initial profile,  $v_s(z,t_0) \propto z$, at some initial time
 $t_0>0$ shortly after the sheet forms such that the initial sheet height is small, i.e.
 $z< s(t_0)\ll 1$, and therefore a linear profile is valid as a Taylor series expanded around
 $z=0$. This assumption, including the boundary value
 $v_s(0,t)=0$, is further verified by direct measurement of
 $v_s$ in § 4.2.3. As a result, using method-of-characteristics, (4.5) is uniquely solved by
 \begin{equation} v_s=\frac{z}{t-\delta}, \end{equation}
where  $0<\delta \ll 1$ is the offset time required for the onset of sheet formation after drop impact, with
 $\delta$ of the order of a fraction of the inertial reference time
 $d_{0}/ u_{0}$ (0.7–1.4 ms). A similar time scale for such offset was discussed for drop impacts on solid surfaces (Wang & Bourouiba Reference Wang and Bourouiba2017). The physical origin for
 $\delta$ is discussed in more detail next.
4.2.2. Sheet formation offset
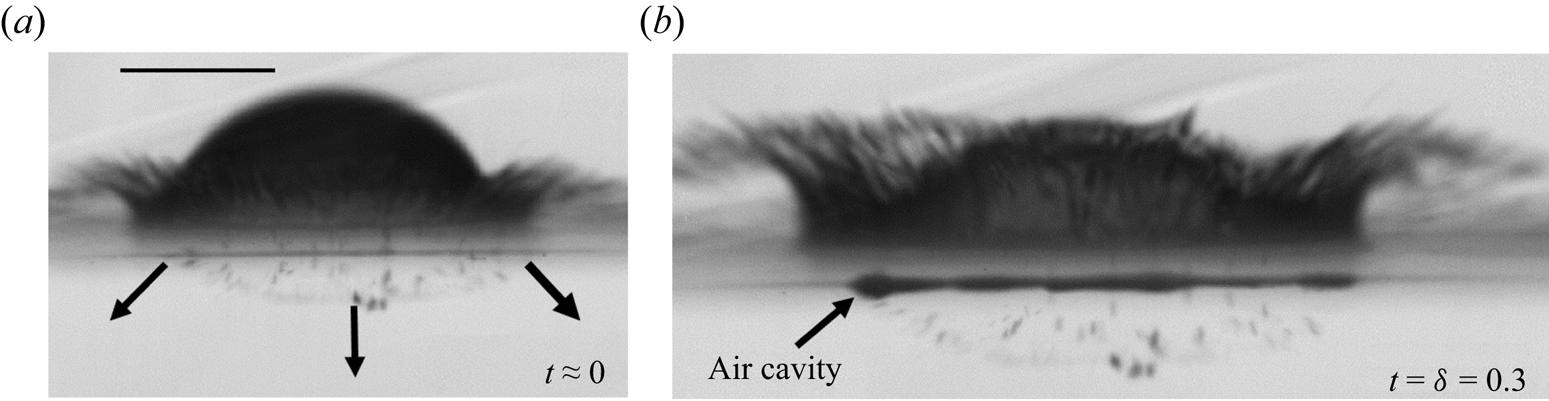
When the drop impacts the liquid substrate, the impact initially imparts a downward velocity to the fluid parcels in immediate contact with the liquid pool (figure 7a) and the cavity develops. This allows the drop fluid to spread onto the developing cavity floor. The accumulated drop fluid is stretched in the radial direction owing to the cavity's radial expansion. The discontinuity in the velocity distribution at the interface causes the formation of an upward-moving lamella that eventually forms the crown sheet (Yarin & Weiss Reference Yarin and Weiss1995; Roisman & Tropea Reference Roisman and Tropea2002). This upward motion stretches the drop fluid in the vertical direction, leading to the formation of the developing crown sheet. Hence, owing to the initial phase of lubrication with air cushion and establishment of the ejecta sheet and crown, it takes time for the sheet to appear. This time is of the order of the time taken for the air cavity to form below the substrate fluid. For  ${\textit {We}}=900$, we first observe an air cavity appearing below the receiving liquid surface around
 $t=\delta \approx 0.3$, as shown in figure 7(b). Note that a similar time scale of
 $O(0.1)$ for the initial stages of sheet development can be seen in the experiments of Agbaglah et al. (Reference Agbaglah, Thoraval, Thoroddsen, Zhang, Fezzaa and Deegan2015) and numerical simulations of Josserand et al. (Reference Josserand, Ray and Zaleski2016). In sum, the offset
 $\delta$ of the velocity profile in (4.6) accounts for the very initial time needed for sheet formation.
(a) Dynamics in the pool fluid at the instant when the drop fluid seeded with polyethylene microspheres impacts the pool. The impact imparts a downward momentum to the particles in the drop. Scale bar: 2 mm. (b) An air cavity forms, and is seen below the liquid surface at  $t = \delta = 0.3$. The particles in the drop continue moving downward owing to their high initial momentum. In this experiment,
 ${\textit {We}}=900$.
4.2.3. Experimental validation
Now we validate our solution for  $v_s(z,t)$ given by (4.6) against direct experimental measurements introduced in § 2. Figure 8(a) first shows the trajectories of particles that were initially seeded in the impacting drop or the substrate pool. In both cases, all selected particles exhibit linear motion of constant speed for
 $500<{\textit {We}}<1200$ considered, in agreement with the Lagrangian interpretation of (4.5), i.e.
 ${\rm d}v_s/{\rm d}t = 0$ where
 ${\rm d}/{\rm d}t$ denotes material derivative.
(a) Trajectories of particles in the crown sheet that were initially seeded in the impacting drop and the substrate pool. A subset of results for  ${\textit {We}}=900$ is displayed for visual clarity. The same pattern is found for all
 ${\textit {We}}$ used, namely all particles show linear trajectories of constant velocity. (b) Comparison of the analytic solution (4.6), with
 $\delta =0.3$, against the Eulerian sheet flow velocity
 $v_s$ obtained from the particles in a range of experiments with
 $500<{\textit {We}}<1200$. A good agreement between the theory and the experiments is observed.
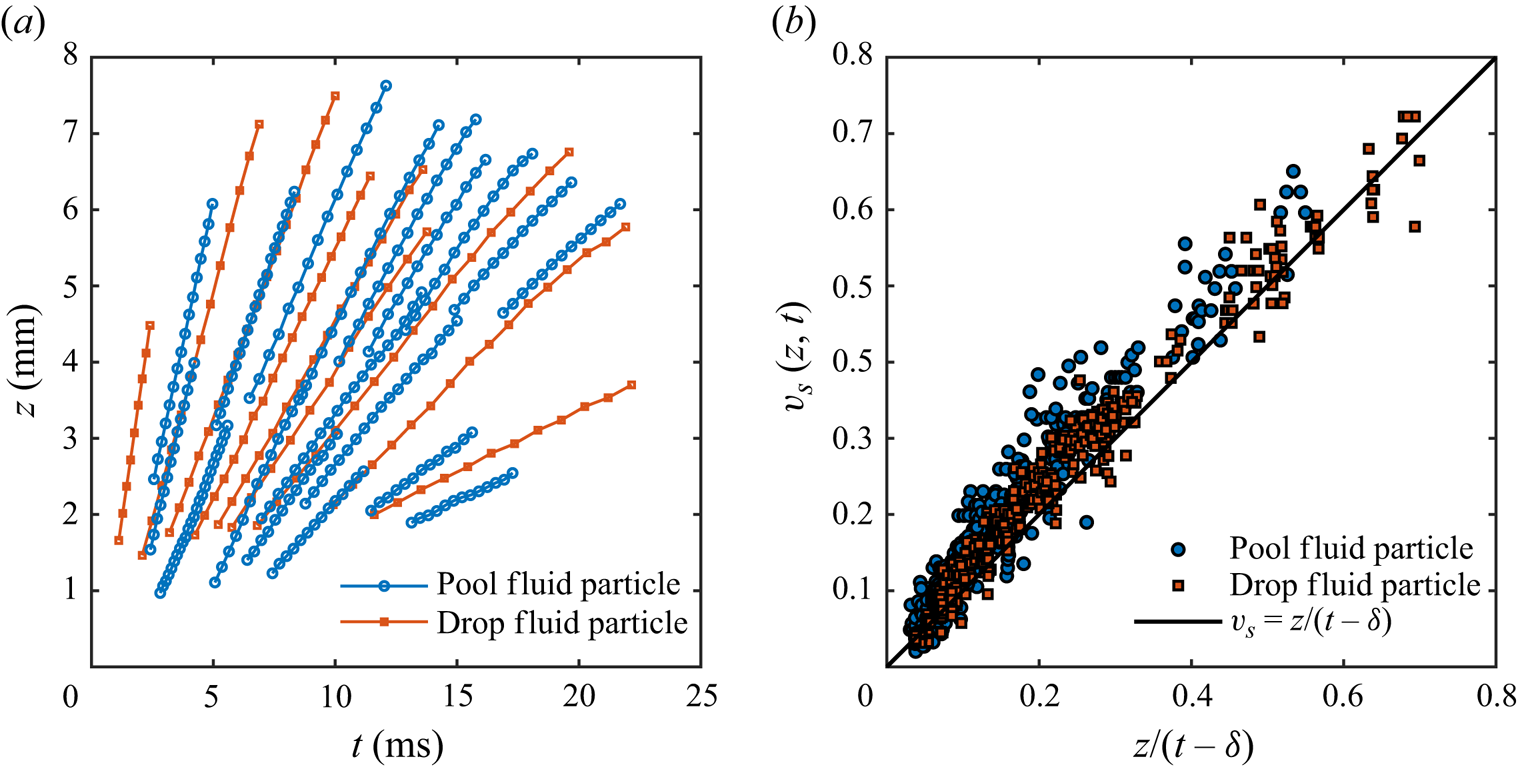
Further, figure 8(b) compares directly the complete integral solution (4.6) with the  $v_s$ measurements obtained from experimental particle trajectories. For both cases of seeded impacting drop or pool fluid tracking,
 $v_s(z,t)$ is obtained after averaging six experiments per
 ${\textit {We}}$. The averaged data are captured very well with the theoretical expression with
 $\delta =0.3$. The observation that measurements taken near
 $z=0$ approach
 $v_s=0$ also justifies our choice of the initial linear velocity profile,
 $v_s(z,t_0)\propto z$ for some
 $t_0>\delta$, required to derive (4.6).
4.3. Crown sheet thickness profile
4.3.1. Analytic thin-film model
Now we turn our attention to the thickness profile  $h(z,t)$ of the crown sheet. To derive its governing equations, we utilize the following integral form of the continuity equation (4.2a) and the simplified momentum equation (4.5):
 \begin{equation} I_\chi\equiv \frac{{\rm d}}{{\rm d}t}\int_\varOmega \chi \,{\rm d}V + \oint_{\partial \varOmega} \chi (\boldsymbol{u}-\boldsymbol{u}_b)\boldsymbol{\cdot}\boldsymbol{n} \,{\rm d}A = 0, \end{equation}
where  $\chi =1$ and
 $\chi =v_s$ are used for mass and momentum conservation, respectively, over a subdomain
 $\varOmega \subset \mathcal {D}$. Here
 $\boldsymbol {u}_b$ defines the boundary velocity of
 $\partial \varOmega$, up to an arbitrary tangential component, and
 $\boldsymbol {n}$ is the outward unit normal vector. We make the thin-film approximation as in § 4.2.1 and consider a differential volume
 $\varOmega =\mathcal {D}(t)\cap (z,z+{\rm d}z)$, where the volume element reads
 ${\rm d}V(z,t)=A(z,t)\,{\rm d}z={\rm \pi} \ell (t)h(z,t) \,{\rm d}z$. As such, the boundary integral in (4.7) can be evaluated using (4.4a,b), the Taylor expansion
 $v_s(z,t)\sim v_s+\partial v_s/\partial z \,{\rm d}z$ and the kinematic condition for the liquid–air interface, which reads
 \begin{equation} (\boldsymbol{u}-\boldsymbol{u}_b)\boldsymbol{\cdot}\boldsymbol{n}=0. \end{equation}
Therefore enforcing  ${\rm d}I_\chi /{\rm d}z=0$ as a result of (4.7) leads to governing equations for
 $h$ that read
 \begin{gather} \frac{\partial}{\partial t}\left[h(z,t)\ell(t)\right]+\frac{\partial}{\partial z}\left[v_s(z,t)h(z,t)\ell(t)\right]=0, \end{gather}
 \begin{gather}\frac{\partial}{\partial t}\left[v_s(z,t)h(z,t)\ell(t)\right]+\frac{\partial}{\partial z}\left[v_s(z,t)^2h(z,t)\ell(t)\right]=0. \end{gather}
We can derive the analytic solution, with substitution of (4.1) and (4.6) in the limits  $t\gg c$ and
 $t\gg \delta$ into (4.9), giving
 \begin{gather} \frac{\partial h}{\partial t}+\frac{z}{t}\frac{\partial h}{\partial z}+\frac{7h}{5t}=0, \end{gather}
 \begin{gather}\frac{\partial h}{\partial t}-\frac{z}{t}\frac{\partial h}{\partial z}-\frac{13h}{5t}=0, \end{gather}
which can be integrated directly as
 \begin{equation} h(z,t)=\frac{\beta t^{3/5}}{z^2}, \end{equation}
where  $\beta$ is a constant to be determined from initial conditions. Note that because (4.9) is homogeneous and linear in
 $\ell$, the proportionality factor
 $\alpha$ that would appear in (4.1) for the crown diameter, and which was found to be
 $O(1)$ for all
 ${\textit {We}}$, does not affect the crown thickness profile.
Notably, our theoretical profile (4.11) implies that the crown sheet thickness increases over time at any given height in its domain. This quality agrees with the estimated sheet thickness measurements of Cossali et al. (Reference Cossali, Marengo, Coghe and Zhdanov2004) in the thin-film regime, but contrasts the finding of Aljedaani et al. (Reference Aljedaani, Wang, Jetly and Thoroddsen2018) where the crown wall rising from a thin film of lower viscosity stretches and thins quickly over time.
4.3.2. Experimental validation
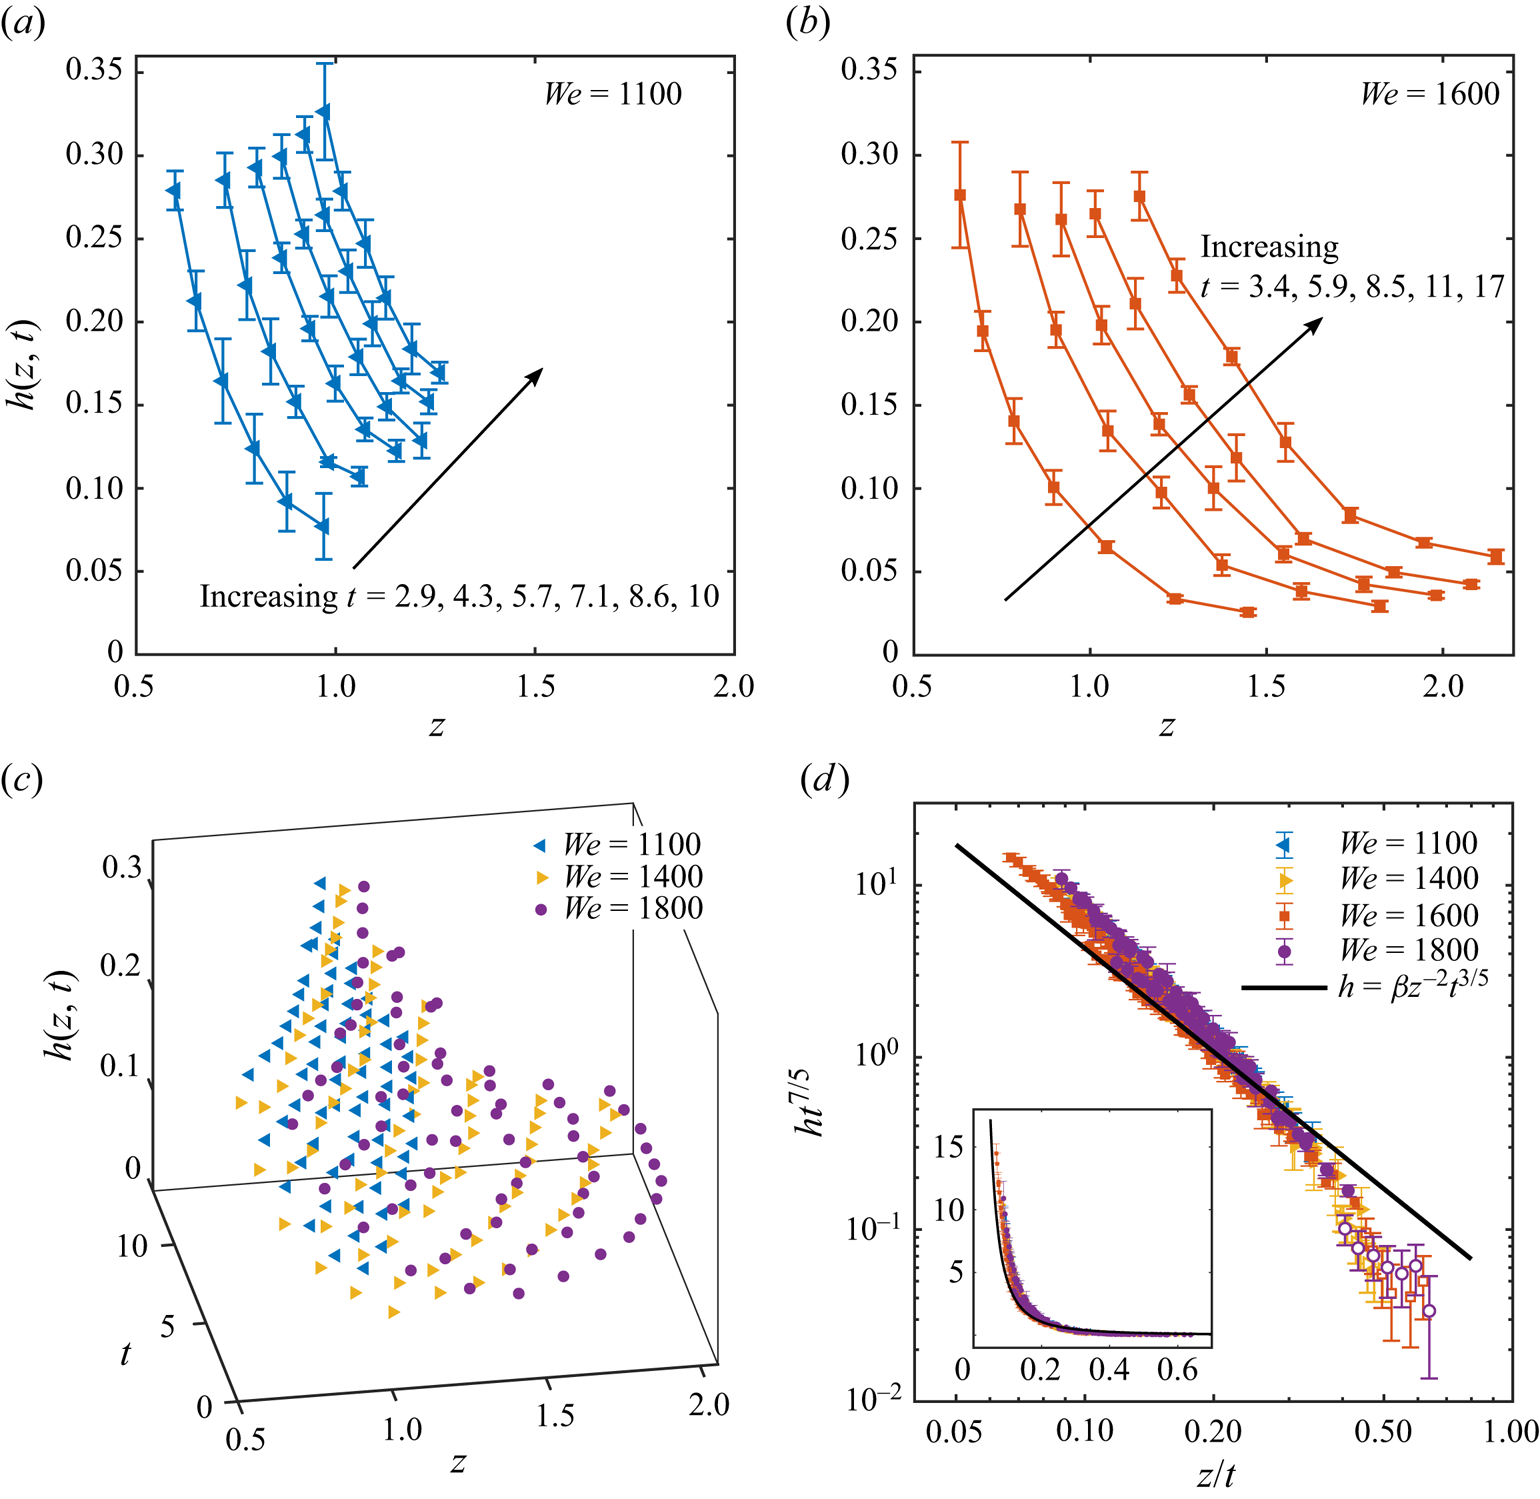
Here we present the light absorption measurements of thickness  $h$ discussed in § 2 and make comparison with the similarity solution (4.11). First, for two different
 ${\textit {We}}$, figure 9(a,b) gives
 $h$ profiles as a continuous function of
 $z$ at an increasing sequence of times. We clearly observe sheet thinning (decrease of
 $h$) in the axial direction at any given time and local sheet expansion (increase of
 $h$) as time increases. The behaviour of
 $h$ associated with different
 ${\textit {We}}$ is qualitatively similar. Indeed, figure 9(c) shows a three-dimensional scatter of
 $h$ measurements in the
 $(z,t)$ space, where results from four different
 ${\textit {We}}$ show little variation as the data appear to lie on a common surface. Finally, figure 9(d) shows that the similarity profile (4.11) collapses all experimental data from figure 9(c) very well, with
 $\beta \approx 0.044$. We verify such a
 $\beta$ value alternatively using initial values in the next section. Our analytical model shows larger discrepancy against initial measurements taken at small
 $t=t_0=1$. This deterioration is likely affected by the accuracy of the asymptotic crown size,
 $\ell \propto t^2/5$, enabled by the assumption
 $t\gg c$ in (4.1) that is necessary in the derivation of (4.11).
Evolution of the crown sheet thickness profile  $h(z,t)$. We show the axial distribution of
 $h$ at various times for (a)
 ${\textit {We}}=1100$ and (b)
 ${\textit {We}}=1600$. (c) A three-dimensional scatter of
 $h(z,t)$ for
 $1100<{\textit {We}}<1800$, where variations due to different
 ${\textit {We}}$ are found to be small. (d) Direct comparison of all measurements and the similarity solution (4.11). The data collapse and agree with the theory very well. Largest relative deviations are found among initial data taken at
 $t=t_0=1$, marked by open symbols. The inset gives the same plot using linear scales, where the absolute error made by the theory remains small. Note that the measurements of thickness start at
 $z = 0.5$ to ensure that the region of most extreme curvature due to the wave swell is not included (recall the region of high curvature at the wave swell boundary seen in figure 4).
4.4. Crown height evolution
Having developed accurate models for the crown diameter  $\ell$, axial velocity
 $v_s$, and sheet thickness
 $h$ as key components, we finally formulate in this section an ODE system for the crown height evolution
 $s(t)$. The initial-value problem is solved both numerically and asymptotically, leading to the discovery of
 ${\textit {We}}^{5/7}$ scaling for the crown rise that captures the experiments well.
4.4.1. Governing equations
As illustrated in figure 4(d), in our approximation of the crown's axial rise, we choose a control volume around an idealized toroidal rim and neglect the mass and momentum flux loss due to secondary droplet ejection for now. Based on the same principle of (4.7), the mass and momentum conservation for the rim read here as
 \begin{gather} \frac{\rm \pi}{4}\frac{\partial}{\partial t}\left[\ell(t)b(t)^2\right]=\left[v_s(s,t)-\dot{s}(t)\right]\ell(t)h(s,t), \end{gather}
 \begin{gather}\frac{\rm \pi}{4}\frac{\partial}{\partial t}\left[\ell(t)b(t)^2\dot{s}(t)\right]={-}\frac{2\ell(t)}{{\textit{We}}}-\frac{{\rm \pi} \ell(t)b(t)^2}{4{\textit{Fr}}}+\ell(t)h(s,t)\left[v_s(s,t)-\dot{s}(t)\right]v_s(s,t), \end{gather}
where  $b(t)$ is the ring diameter. Importantly, we formally incorporate surface tension and gravity in the momentum equation (4.12b) while neglecting viscous stresses in the
 $Re\to \infty$ limit informed by the
 $Re$ values given in table 1. The inviscid simplification is supported by Oguz & Prosperetti (Reference Oguz and Prosperetti1990), Trujillo & Lee (Reference Trujillo and Lee2001) and Roisman & Tropea (Reference Roisman and Tropea2002) who found that for high-velocity impacts on thin films, viscous effects on the dynamics of crown formation are small. As a result, the ODE system (4.12), parametrized by
 ${\textit {We}}$ and
 ${\textit {Fr}}$, can be solved using numerical integration, provided with suitable initial values discussed next. We note again that (4.12) is linear in
 $\ell$, rendering the equations independent of
 $\alpha$ in (4.1).
4.4.2. Initial conditions
Considering the delay of crown sheet formation caused by early drop impact, as discussed in § 4.2.2, we select initial values for (4.12) at  $t=t_0=1$ from experimental measurements when the crown structure has reasonably emerged. Figure 10(a–c) shows snapshots of the crown at
 $t=t_0$ for increasing
 ${\textit {We}}$. It is generally observed that the initial crown height
 $s_0$ slowly increases with
 ${\textit {We}}$. To simplify, we choose an averaged approximation of
 $s_0=s(t_0) \approx 0.5$ and
 $\ell _{0}=\ell (t_0) \approx 1.7$ next, citing an overestimation (or underestimation) of size of the order of
 $10\,\%$ relative to the measurements obtained at low (or high)
 ${\textit {We}}$ values. Further, we estimate that the initial axial growth rate is approximately
 $\dot {s}_0 =\dot {s}(t_0) \approx s_{0}/ t_{0}$. Also, at this time the rim thickness is estimated in experiments to be
 $b(t_0) \sim O (0.01)$, and therefore we conveniently choose
 $b_{0}=b(t_0) \approx 0$. In sum, we have
 \begin{equation} s(1)=\dot{s}(1)=1/2,\quad b(1)=0. \end{equation}
In Appendix B, we show that our model (4.12) is robust to uncertainties associated with initial value  $s_0$ across all
 ${\textit {We}}$.
(a–c) Initial crown shapes taken at  $t=t_0=1\pm 0.03$ for increasing
 ${\textit {We}}$: (a)
 $We=500$, (b)
 $We=990$ and (c)
 $We=1440$. Crown diameter
 $\ell _0$ and height
 $s_0$ are labelled. (d) Initial cavity of a cylindrical shape at
 $t=t_0$ for
 ${\textit {We}} = 1070$, highlighting depth
 $D_0=0.23$. Scale bar: 2 mm for all panels.
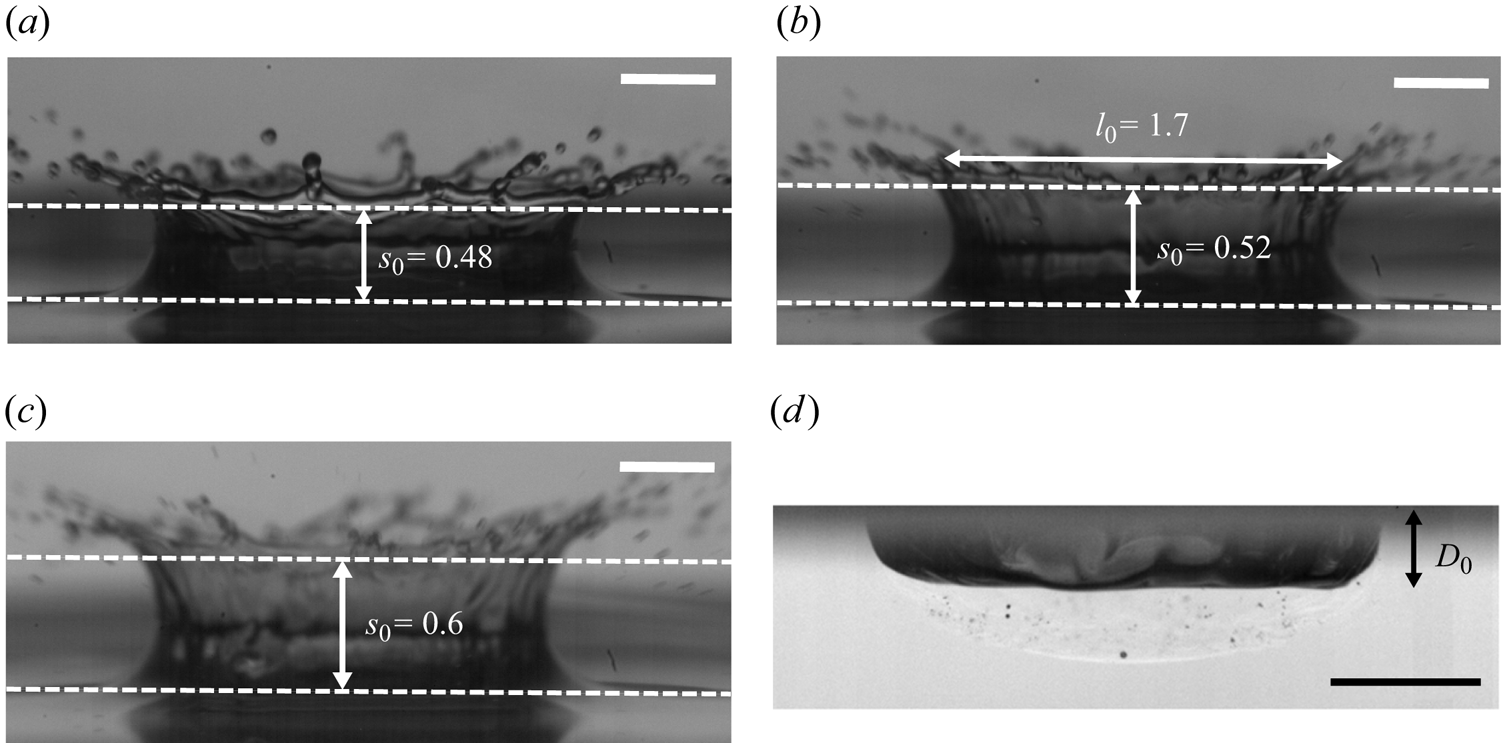
Meanwhile, figure 10(d) shows that at  $t=t_0=1$ the cavity has not yet reached a spherical cap shape; instead, it is a cylinder of depth
 $D(t_0)=D_0\approx 0.23$ and width comparable to
 $\ell _0\approx 1.7$. The associated
 $D_0$ value is close to the data at initial times reported by Engel (Reference Engel1967) and Elmore, Chahine & Oguz (Reference Elmore, Chahine and Oguz2001). As a result, we estimate next the coefficient
 $\beta$ in (4.11) by equating the volume of the crown at
 $t=t_0$, as a cylindrical wall, and that of the cavity, as a cylinder. Notably at this time, a spherical cavity has not yet formed and our cavity model discussed in § 3 does not apply. This gives
 \begin{equation} h_0\ell_0s_0 = \tfrac{1}{4}\ell_0^2D_0, \end{equation}
where  $h_0=h(s_0,t_0)$ given by (4.11) is used as initial thickness. It immediately follows that
 $\beta =0.049$, in good agreement with the value given in § 4.3.2. This reasonable match also demonstrates the robustness of the estimated initial values
 $s_0$ and
 $\ell _0$ against measurements of all
 ${\textit {We}}$ previously used in the least-squares fit.
4.4.3. Asymptotic solution
Now we return to (4.12) and derive an asymptotic solution for  $s$. First, substituting (4.1), (4.6) and (4.11) into (4.12a) gives a first-order ODE for
 $b(t)$ that can be directly integrated to generate
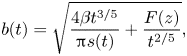 \begin{equation} b(t)=\sqrt{\frac{4\beta t^{3/5}}{{\rm \pi} s(t)}+\frac{F(z)}{t^{2/5}}}, \end{equation}
where  $F(z)$ is in general an arbitrary function of
 $z$. However, the initial conditions (4.13a,b) require that
 $F=-8\beta /{\rm \pi}$.
Meanwhile, (4.12b) can be rearranged using (4.12a) to read
 \begin{equation} b^2\ddot{s}={-}\frac{8}{ {\rm \pi}{\textit{We}}} - \frac{b^2}{{\textit{Fr}}} + \frac{4h(s,t)}{{\rm \pi} }\left[v_s(s,t)-\dot{s}\right]^2. \end{equation}
Because  $h\lesssim b(t)<1$ and
 $1/{\textit {Fr}}\ll 1$, we proceed with the limit that
 $b^2/{\textit {Fr}}\to 0$. As a result, the gravitational effects are assumed to be negligible compared with the capillary effects in (4.16). This assumption is justified in Appendix B where we show the ratio between
 $|b^2/{\textit {Fr}}|$ and
 $|8/({\rm \pi} {\textit {We}})|$ is small over time at least up to the time of maximum heights. Therefore, substituting (4.6), (4.11) and (4.15) into the leading-order form of (4.16) in this limit leads to the asymptotic solution
 \begin{equation} s(t) = \frac{4\beta t}{{\rm \pi} F(z)}W_0\left(\frac{{\rm \pi} F}{4\beta}\exp\left(-\frac{25}{42\beta{\textit{We}}}t^{7/5}+k_1 t^{{-}1}+k_2\right)\right), \end{equation}
where  $W_0$ is the principal Lambert's
 $W$ function and
 $k_{1,2}$ are constants determined using the initial conditions (4.13a,b) again. After some simplification, we obtain
 \begin{equation} s(t) ={-}\frac{t}{2} W_0\left(-\exp\left({-}1-\frac{25 t^{12/5}-60t+35}{42\beta t {\textit{We}}}\right)\right), \end{equation}
where  $\beta \approx 0.044$ was determined from two independent methods in §§ 4.3.2 and 4.4.2. Further applying the limit
 ${\textit {We}}\to \infty$ to (4.18) leads
 $s(t)\to t/2$, as expected from the evaluation of the initial values (4.14).
Our asymptotic result for the crown height  $s(t)$ given in (4.18) already differs from that of the cavity depth
 $D(t)$ given in (3.4). The sheet height (4.18) is controlled by
 ${\textit {We}}$, independent of
 ${\textit {Fr}}$, while the cavity depth (3.4) depends on
 ${\textit {Fr}}$ but not on
 ${\textit {We}}$. We discuss the physical significance of this result shortly.
4.4.4. Maximum crown height
Here we seek analytical expressions for the maximum crown height,  $s_m$, and its time of occurrence,
 $t_m$, based on the explicit asymptotic solution (4.18). As we have shown, such a maximum exists only if
 ${\textit {We}}>0$ is finite, because
 $s(t)\to t/2$ as
 ${\textit {We}}\to \infty$. Differentiating (4.18) with respect to
 $t$ and requiring
 $\dot {s}(t_m)=0$ yields
 \begin{equation} \frac{5}{t_m}-5t_m^{7/5}+6\beta {\textit{We}} + 6\beta{\textit{We}}\, W_0\left(-\exp\left({-}1-\frac{25 t_m^{12/5}-60t_m+35}{42\beta t_m {\textit{We}}}\right)\right)=0. \end{equation}
Considering that  $t_m$ is expected to be of
 $O(10)$ and
 ${\textit {We}}$ is large, (4.19) can be approximately solved as
 ${\textit {We}}\to \infty$ after removing terms of
 $O(1/t_m)$ in (4.19) as
 \begin{equation} t_m = \left[\frac{\beta{\textit{We}}}{10}\left(12+7W_0\left(-\frac{12}{7}\exp\left(\frac{10}{7\beta{\textit{We}}}-\frac{12}{7}\right)\right)\right)\right]^{5/7}\sim (K\beta {\textit{We}})^{5/7}, \end{equation}
where  $K=[12+7W_0(-12{\rm e}^{-12/7}/7)]/10\approx 0.837$.
Finally, substituting (4.20) into (4.18) produces an explicit approximation of the maximum crown height, which can be expanded as  ${\textit {We}}\to \infty$ as
 \begin{equation} s_m=s(t_m)\sim{-}\frac{1}{2}W_0\left(-\exp\left({-\frac{25 K}{42}-1}\right)\right) (K\beta {\textit{We}})^{5/7} +O\left({{\textit{We}}^{{-}2/7}}\right). \end{equation}
We find that  $t_m$ and
 $s_m$ grow asymptotically as
 ${\textit {We}}^{5/7}$ for large
 ${\textit {We}}$ and all
 ${\textit {Fr}}$, provided that the assumption
 $b^2/{\textit {Fr}}\ll 1$ holds. Notably, Cossali et al. (Reference Cossali, Marengo, Coghe and Zhdanov2004) observed similar scaling for the maximum crown height and its occurring time resulting from drop impact on a thin film. In their study, experimental measurements are fitted to the power law
 $s_m\propto {\textit {We}}^p$ and
 $t_m\propto {\textit {We}}^p$ with
 $0.65< p<0.75$, consistent with our exact exponent of
 $5/7\approx 0.71$ derived here for deep-pool impacts.
4.4.5. Experimental and numerical results
Next, the asymptotic theory developed in (4.18), (4.20) and (4.21) is compared with experiments and the numerical solution of the crown height  $s(t)$. Here the ODE system (4.12) with initial values (4.13a,b) is solved using a variable-order Runge–Kutta method.
Figure 11(a) gives the crown height evolution  $s(t)$ for
 $600<{\textit {We}}<1600$. In all cases, the numerical solution (4.12) and the asymptotic solution (4.18) capture the experimental data very well. As expected, the distinctions between numerical and analytical results are small until maximum height
 $s_m$ is reached, beyond which the theoretical predictions start to underestimate the measurements. This deterioration is more significant as
 ${\textit {We}}$ increases. A likely explanation to this observed deviation is that we have neglected the topological changes of the rim and the associated mass loss due to droplet shedding in our reduced geometrical model.
Evolution of the crown height  $s$. Results for a wide range of
 ${\textit {We}}$, as labelled in (b), are given. The corresponding
 ${\textit {Fr}}$ values are the same as those found in figure 5. (a) The
 $s(t)$ measurements are compared with the numerical solution to (4.12) and asymptotic theory (4.18) for each
 ${\textit {We}}$, using solid and dashed lines, respectively. We see a good match between experiments and our model. (b) All results collapse well after rescaling both
 $s$ and
 $t$ by
 ${\textit {We}}^{5/7}$. The collapsed data can be successfully captured by our model using either
 ${\textit {We}}=632$ (small) or
 ${\textit {We}}=1530$ (large).
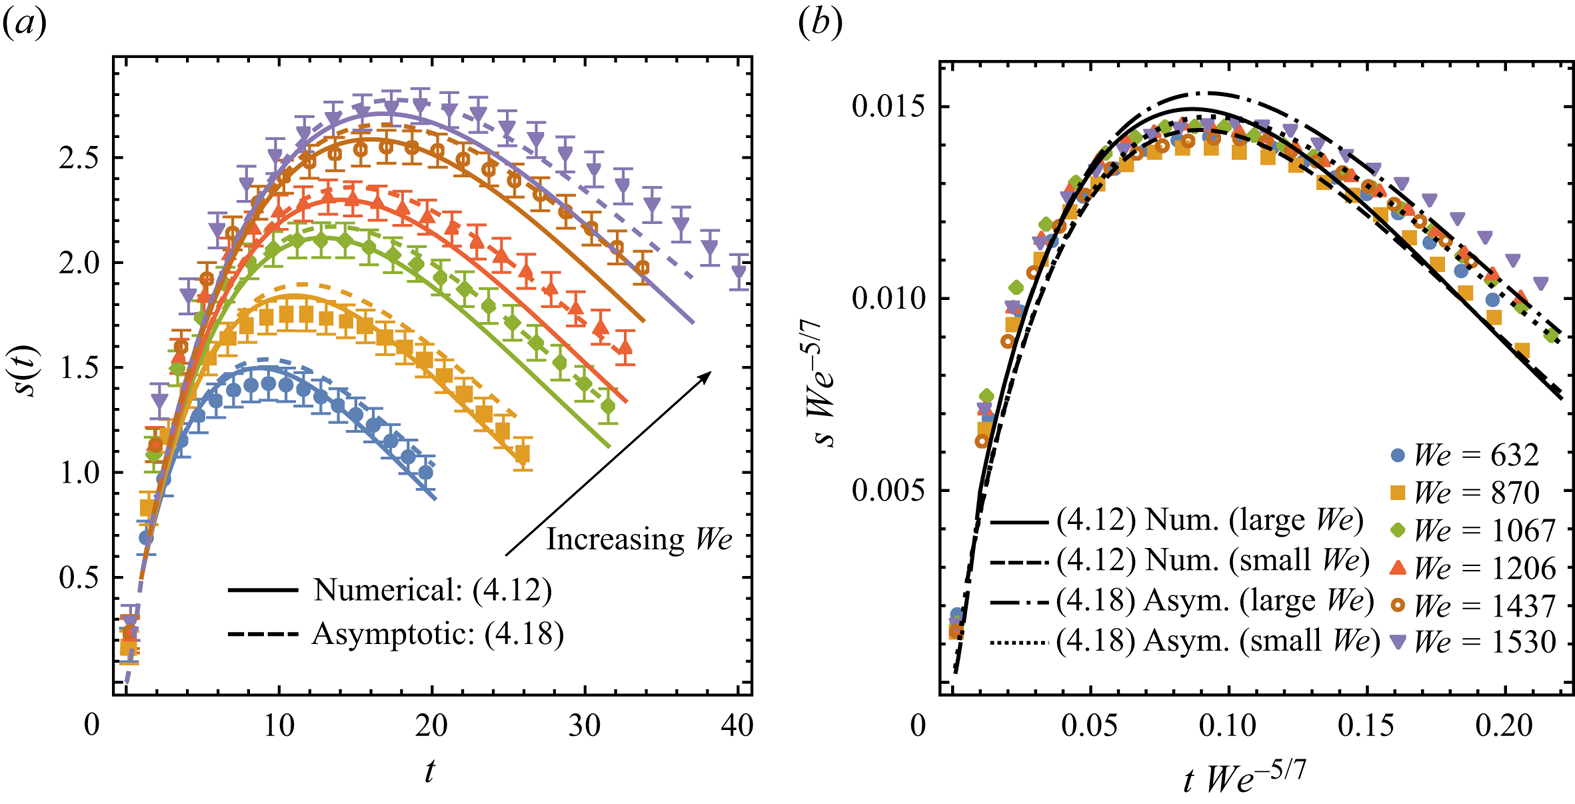
Although in figure 11(a) we observe prolonged crown growth to higher peak heights as  ${\textit {We}}$ increases, rescaling both
 $s$ and
 $t$ with
 ${\textit {We}}^{5/7}$, as informed by the asymptotic forms in (4.21) and (4.20), collapses the data beautifully (figure 11b).
Finally, the key findings of (4.20) and (4.21) are that both the maximum crown height  $s_m$ and the time
 $t_m$ of its occurrence scale as
 ${\textit {We}}^{5/7}$ for the entire range of
 ${\textit {Fr}}$ in the limit of large
 ${\textit {We}}$. Figure 12 compares this theoretical finding with experiments. Comparison of
 $s_m$ as a function of
 ${\textit {We}}$ among measurements, numerical solutions of (4.12) calculated using the same discrete experimental (
 ${\textit {We}},{\textit {Fr}}$) parameters and the asymptotic expressions (4.18) and (4.21) that only depend on
 ${\textit {We}}$ is given in figure 12(a). It is established that the asymptotic relation
 $s_m\propto {\textit {We}}^{5/7}$ captures the experimental data very well. The analogous comparison for
 $t_m$ is shown in figure 12(b), where again the theoretical expression
 $t_m\propto {\textit {We}}^{5/7}$ captures the experimental data very well.
(a) Maximum crown height  $s_m$ and (b) its time of occurrence
 $t_m$ as a function
 ${\textit {We}}$. In both panels, the numerical solutions given by the filled circles are obtained from (4.12) with the same
 ${\textit {We}}$ and
 ${\textit {Fr}}$ values as those corresponding experiments. The asymptomatic theory of (4.18) in (a,b) are shown by the solid lines; and their large-
 ${\textit {We}}$ behaviours that grow as
 ${\textit {We}}^{5/7}$, i.e. (4.21) for
 $s_m$ and (4.20) for
 $t_m$, are given by the dashed lines. We clearly demonstrate that such theoretical scaling captures the measurements very well.

Having established accuracy for both asymptotic results (3.4) and (4.18) respectively for the cavity depth and the crown height, we note that unlike the cavity that retracts because of gravitational effects acting on the liquid (see § 3.2), the crown growth up to a finite maximum height is primarily governed by surface tension effects encapsulated by finite  ${\textit {We}}$. Indeed (4.18) is independent of
 ${\textit {Fr}}$, and both
 $s_m$ and
 $t_m$ diverge in the limit of
 ${\textit {We}}\to \infty$. In sum, it is surface tension rather than gravity that stops an unbounded crown rise.
4.5. Summary
In this section we discuss the theoretical analysis of four quantities that characterize the crown sheet dynamics resulting from a drop-on-pool impact. According to the idealization shown in figure 4, our model entails the crown diameter  $\ell$, the axial flow velocity
 $v_s$, the sheet thickness
 $h$ and the crown height
 $s$, not considering, for now, the destabilization of the rim, precursor of ligament formation and fragmentation into secondary droplets. We coupled the crown and cavity via the crown diameter
 $\ell$ observed to be proportional to the cavity depth. We consider the crown as a thin sheet, i.e.
 $h\ll \ell$,
 $h\ll s$, and consequently the flow field is Q1D. We solve conservation of mass and momentum asymptotically, deriving explicit expressions that predict the corresponding measurements well, as summarized in table 2. These asymptotic results are parametrized in terms of
 ${\textit {We}}$ only, independent of
 ${\textit {Fr}}$.
Key quantities that describe the crown structure generated by a drop impact (figure 4d). A summary of their corresponding modelled equations, asymptotic solutions and validations against experimental measurements.

5. Summary and conclusions
In conclusion, we have addressed a sequence of events that follow the impact of a liquid droplet on a deep inviscid liquid pool, including the cavity and crown formation. We use a combined approach of experimental measurements and theoretical modelling to study the cavity–crown coupled system, with a focus on impacts with Weber numbers  $500<{\textit {We}} < 1600$ and Froude numbers
 ${\textit {Fr}}<1000$, such that a crown splash is enabled while preventing bubble formation.
We first verify that by simplifying the cavity as an ascending sphere of expanding radius, the numerical theory of Bisighini et al. (Reference Bisighini, Cossali, Tropea and Roisman2010) that describes the cavity using an ODE system successfully captures the temporal evolution of cavity depth  $D(t)$ that we measure. In particular, we find that the early stage of the cavity growth follows the power law
 $D(t)\sim t^{2/5}$ derived as the limiting solution to the ODE system as both
 ${\textit {We}}\to \infty$ and
 ${\textit {Fr}}\to \infty$. Informed by such limit, we show that rescaling depth data using
 ${\textit {We}}^{-1/5}D(\tau )$ as a function of dimensionless capillary time
 $\tau$ collapses experimental measurements well for our range of
 ${\textit {We}}$ and
 ${\textit {Fr}}$.
However, the initial dynamics of  $t^{2/5}$ growth is unable to explain the experimentally observed cavity retraction after a maximum depth is reached. To recover this behaviour, we develop an asymptotic correction to the original double limit as a function of
 ${\textit {Fr}}$, so that the large-
 ${\textit {Fr}}$ condition is relaxed. The resulting analytical expression for
 $D(t)$ possesses a global maximum and reasonably captures the experimental data up to the measured maximum depth. We conclude that gravitational effects acting on the displaced liquid are the primary restoring process causing cavity retraction.
We next examine the crown structure as a double-sided cylindrical sheet with an idealized toroidal rim on top. Our key strategy is to connect the crown to the elucidated cavity evolution: the crown diameter  $\ell$ increases at a rate proportional to the initial cavity expansion, namely
 $\ell \sim t^{2/5}$. The proportionality constant of this relation appears to depend on
 ${\textit {We}}$ and
 ${\textit {Fr}}$, although only weakly, and the determination of its specific value is actually not required for our subsequent analysis aiming to elucidate the characteristic quantities of the crown sheet.
Using the key insight of coupling sheet and cavity, and applying the thin-film approximation for the sheet thickness  $h$, we therefore obtain a Q1D flow field for the sheet, with axial velocity
 $v_s(z,t)$ governed by the inviscid Burger equation. The resulting similarity solution to
 $v_s$ predicts ballistic motion of Lagrangian fluid parcels, akin to other thin sheets from drop impact, e.g. on surface of size comparable to that of the drop (Wang & Bourouiba Reference Wang and Bourouiba2017). We experimentally validate this theory using particle velocimetry where the impacting drop and the pool fluids are seeded with tracked particles in independent experiments. Subsequently, using conservation of mass and momentum for the Q1D flow we derive and validate an explicit self-similar solution for the thickness profile
 $h(z,t)$. The derived self-similar thickness profile captures the measured thickness for all
 ${\textit {We}}$ very well. The thickness is measured using a light absorption method validated in prior work (Wang & Bourouiba Reference Wang and Bourouiba2017; Si et al. Reference Si, Wang, Chandrasekhar and Bourouiba2024).
Similarly, by applying conservation laws over the idealized crown rim, we formulate an ODE system that couples the rim size  $b$ and the crown height
 $s$. Building on the previously obtained analytical expressions for
 $\ell$,
 $v_s$ and
 $h$, we solve the associated initial-value problem both numerically and asymptotically in the
 $b^2/{\textit {Fr}}\to 0$ limit. As a result, we derive theoretical predictions of
 $s(t)$ in good agreement with the experimental data for the entire duration of the splash, including the initial rise and the following fall, for all
 ${\textit {We}}$. From the asymptotic solution that is parametrized by
 ${\textit {We}}$ only, we further determine analytically the maximum crown height and its time of occurrence and we show that both scale as
 ${\textit {We}}^{5/7}$. Indeed, rescaling the
 $s(t)$ data using
 $s{\textit {We}}^{-5/7}$ as a function of
 $t{\textit {We}}^{-5/7}$ shows excellent collapse of all measurements from different
 ${\textit {We}}$. We therefore conclude that unlike the cavity whose expansion is opposed by gravitational effects, the axial crown rise is mostly opposed by surface tension effects.
Our analysis, rooted here on considering the cavity–crown coupled system, paves the way to understand the ultimate liquid fragmentation process as a result of impact and splash where secondary droplets with a distribution of sizes and speeds are ejected from the crown rim. Such fast-moving secondary droplets are critically important for contaminant and pathogen dispersal in agriculture, healthcare, and the environment (Bourouiba Reference Bourouiba2021b,Reference Bourouibaa) sectors. Further, insights into a single-phase impact could be extended to impacts with multiphase liquid layers that are relevant in a wide range of applications including oil spills (e.g. Murphy et al. (Reference Murphy, Li, d'Albignac, Morra and Katze2015), and references therein), and the climate system modelling, via ocean-atmosphere coupling upon creation of droplet residues and condensation nuclei via such deep pool splashes. Understanding the role of secondary droplets and the influence of a multiphase layer in contaminant dispersal is the subject of our ongoing work.
Supplementary movies
Supplementary movies are available at https://doi.org/10.1017/jfm.2024.1105.
Funding
This research was supported, in part, by USDA-NIFA Specialty Crop Research Initiative Grant Award no. MDW-2016-04938, the Richard and Susan Smith Family Foundation, the National Science Foundation, the Centers for Disease Control and Prevention–National Institute for Occupational Safety and Health, Inditex and the National Institute of Allergy and Infectious Diseases of the National Institutes of Health under award number 5P01AI159402.
Declaration of interests
The authors report no conflict of interest.
Data availability statement
The data that support the findings of this study are available upon reasonable request.
Appendix A. Asymptotic expansion of the cavity and sheet equations
A.1. The cavity equations for large  ${\textit {We}}$

Here we perform a formal asymptotic expansion of the cavity evolution equation (3.1) in terms of small parameter  $\delta \equiv 1/{\textit {We}}\ll 1$ and derive (3.5b) as the leading-order solution for large
 ${\textit {We}}\gg 1$, in the strict limit of
 ${\textit {Fr}}\to \infty$. In this limit, together with the initial condition
 $\dot {z}(t_0)=0$, we note again that the coupling between cavity centre
 $z_c$ and radius
 $a$ is weak. Therefore we proceed with the constant solution
 $z_c(t)=z_c(t_0)$, and consequently,
 $D(t)=a(t)+z_c(t_0)$. Further, we substitute the series expansion
 $a(t)=\sum _{n\geqslant 0} a_n \delta ^n$ into (3.1a), giving
 \begin{gather} a_0^2\ddot{a}_0+\tfrac{3}{2}a_0\dot{a}_0^2=0, \end{gather}
 \begin{gather}a_0^2\ddot{a}_1+3a_0\dot{a}_0\dot{a}_1+\left(\tfrac{3}{2}\dot{a}_0^2+2\dot{a}_0\ddot{a}_0\right)a_1+2=0, \end{gather}
at  $O(1)$ and
 $O(\delta )$, respectively. The general solution to the leading-order equation (A1a) is given by (3.2a,b), that is,
 \begin{equation} a_0 = A(t-t_s)^{2/5}. \end{equation}
Therefore using (A2) in (A1b) leads to the following non-divergent first-order solution:
 \begin{equation} a_1 ={-}\frac{25(t-t_s)^{6/5}}{18A^2}+A_1 (t-t_s)^{2/5}, \end{equation}
where both  $A$ and
 $A_1$ are general constants. Combining (A2) and (A3) we obtain the large-
 ${\textit {We}}$ asymptotic solution up to
 $O(\delta )$ as follows:
 \begin{equation} a(t) = A(t-t_s)^{2/5}+\frac{1}{{\textit{We}}}\left[-\frac{25(t-t_s)^{6/5}}{18A^2}+A_1 (t-t_s)^{2/5}\right]+O\left(\frac{1}{{\textit{We}}^2}\right). \end{equation}
Next, the time transformation  $t=\tau /\sqrt {6/{\textit {We}}}$ can be applied to (A4) with the dominant powers of
 ${\textit {We}}$ retained explicitly, producing
 \begin{equation} \frac{D}{{\textit{We}}^{1/5}} \sim \frac{a}{{\textit{We}}^{1/5}} \sim \frac{\tau^{2/5}}{6^{1/5}} - \frac{25 \tau ^{6/5}}{18\times 6^{3/5} A^2 }\frac{1}{{\textit{We}}^{2/5}}.\end{equation}
As  ${\textit {We}}\to \infty$, (A5) establishes that the leading-order behaviour of
 $D$ as a function of capillary time
 $\tau$ is correctly given by (3.5b).
A.2. Lubrication theory for the thin sheet
In this section we derive the Q1D flow velocities given by (4.4a,b) for the rising sheet. Based on the thin-sheet assumption, i.e.  $h(z,t)\ll \ell (t)$, we denote
 $\epsilon =H_0/L_0\ll 1$ the small parameter that compares a characteristic sheet thickness scale
 $H_0$ with a characteristic sheet diameter scale
 $L_0$. Accordingly, we introduce the following local radial coordinate
 $\tilde {r}$ for the sheet's domain described by (4.3):
 \begin{equation} \epsilon \tilde{r} = r-\frac{\ell}{2} \in \left(-\frac{h}{2},\frac{h}{2}\right). \end{equation}
Omitting the subscript ‘s’ in the velocity components, the continuity equation (4.2a) thus becomes
 \begin{equation} \frac{\partial v}{\partial z}+\frac{1}{\epsilon}\frac{\partial u}{\partial \tilde{r}}+\frac{2u}{2\epsilon \tilde{r}+\ell} = 0. \end{equation}
We seek solutions in the form of Taylor series expanded around the central ring,  $\tilde {r}=0$, as follows:
 \begin{equation} u= \sum_{n=1}^\infty u_n(z) \left(\epsilon \tilde{r}\right)^n ,\quad v= \sum_{n=0}^\infty v_{2n}(z) \left(\epsilon \tilde{r}\right)^{2n}, \end{equation}
where the symmetry conditions  $u|_{\tilde {r}=0}=0$ and
 $v|_{\tilde {r}}=v|_{-\tilde {r}}$ have been applied. Substituting (A8a,b) into (A7) gives
 \begin{equation} u_1+v_0'+\left[\frac{2 u_1}{\ell}+2u_2\right]\tilde{r}\epsilon+\left[\frac{2\ell u_2-4u_1}{\ell^2}+3u_3+v_2'\right]\left(\tilde{r}\epsilon\right)^2+\cdots=0. \end{equation}
Equation (A9) therefore demands that at leading order,
 \begin{equation} v\sim v_0(z),\quad u \sim u_1 \tilde{r}\epsilon ={-}v_0'(z)\left(r-\frac{\ell}{2}\right)\ll v. \end{equation}
Similarly, higher-order corrections in terms of  $v_n$ can be obtained by successively solving (A9), leading to
 \begin{equation} u_2=\frac{v_0'(z)}{\ell},\quad u_3={-}\frac{2v_0'(z)}{\ell^2}-\frac{v_2'(z)}{3\ell^2}, \quad \dots \end{equation}
so the  $u$-series in (A8a,b) can be summed. In fact, with the approximation
 $v=v_0$, this series converges as
 \begin{equation} u={-}\frac{\tilde{r}\epsilon(\ell+\tilde{r}\epsilon)}{1+2\tilde{r}\epsilon}v_0'(z) = \frac{\ell^2-4r^2}{8r} v_0'(z)\ll v_0(z). \end{equation}
One can readily verify that the flow field given by  $v=v_0$ and (A12) satisfy the continuity equation (4.2a) exactly.
Appendix B. Robustness of the crown height model
Here, we show that the crown height model developed in § 4.4 is robust to experimentally measured initial values, and the limiting assumption of surface tension dominating gravity in (4.16) is valid.
First, we revisit the averaged initial value,  $s_0=\dot {s}_0=0.5$, that has been prescribed to the ODE system (4.12) for all
 ${\textit {We}}$. As observed in figure 10, this approximation overestimates the measurements at low
 ${\textit {We}}$ but underestimates the experiments at high
 ${\textit {We}}$, with margins of around
 $10\,\%$. To account for this uncertainty, here we solve (4.12) (and equivalently (4.16)) numerically with a range of initial values
 $s(1)=\dot {s}(1)=s_0$, while fixing
 $b(1)=0$ constant. Results are given for three different representative
 $\textit{We}$ and compared with the experiments in figure 13(a). Specifically, for a small
 $\textit{We} =630$, the region of solutions corresponding to the initial values between
 $\varrho \equiv (s_0-0.5)/0.5\in (-10\,\%,0)$ is shown; for a medium
 $\textit{We} =1070$, the corresponding region of
 $\varrho \in (-5\,\%,5\,\%)$ is given; and for a high
 $\textit{We} =1530$, solutions are generated using
 $\varrho \in (0,10\,\%)$. In all cases, the range of solution response to initial-value uncertainties remains comparable to the experimental errors. Therefore, we have demonstrated that the crown height dynamics described by (4.12) and our reduced estimation
 $s_0=0.5$ is robust to errors/variability of
 $s_0$.
(a) Crown height,  $s(t)$, shown from measurements and numerical solutions of (4.16) given by variable initial value
 $s_0$ for small, medium and large
 ${\textit {We}}$. Each shaded band corresponds to 10 % variation near
 $s_0=0.5$ at a given
 $\textit{We}$. The solid lines are obtained with
 $s_0=0.5$. The dashed lines are given by
 $s_0=0.5(1\pm 10\,\%)$ for
 $\textit{We} =630$ and
 $1530$, respectively, and
 $s_0=0.5(1\pm 5\,\%)$ for
 $\textit{We} =1070$. (b) Ratio of the two terms that measure gravitional and surface tension effects in the numerical solutions of (4.16). Results as a function of time are given for the same
 $\textit{We}$ and
 $\textit{Fr}$ presented in figure 11.
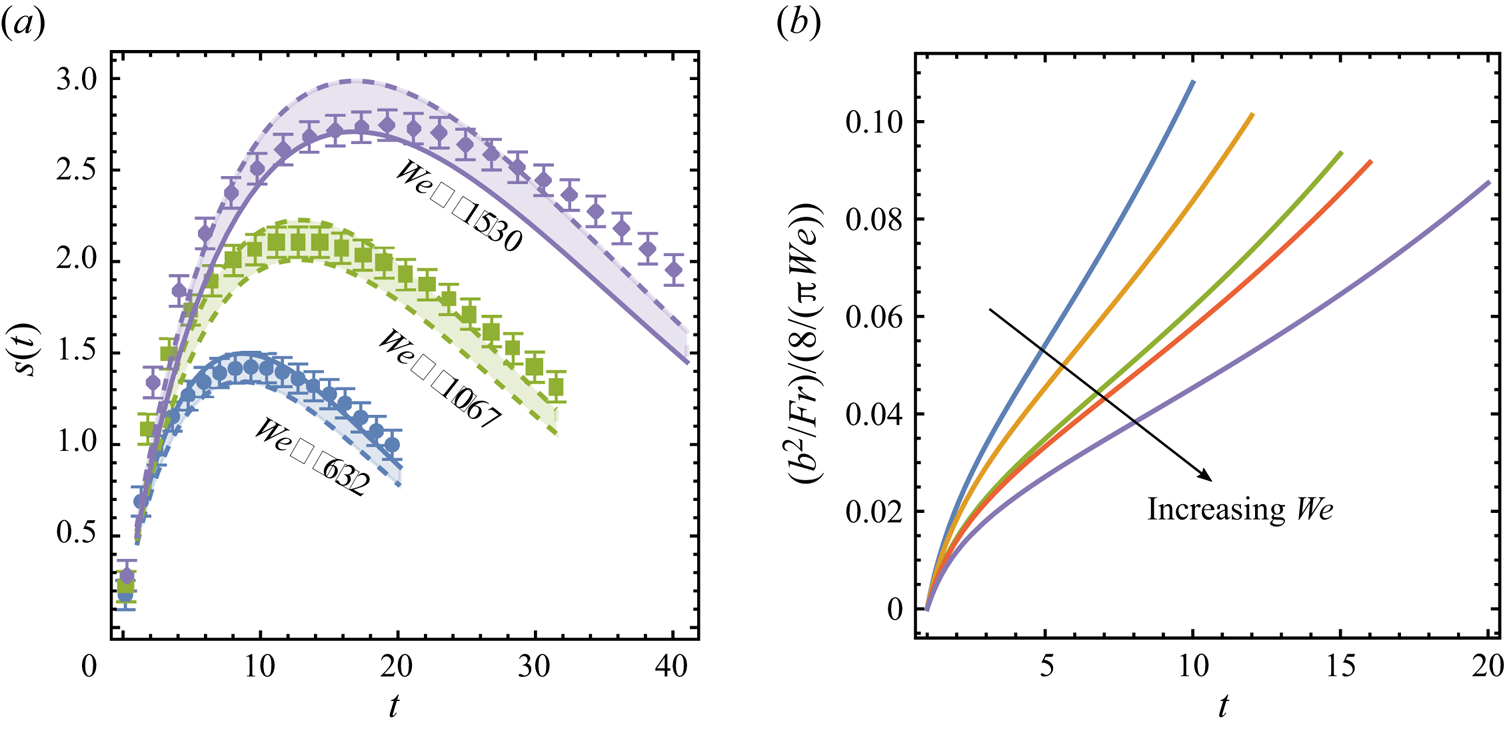
Second, we assess the accuracy of the limiting assumption made to simplify (4.16) and derive (4.18), that is,  $b^2/{\textit {Fr}} \to 0$, and particularly its implication that surface tension plays a dominant role over gravity at opposing the crown rise. In a direct comparison between the two contributions made by gravity and capillarity in (4.18), figure 13(b) gives the size ratio,
 $|b^2/{\textit {Fr}}|/|8/({\rm \pi} {\textit {We}})|$, as a function of time. Here the evolution of
 $b(t)$ is obtained by numerically solving the full system (4.12) of finite
 ${\textit {Fr}}$. We find that for all
 ${\textit {We}}$ (and
 ${\textit {Fr}}$), the gravitational term
 $b^2/{\textit {Fr}}$ makes up less than 10 % of the capillary term
 $8/({\rm \pi} \textit{We} )$ at least until the maximum crown height is reached. Thus, error made by taking the
 $\textit{Fr} \to \infty$ limit for the large-
 $\textit{We}$ asymptotic solution (4.18) is small over this period, explaining the good performance of (4.18), compared with the full solution, shown in figure 11.



